Quality issues in heir organization
ConceptDraw MINDMAP with a new Quality MindMap solution is a perfect additional tool for the quality team of your company. Once a quality problem is identified, mind maps can be of great value in depicting and describing a problem in detail, then structure it, and find the right decision. ConceptDraw MINDMAP is a perfect new tool for visually describing instructions of the processes. Printed on a single page, it is easy to identify the critical points during a conference call.
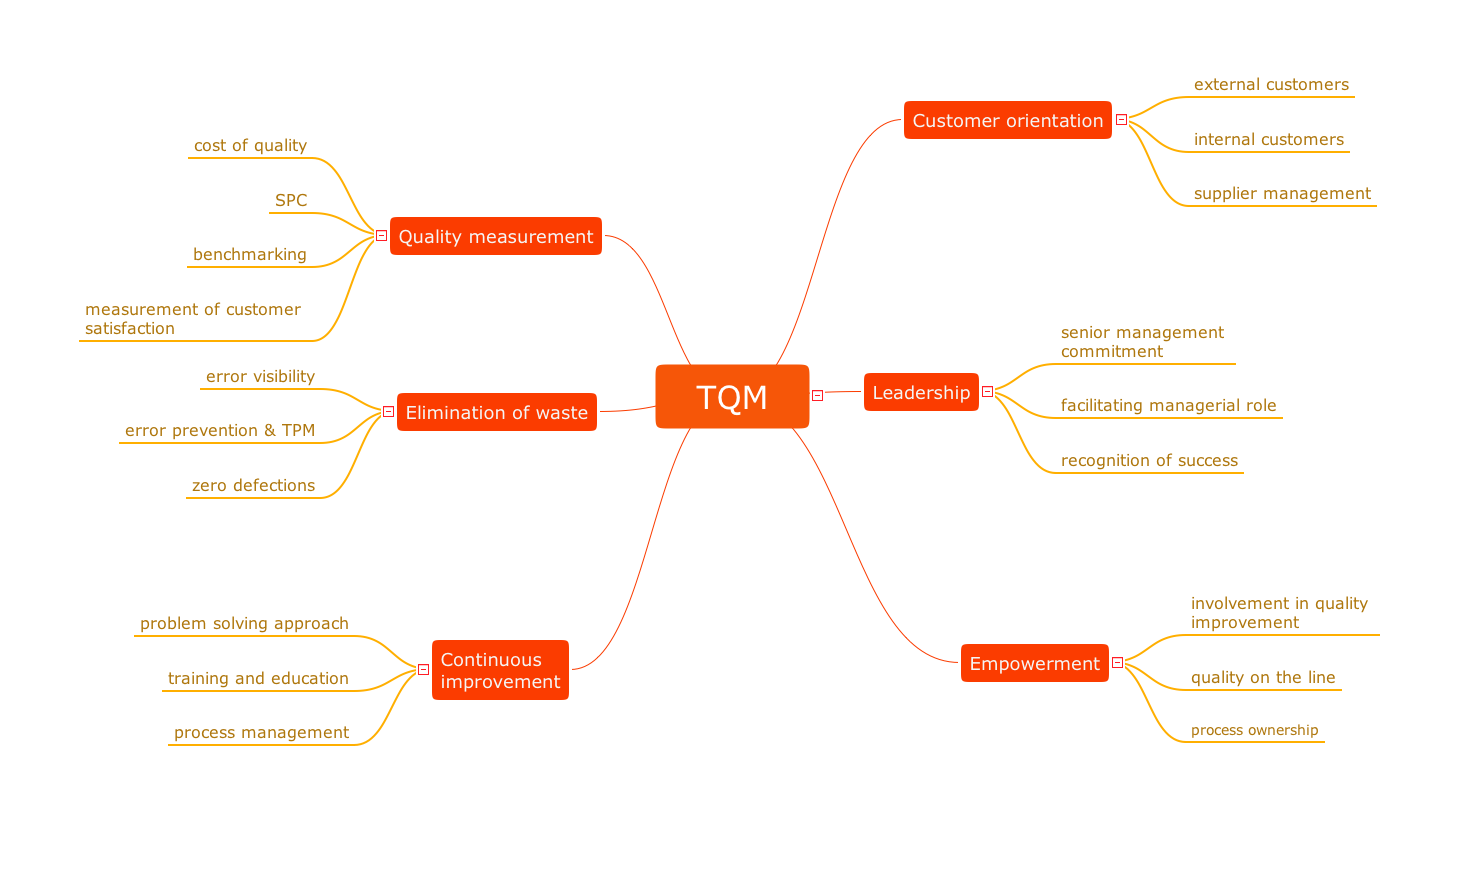
Pic.1 Mind map - Total Quality Management (TQM).
You can use this mindmap to describe your own quality processes, brainstorm, and structure quality issues; then quickly present them to your quality management team.
See also Samples:
NINE RELATED HOW TO's:
For vector shapes and connector tools for quick and easy drawing diagrams for business, technology, science and education - The best choice for Diagramming is ConceptDraw DIAGRAM.
Picture: Diagram Software - The Best Choice for Diagramming
The Total Quality Management Diagram solution helps you and your organization visualize business and industrial processes. Create Total Quality Management diagrams for business process with ConceptDraw software.
Picture: TQM Diagram — Professional Total Quality Management
Related Solution:
Android is a mobile operating system (OS) based on the Linux kernel and currently developed by Google.
One of the most important features of any Android app is, of course, its Android User Interface. It is all what the user sees on the screen of its device and interacts with. Creating of successful Android User Interface and developing Android UI prototypes may be the mighty task. But we recommend you to make it fast and easy in ConceptDraw DIAGRAM specially extended with Android User Interface Solution from the Software Development Area.
Picture: Android User Interface
Related Solution:
This mind map demonstrates how the well-known Total Quality Management (TQM) methodology can be presented in a mind map. Using mind mapping for quality management is a creative approach that allows one to structure all key quality points on the one page.
Picture: Total Quality Management
Related Solution:
Constant improvement of key performance indicators that are related to quality is a step in the right direction for a company interested in market growth.
Picture: Quality Improvement
Related Solution:
ConceptDraw MINDMAP with the ability to import presentations from Microsoft PowerPoint, as well as enhancing its existing presentation capabilities.
Picture: Best Mind Mapping Program for Making Presentations
Related Solution:
Bureaucratic companies usually are characterized by a strict hierarchy and clearly defined responsibilities. However, sometimes organizational structure of a company reminds of somewhat tangled. To clarify it, you can create an orgchart that will represent the company as a tree with its' departments as branches.
This organization diagram represents a tree-like organizational structure. This is a typical example of a top-level branches of the hierarchical organizational structure. This part of the tree shows heads of branches who are subordinated completely to the president. The information and solutions are distributed though a tree structure down to the company's departments. Each of the sub-division has its own structure that is reflected in the corresponding organizational chart. This orgchart diagram was created using the vector graphic library supplied with ConceptDraw Organizational Charts solution.
Picture: Organizational Structure
Related Solution:
To support you in your tasks you can use the power of ConceptDraw DIAGRAM providing
intelligent vector graphics that are useful for management diagramming and
ConceptDraw MINDMAP for key management mind maps.
Picture: Business Productivity - Management
Related Solution:
ConceptDraw Solution Park creates a single information space for messaging to teams. PM Teams provides project participants and organizations with better tools that assist in task understanding, timeframe understanding, and project events in the entire organization. Improved communication fosters positive team spirit throughout.
Picture: Org Chart Diagram
Related Solution:
ConceptDraw
MINDMAP 16