How To Create a Value Stream Map
Value stream mapping has a wide application in lean manufacturing processes, sales, healthcare, knowledge work, software development, logistics, and other fields. It visualizes information and sequence of activities required to design and produce goods and services, helps to improve and streamline the production processes, identify wastes, error rates, and labor needs at individual work steps, track work, wait and down times and delays along each step in a process, inventory abundance or deficiency, improve team communication and collaboration. All these activities are beneficial for any industry and any company.
What is a Value Stream Map?
Value stream mapping is an essential lean tool used to visualize a production process of any level and complexity and a sales process. It helps to document all steps of a specific product or service on the way from the supplier to the customer, including design, development, order processing, production, transportation, and delivery steps. VSM tool is efficient in planning, implementing, and improving organization activities and processes, and identifying waste. It helps to reduce cycle times and maximize using of resources and materials.
VSM approach allows analyzing, managing, and optimizing the activities, flow of material, information required to produce and deliver a product or a service. It helps to identify bottlenecks in order to reduce them, as well as non-value-adding steps and areas to identify and eliminate waste, streamline the production process, and increase the value of product or service, combine material processing steps with information flow to achieve outcomes better and faster.
A Value stream mapping diagram is applied to improve any process, also including repeatable steps or multiple handoffs. It helps to optimize product delivery and completion, satisfy end-user requests and expectations efficiently.
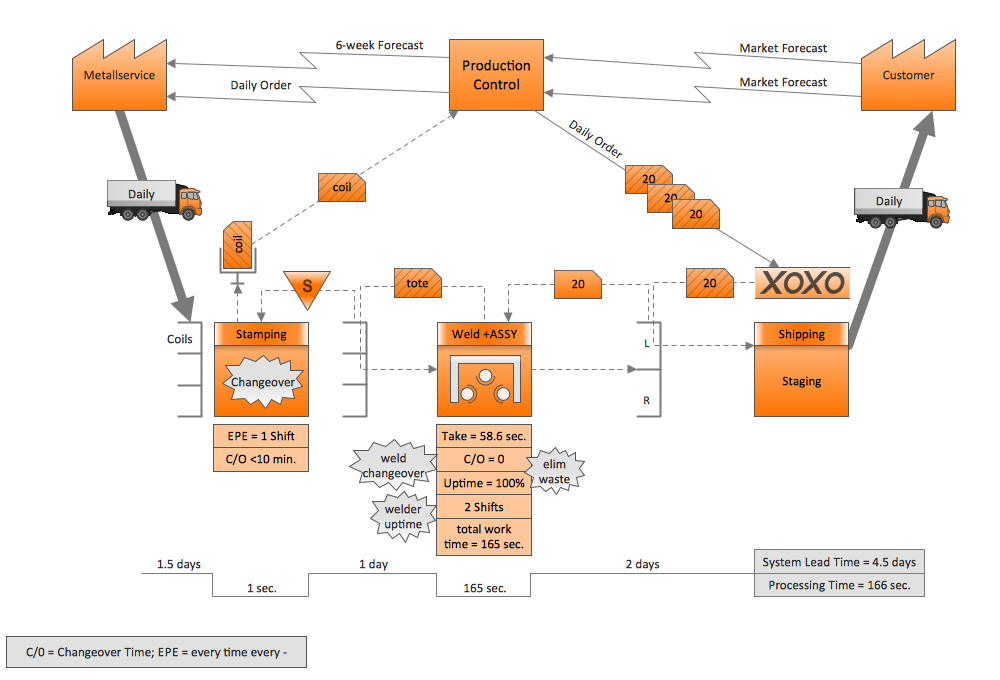
Example 1. VSM Diagram — Business Productivity
Value Stream Mapping Symbols and Components
The unique standard symbols and components are used to create a Value stream map, describe the lean manufacturing process from idea to production, map manufacturing processes, depict work streams and information flows, adding-value and non-adding-value components to eliminate the last ones and simplify the identification of business process improvement ways.
The process is usually represented by a rectangle with a name and can comprise the set of processes of an entire department to simplify a diagram. The modifications of a symbol are used for processes with data and shared processes. The abstract geometric symbol with peaks is used for customers and suppliers and typically indicates the starting and ending points of the flow. The symbols with an "I" inside show the exchange of inventory during the process. Different types of arrows are used to show the shipment of raw materials, information flow, electronic information flow, manual info, etc. A pushing of materials from one step to another is marked with an arrow with three white squares inside. The symbols of transport are used to depict shipment by the corresponding transport types.
Types of Value Stream Maps
There are three main types of VSMs:
- Current state map — depicts the current or the ‘as-is’ state of the value stream process, describes the steps of the existing processes, activities and information flow, inventory levels, lead times, and other data. This helps to identify waste, bottlenecks, and areas for improvement.
- Ideal state map — describes the perfect conditions, the vision of the target or ‘to-be’ state that is a goal of the improvement process to work towards, and where no constraints or bottlenecks occur.
- Future state map — shows the plan for the close period to implement improvements, optimize process flow, reduce waste, improve cycle times and flow efficiency, increase customer value and product quality, and achieve a desired state of the process.
The continuous improvement approach uses these types of maps to provide an understanding of the existing process, which improvements should be implemented, how to align, coordinate, optimize the efforts of value streams, and implement improvements to achieve the desired state.
One differs also:
- Operational value streams that represent the flow and nature of business, are supported by the development value stream and provide value for the end consumer during a certain product or service is available.
- Development value streams that are customer-facing or internally facing systems, building, improving, and operating the systems and capabilities that enable operational value.
Both of these value stream types create a value (products, services, or their combination) accounting interests of both internal stakeholder and external customers.
How to Create a Value Stream Map?
A Value Stream Map is constructed of three parts: a process map including all steps of the process, a timeline that shows cycle times, differentiates between value-added and non-value-added cycles, and helps to identify waste, and information flow that depicts the interactions and activities between the stations of a value chain.
When you think about how to create VSM diagram, follow the simple steps:
| # | Steps |
|---|---|
| 1. | Identify a product or process you want to map |
| 2. | Define the scope of the mapping project and articulate the goals and objectives for mapping the value stream |
| 3. | Collect process data and document the entire process from the supplier to customer |
| 4. | Create start and end points (supplier/raw materials and end customer) using the special VSM symbols and place them in the top left and right corners of the document |
| 5. | Map the steps of your process |
| 6. | To show the entire process flow, connect the start and end points and process boxes with arrows, indicate shipments using the symbols of transport, add inventory, and wait times |
| 7. | Include information flows and designate their direction and lines of communication (phone, email, fax) |
| 8. | Identify value-adding activities within a value stream, which meet customer needs and requirements |
| 9. | Create a timeline for value-added and non-value-added processes, typically at the bottom and top of a Value Stream Map correspondingly |
| 10. | Analyze the current state of the value stream using time-motion studies, value analysis, or process flow analysis. Identify waste, bottlenecks, inefficiencies (delays, restrictions, excess inventories, etc), and areas for improvement, and quantify key metrics |
| 11. | Design the optimized and efficient future state of the value stream using the optimization of resource allocation, elimination of non-value-adding activities, reduction of cycle times, and other lean principles |
| 12. | Implement and monitor the future state, eliminate inefficiencies identified in previous steps, evaluate key performance indicators, monitor, optimize, and improve the process to achieve the ideal state |

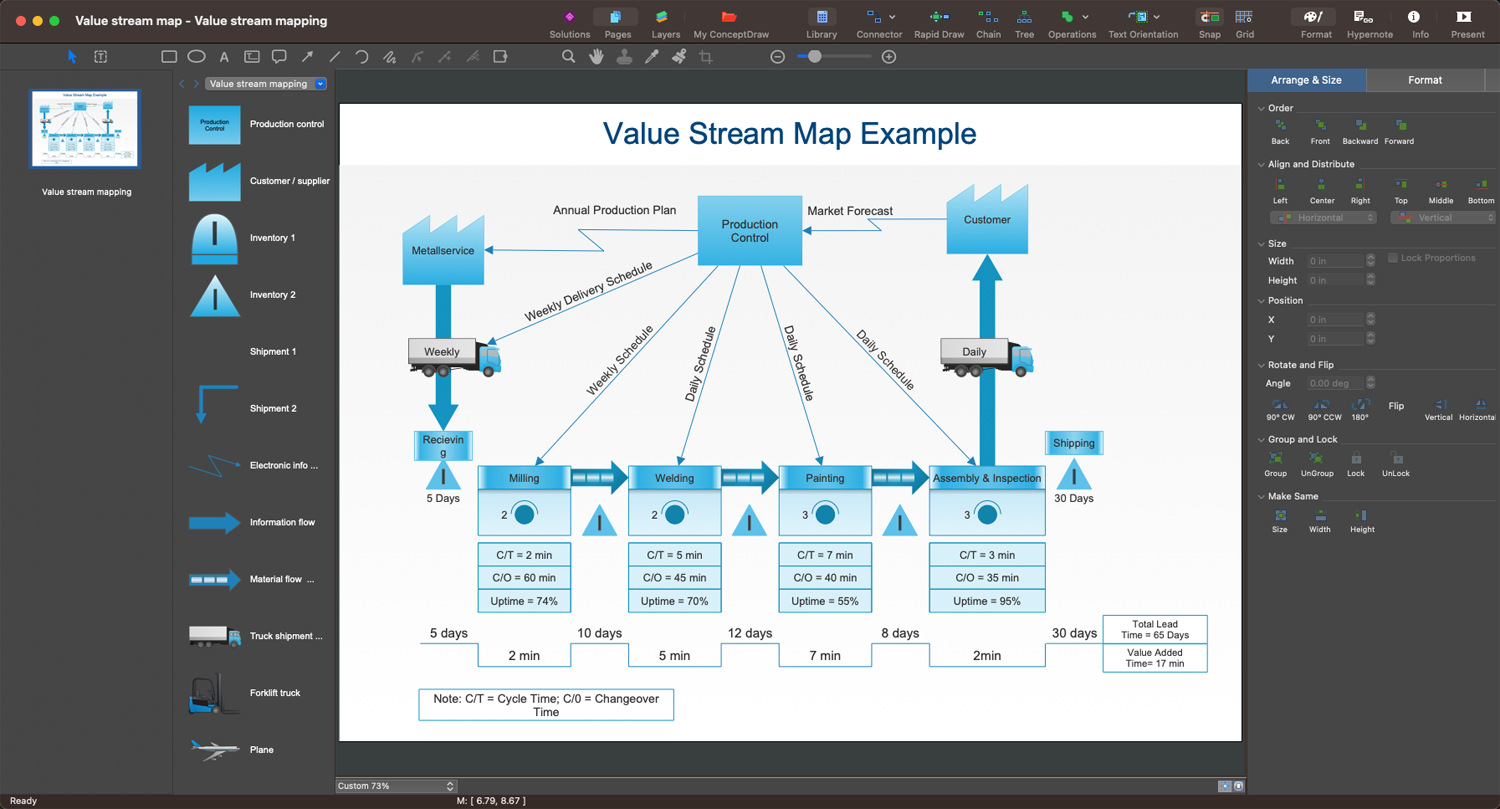
Example 2. How to Create VSM in ConceptDraw DIAGRAM Software
ConceptDraw Value Stream Map Software Overview
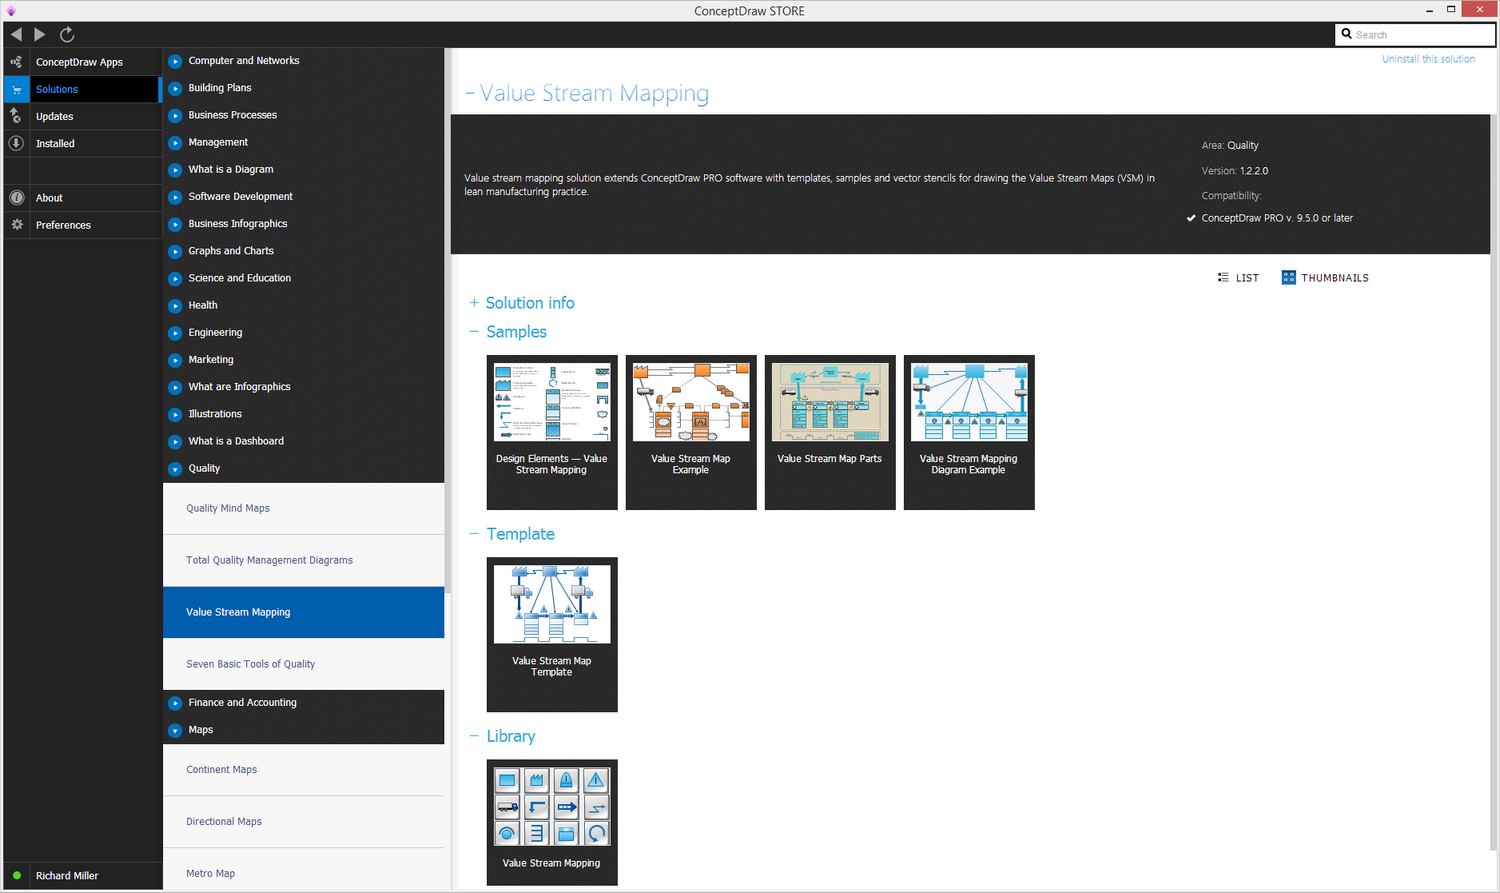
Value Stream Mapping solution for ConceptDraw DIAGRAM diagramming software provides powerful drawing tools for VSM diagrams. The collection of vector stencils offered in the solution library simplifies the creation of professional-looking Value Stream Maps (VSM), analysis, identification steps adding value and non-adding value to the product, improvement of processes, increasing cost and relevance of the product. The included samples and templates provide a quick start to value stream mapping.
Tips and Best Practices for Value Stream Mapping
To create an effective Value Stream Map and perform a careful analysis and planning, follow simple tips and best practices.
Observe the process and collect data, accurately fix all steps, lead times, inventory levels, spots of inefficiency, and other metrics to provide a realistic representation.
Collaborate with all relevant stakeholders: leadership, team members, process owners, operators, and other colleagues; involve cross-functional teams to account different perspectives and expertise.
Make sure you understand correctly the goals of key stakeholders.
Define the boundaries and the scope, identify the starting and ending points, key processes, activities, and information flows.
Value stream mapping begins with the current state value stream map. Record the current state and then move to ideal and future states.
Document your process using standardized VSM symbols to ensure correct understanding and interpretation of the VSM.
Keep the focus on the value, map the value-added activities, and identify the non-value-added activities, costly delays, waste, and other inefficiencies to reduce them and improve the process.
Approve the VSM with the actual process and data and update it as process changes and improvements are implemented to reflect the current state and show the progress.
Example 3. Value Stream Mapping Solution
Benefits of Value Stream Maps
Value stream mapping provides a lot of benefits for companies of all scope to evaluate and improve existing work and business process, and provide business sustainability. Value stream mapping:
visualizes the entire value stream from a stakeholder to customers;
provides a holistic view and understanding of the whole process;
simplifies the analysis of the value stream, business impact analysis, and identification issues in the process flow;
helps to identify, reduce, and eliminate waste and inefficiencies of different kinds including defects, delays, downtimes, over-processing, waste, excess inventory, wasteful handoffs;
sets targets and prioritizes improvement and sustainability initiatives;
simplifies optimization of processes, the flow of materials, information, and activities;
improves the process flow and manufacturing production workflow;
streamlines activities and reduces cycle times;
helps to enhance quality and productivity;
improves the efficiency of meetings, team culture, communication, and cross-functional collaboration;
provides prioritization based on the customer’s perspective and continuous delivery to customers;
reduces costs and generates savings;
helps to track progress over time.
Value Stream Map Diagram Examples
Value Stream Mapping solution for ConceptDraw DIAGRAM software provides a set of illustrative Value Stream Mapping examples and samples. They help to observe solution capabilities and power, and how to create a Value Stream Map easily. The included examples can be customized similarly to the pre-made templates, also included in the solution. The ready sample or template is a good starting point for drawing your own VSM.
Conclusion
Design your Value Stream Maps fast and easily in ConceptDraw DIAGRAM charting and flowchart software using the pre-made design symbols and components from the Value Stream Mapping solution, and realize business process modeling and business process management efficiently. Remember to continuously monitor and update your VSM diagram as processes change and improve. Continuous monitoring of performance metrics and improvements boosts your sustained success.

