Made with
ConceptDraw
MINDMAP 16

Conference Planning

ConceptDraw Office

ConceptDraw Office is an integrated set of visualization products and document exchange technologies. ConceptDraw OFFICE consists of a diagramming platform, a mind mapping, and a project management tool. These tools are essential to generate business diagrams, mind maps, project plans, dashboards, presentations, schematics, and any other business visualizations. These tools have access to an online service, ConceptDraw Solution Park that will deliver additional product extensions in the future. This is a time saving assistant for generating your business documents and presentations.

ConceptDraw Office consists of a diagramming platform, a mind mapping, and a project management tool. These tools are essential to generate business diagrams, mind maps, project plans, dashboards, presentations, schematics, and any other business visualizations.

ConceptDraw MINDMAP Samples

Sample mind maps created in ConceptDraw MINDMAP that demonstrate the different capabilities and applications of the program for business, personal, or education use.

Mind map that can be useful when planning the logistics of a conference.

Conference Planning *

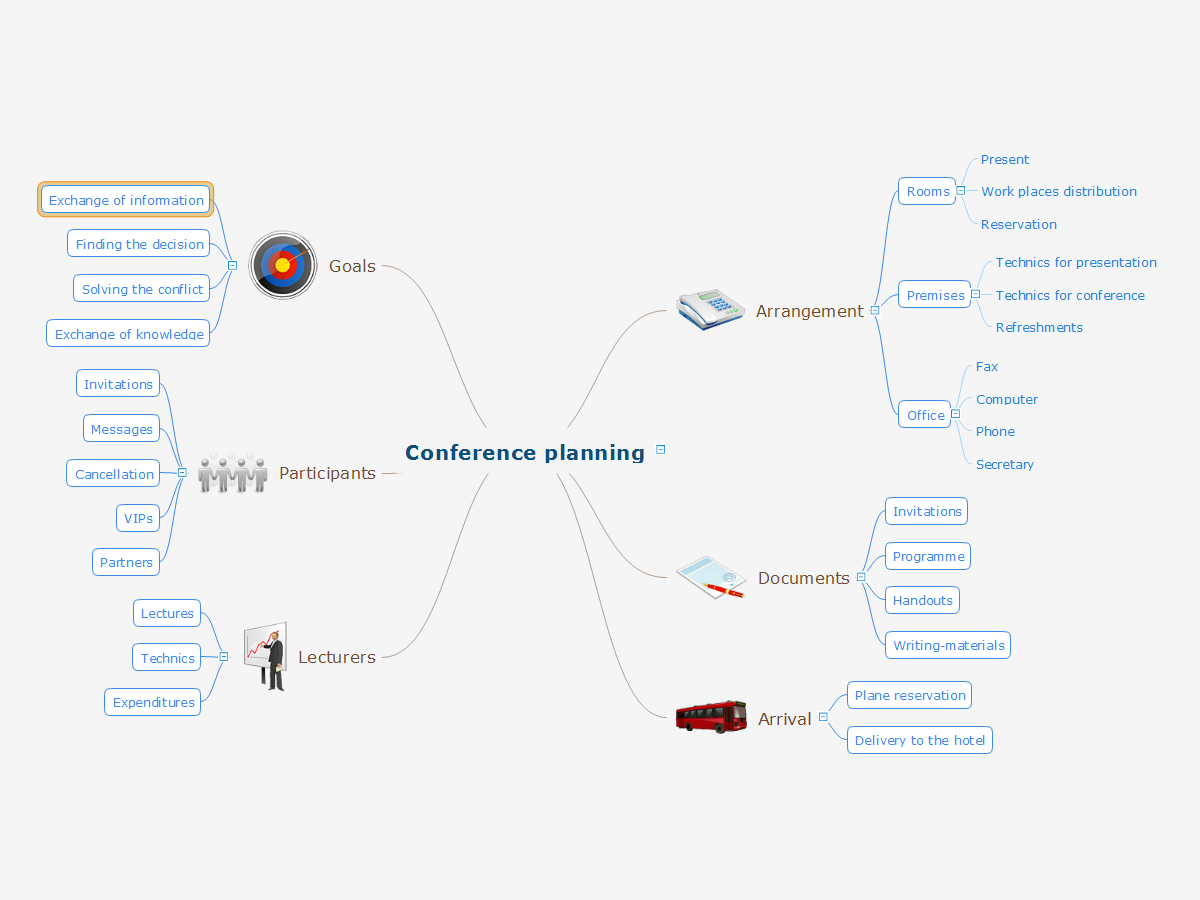
Example 1. Conference Planning


Export to Outline


    Conference planning
    • Arrangement
      • Rooms
        • Present
        • Work places distribution
        • Reservation
      • Premises
        • Technics for presentation
        • Technics for conference
        • Refreshments
      • Office
        • Fax
        • Computer
        • Phone
        • Secretary
    • Documents
      • Invitations
      • Programme
      • Handouts
      • Writing-materials
    • Arrival
      • Plane reservation
      • Delivery to the hotel
    • Lecturers
      • Lectures
      • Technics
      • Expenditures
    • Participants
      • Invitations
      • Messages
      • Cancellation
      • VIPs
      • Partners
    • Goals
      • Exchange of information
      • Finding the decision
      • Solving the conflict
      • Exchange of knowledge

The Benefits for ConceptDraw MINDMAP Brainstorming Software

  • ConceptDraw MINDMAP is effective for brainstorming, designing mind maps, idea generating, creative and lateral thinking, creativity and problem solving.
  • ConceptDraw MINDMAP is ideal for team and personal work in Business, Marketing and Project Management.
  • The libraries with large quantity of vector objects help to illustrate your mind maps and to make them bright, visual and comprehensible.
  • Use of View Navigator tool lets create presentations from a mind map: you can simply select the map parts you want to present, sequence your slides, and preview the presentation.
  • ConceptDraw MINDMAP provides wide capabilities of importing and exporting in various formats: Microsoft PowerPoint, Microsoft Word, MS Excel, Mindjet MindManager, image, HTML, PDF file.


EIGHT RELATED HOW TO's:
There are many tools to manage a process or to illustrate an algorithm or a workflow. Flowcharting is one of those tools. However, it may be difficult to show complex processes that require multiple attributes or several people in a simple flowchart, so a cross-functional flowchart would be a solution for that situation. To create such flowchart, group processes and steps to labeled rows or columns, and divide those groups with horizontal or vertical parallel lines. It is worth mentioning that there are different types of cross-functional flowcharts, like opportunity or deployment flowchart. This diagram shows a cross-functional flowchart that was made for a trading process. It contains 14 processes, distributed through 5 lines depicting the participants who interact with the process. Also there are connectors that show the data flow of information between processes. The cross-functional flowchart displays a detailed model of the trading process, as well as all participants in the process and how they interact with each other. The lines in the flowchart indicates the position, department and role of the trading process participants.Cross-Functional Flowchart
Picture: Cross-Functional Flowchart
Related Solution:
Flowcharts are used to represent accounting information in a system. In ConceptDraw software there are special symbols that are used to create accounting flowcharts.Why flowchart is important to accounting information system
Picture: Why Flowchart is Important to Accounting Information System?
Related Solution:
When you are connecting existing objects you can control the diagram structure by changing selection order. This is how diagramming software should work. You are able to draw a diagram as quickly as the ideas come to you.ConceptDraw Arrows10 Technology *
Picture: ConceptDraw Arrows10 Technology
Sales process management is a business discipline which focuses on the development and practical application of various sales techniques, and on the management of sales operations of the company.

It is effective to use professional software for the sales process management. ConceptDraw DIAGRAM diagramming and vector drawing software extended with Sales Flowcharts solution from the Marketing area of ConceptDraw Solution Park is the best choice.Sales Process Management *

Picture: Sales Process Management
Related Solution:
While creating flowcharts and process flow diagrams, you should use special objects to define different statements, so anyone aware of flowcharts can get your scheme right. There is a short and an extended list of basic flowchart symbols and their meaning. Basic flowchart symbols include terminator objects, rectangles for describing steps of a process, diamonds representing appearing conditions and questions and parallelograms to show incoming data. This diagram gives a general review of the standard symbols that are used when creating flowcharts and process flow diagrams. The practice of using a set of standard flowchart symbols was admitted in order to make flowcharts and other process flow diagrams created by any person properly understandable by other people. The flowchart symbols depict different kinds of actions and phases in a process. The sequence of the actions, and the relationships between them are shown by special lines and arrows. There are a large number of flowchart symbols. Which of them can be used in the particular diagram depends on its type. For instance, some symbols used in data flow diagrams usually are not used in the process flowcharts. Business process system use exactly these flowchart symbols.Flowchart example showing a customer request approval process with start, input output, process steps, decision branches, and end
Picture: Flowchart Symbols: Meaning and Examples
Related Solution:
Mind map specifying various online marketing objectives for a company with specific targets outlined for each objective.Online Marketing Objectives *
Picture: Online Marketing Objectives
Related Solution:
The power, economy, and versatility of ConceptDraw MINDMAP takes personnel and team productivity to another level. Discover today what this means to you.Mind Map Making Software *
Picture: Mind Map Making Software
Related Solution:
Mind map that organizes tasks, resources, outcomes and people for a marketing research project.Marketing Research Project *
Picture: Marketing Research Project
Related Solution:
ConceptDraw
MINDMAP 16