How should diagramming software work? Is it possible to develop a diagram as quickly as the ideas come to you?
The innovative ConceptDraw Arrows10 Technology included in ConceptDraw DIAGRAM is a powerful drawing tool that changes the way diagrams are produced.
While making the drawing process easier and faster.
ConceptDraw DIAGRAM is a powerful tool that helps you create a process map diagram quickly and easily. Fine-tuning the objects in ConceptDraw DIAGRAM allows you to create a really professional finished article. ConceptDraw Arrows10 Technology gives drawing connectors a smart behavior that provides quick and precise placement, allows for easy changes and automatic rearrangement.
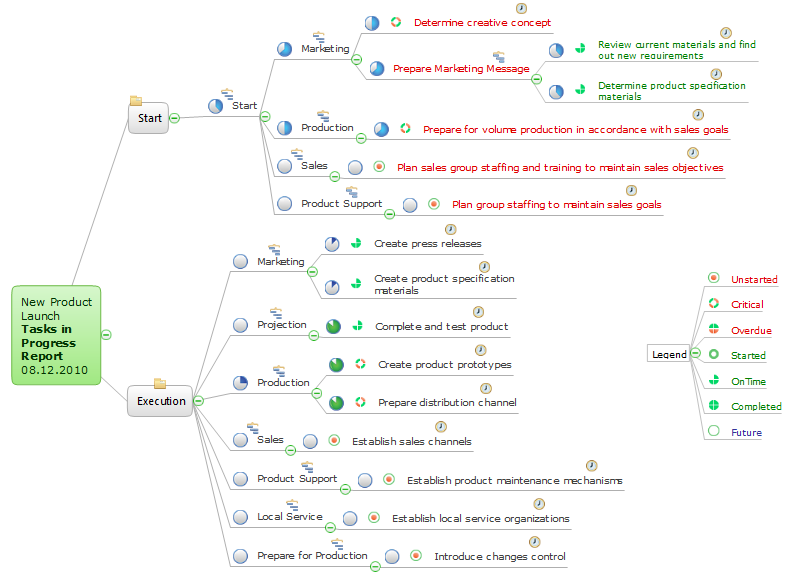
When the "tree" mode is switched on the next shape you add to your diagram is automatically connected to the initial shape. You can rapidly add shapes to your tree diagram by copying-and-pasting or using Ctrl+"drag-and-drop" combination.
Want to add the next level of shapes to your tree diagram. This easy to do by selecting a shape to make it the new initial shape for this level and continue adding shapes. The "tree" auto connection mode can help you easily create different types of structured diagrams; examples of these types of diagrams could be mind maps, organization charts, root cause diagrams, and more.
Video 1. ConceptDraw Technology
ConceptDraw DIAGRAM software provides vector shapes and connector tools for quick and easy drawing diagrams for business, technology, science and education.
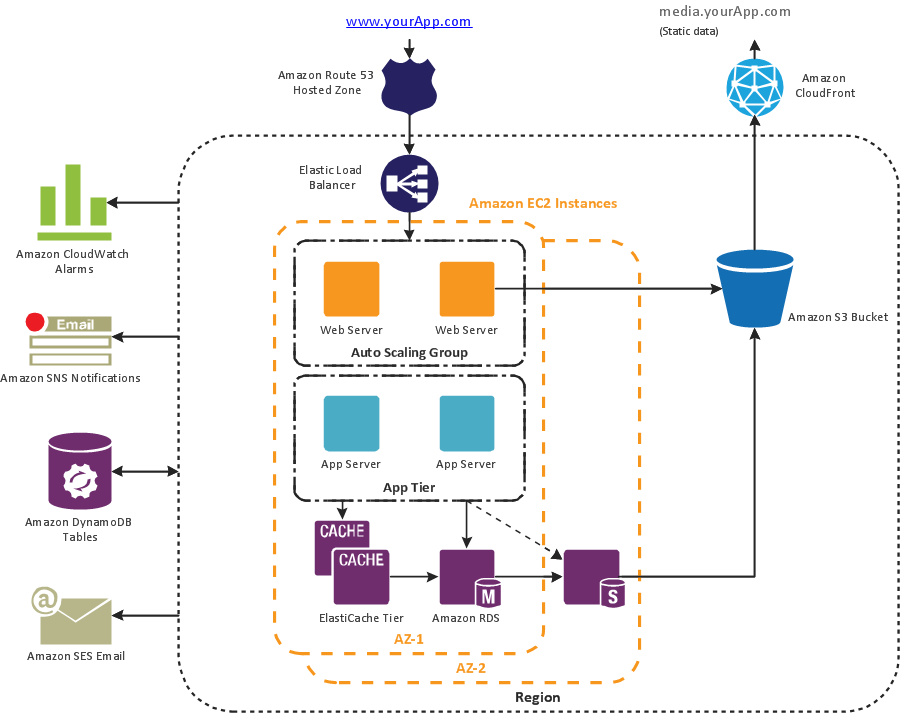
Sample 1. Amazon Web Services (AWS) diagram — 3 Tier auto scalable Web application architecture
Use ConceptDraw DIAGRAM software enhanced with solutions from ConceptDraw Solution Park to create diagrams to present and explain structures, process flows, logical relationships, networks, design schemes and other visually organized information and knowledge.
When talking about engineering, one should define all the terms used, so anybody could understand the topic. Typical network glossary contains definitions of numerous network appliances, types of networks and cable systems. The understanding of basic is crucial for server management, network administration and investigating problems.
The network glossary defines terms related to networking and communications. The most of glossary items has their visual representation in ConceptDraw DIAGRAM libraries of the Computer Network Diagrams solution. This illustration presents a local area network (LAN) diagram. It designed to show the way the interaction of network devices in a local network. The diagram uses a library containing symbols of network equipment, connections and the end-point devices such as network printer, hubs, server, modem and finally computers (PC, mac, laptop). This diagram depicts a physical LAN topology.
Designing a floor plan or a home plan using special software may sound quite complicated. There are many tools to create such plan, but it would be useful for a beginner to watch some tips on how to create home plan with examples or even templates. ConceptDraw Solution Park provides dozens of floor plans examples, templates and libraries with vector stencils.
This small private apartment floor plan is created using ConceptDraw Building Plans solution. It provides the 15 object libraries that include more than 600 vector objects along with the set of templates for drawing different floor plans. The given sample represents the individual apartment's plan in details. It shows the layout of rooms, the furniture and sanitary engineering location and even possible location of houseplants. The legend on the right side of the drawing will guide people through the location of the apartment.
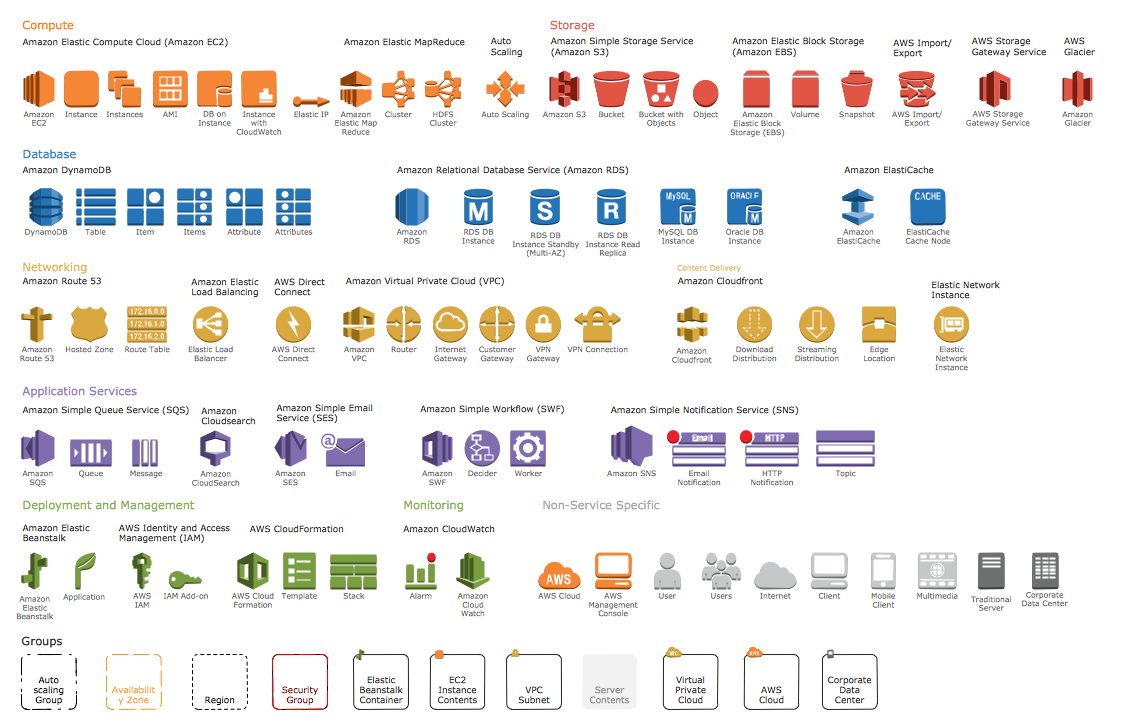
The AWS Architecture Diagrams solution includes icons, sample and templates for several Amazon Web Services products and resources, to be used when creating architecture diagrams. The icons are designed to be simple so that you can easily incorporate them in your diagrams and put them in your whitepapers, presentations, datasheets, posters or any technical material you like.
Picture: AWS Simple Icons for Architecture Diagrams
Networking and Content Delivery icons - Amazon AWS pro diagrams - AWS diagrams are part of architecturing tools provided with ConceptDraw Solution Park.
Picture: Diagramming software for Amazon Web Service icon set: Networking and Content Delivery
Why do you need a business process flow diagram? How to use business process diagram software? Explore ✔️ the significance, ✔️ creation process, and ✔️ discover cutting-edge software solutions designed to streamline and optimize your workflows
Picture: Business Process Workflow Diagrams & Software
Network Security Architecture Diagram visually reflects the network's structure and construction, and all actions undertaken for ensuring the network security which can be executed with help of software resources and hardware devices. You dream to find powerful software for easy designing Network Security Architecture Diagram? We recommend to use ConceptDraw DIAGRAM extended with Network Security Diagrams Solution from the Computer and Networks Area of ConceptDraw Solution Park.
The ConceptDraw Flowchart component includes a set of samples and templates. This geathered as flowchart maker toolbox which focused on drawing flowcharts of any industry standards.