UML Sequence Diagram. Design Elements
UML Sequence Diagram is a type of Interaction Diagrams that describes the interactions between objects and classes that are involved in the scenario and the sequence of messages exchanged between them.
UML Sequence Diagram represents the processes and objects that occur at the same time as lifelines (parallel vertical lines), and the messages exchanged between them as horizontal arrows.
Sequence Diagrams are very popular in dynamic modeling.
The Rapid UML Solution for ConceptDraw DIAGRAM contains 13 vector stencils libraries with 393 interactive shapes that you can use to design your UML diagrams.
To design a Sequence Diagram use the UML Sequence Diagram library.
UML Sequence Diagram library contains 51 shapes:
- Lifeline (entity)
- Lifeline (control)
- Lifeline (boundary)
- Lifeline
- Return message
- Asynchronous message
- Synchronous message
- Execution occurrence
- Destroy message
- Create message
- Symbol { }
- Self message
- Symbol << >>
- Port
- State divider
- Stop symbol
- Found message
- State invariant/continuations
- Lost message
- Gate Sequence
- Note
- Message default
- Interaction use
- Combined fragment
- Lifeline (actor)
- Self message
- Initiator
- Message
- Unknown/unspecified participant
- Message
- Message synchronous
- Creation message
- Message inverse
- Synchronous
- Creation
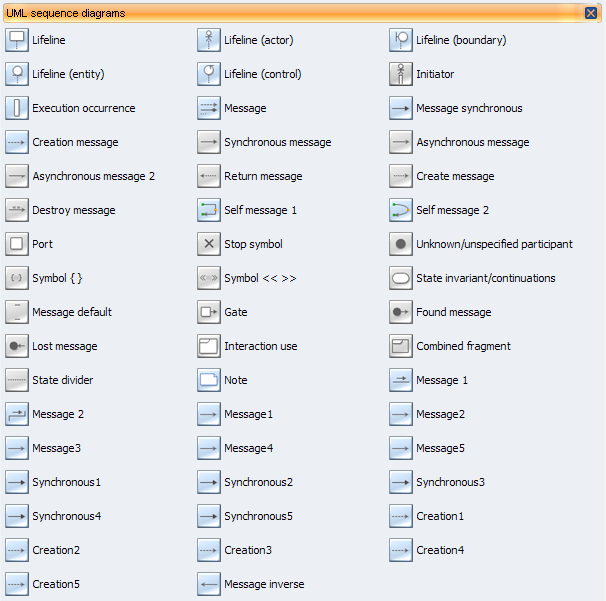
Pic.1. UML Sequence Diagram Library
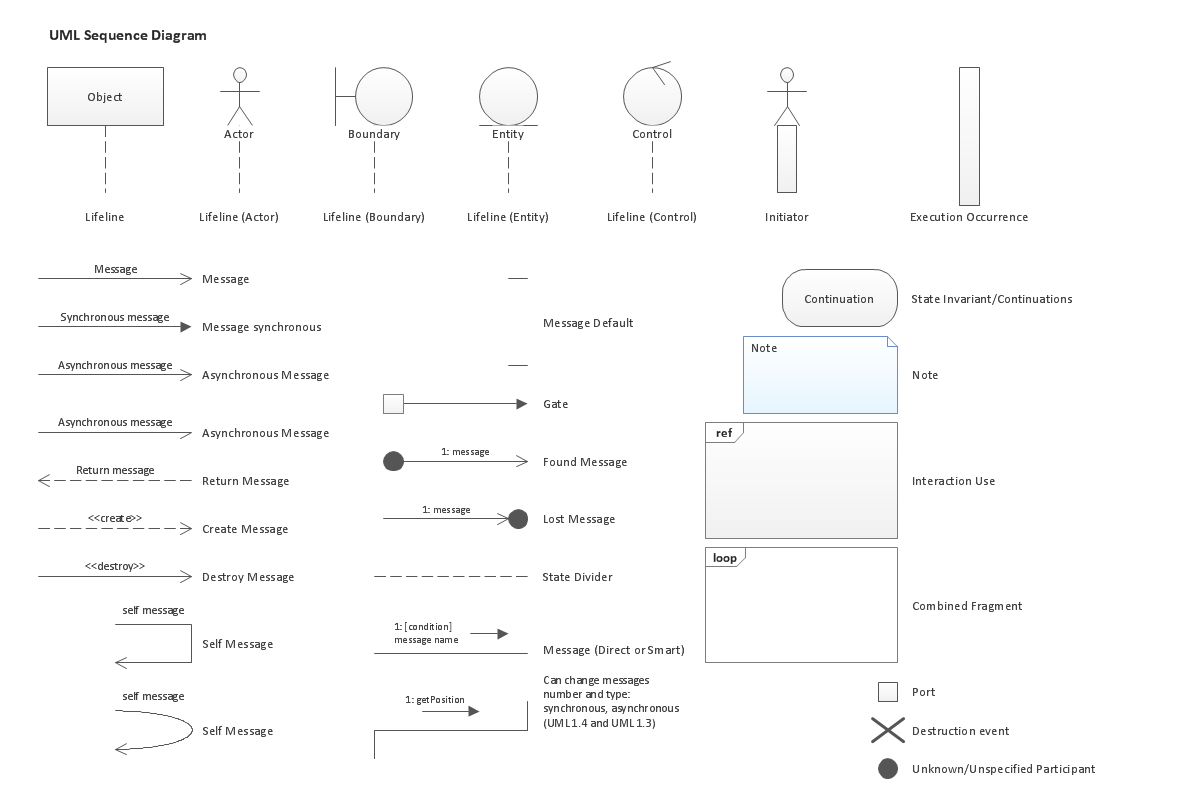
Pic.2. UML Sequence Diagram Library Elements
ConceptDraw Rapid UML solution provides UML Sequence Diagram library of vector stencils for UML sequence diagram elements like lifelines and message arrows.
Use the UML Sequence Diagram library to draw your own UML sequence diagrams that show process interactions as messages exchange arranged in time sequences during runtime scenarios.


All libraries for creating UML diagrams are available inside the ConceptDraw DIAGRAM Templates and samples are located in the Rapid UML section of ConceptDraw STORE.

TEN RELATED HOW TO's:
UML Communication diagramming software with rich examples and template. ConceptDraw is ideal for software designers and software developers who need to draw UML Communication Diagrams.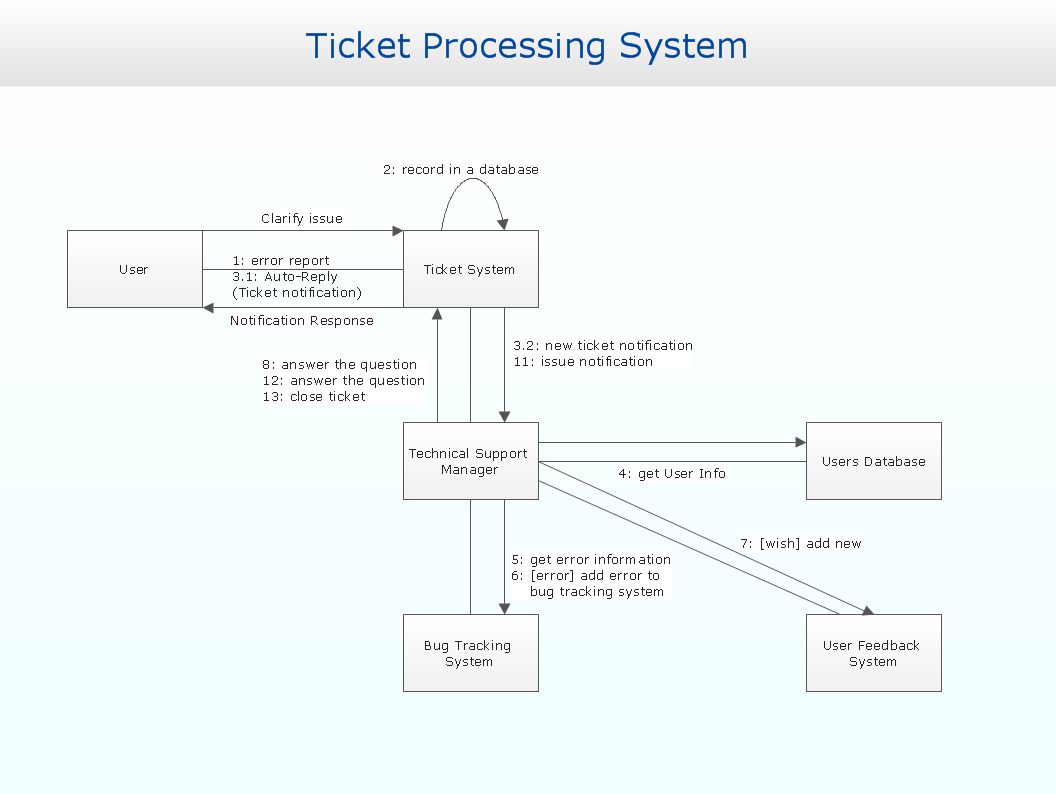
Picture: Communication Diagram UML2.0 / Collaboration UML1.x
China, officially the People's Republic of China, is a sovereign state located in East Asia.
The vector stencils library China contains contours for ConceptDraw DIAGRAM diagramming and vector drawing software. This library is contained in the Continent Maps solution from Maps area of ConceptDraw Solution Park.
Picture: Geo Map - Asia - China
Related Solution:
Use the set of special professionally developed swim lane flowchart symbols - single, multiple, vertical and horizontal lanes from the Swimlanes and Swimlanes BPMN 1.2 libraries from the Business Process Diagram solution, the Swim Lanes library from the Business Process Mapping solution as the perfect basis for your Swim Lane Flowcharts of processes, algorithms and procedures.
Picture: Swim Lane Flowchart Symbols
Related Solution:
The fundamental concepts of electrical engineering in our detailed guide. ✔️ Discover essential electrical engineering software tools. 🔸 The main types of electrical engineering you need to know in this article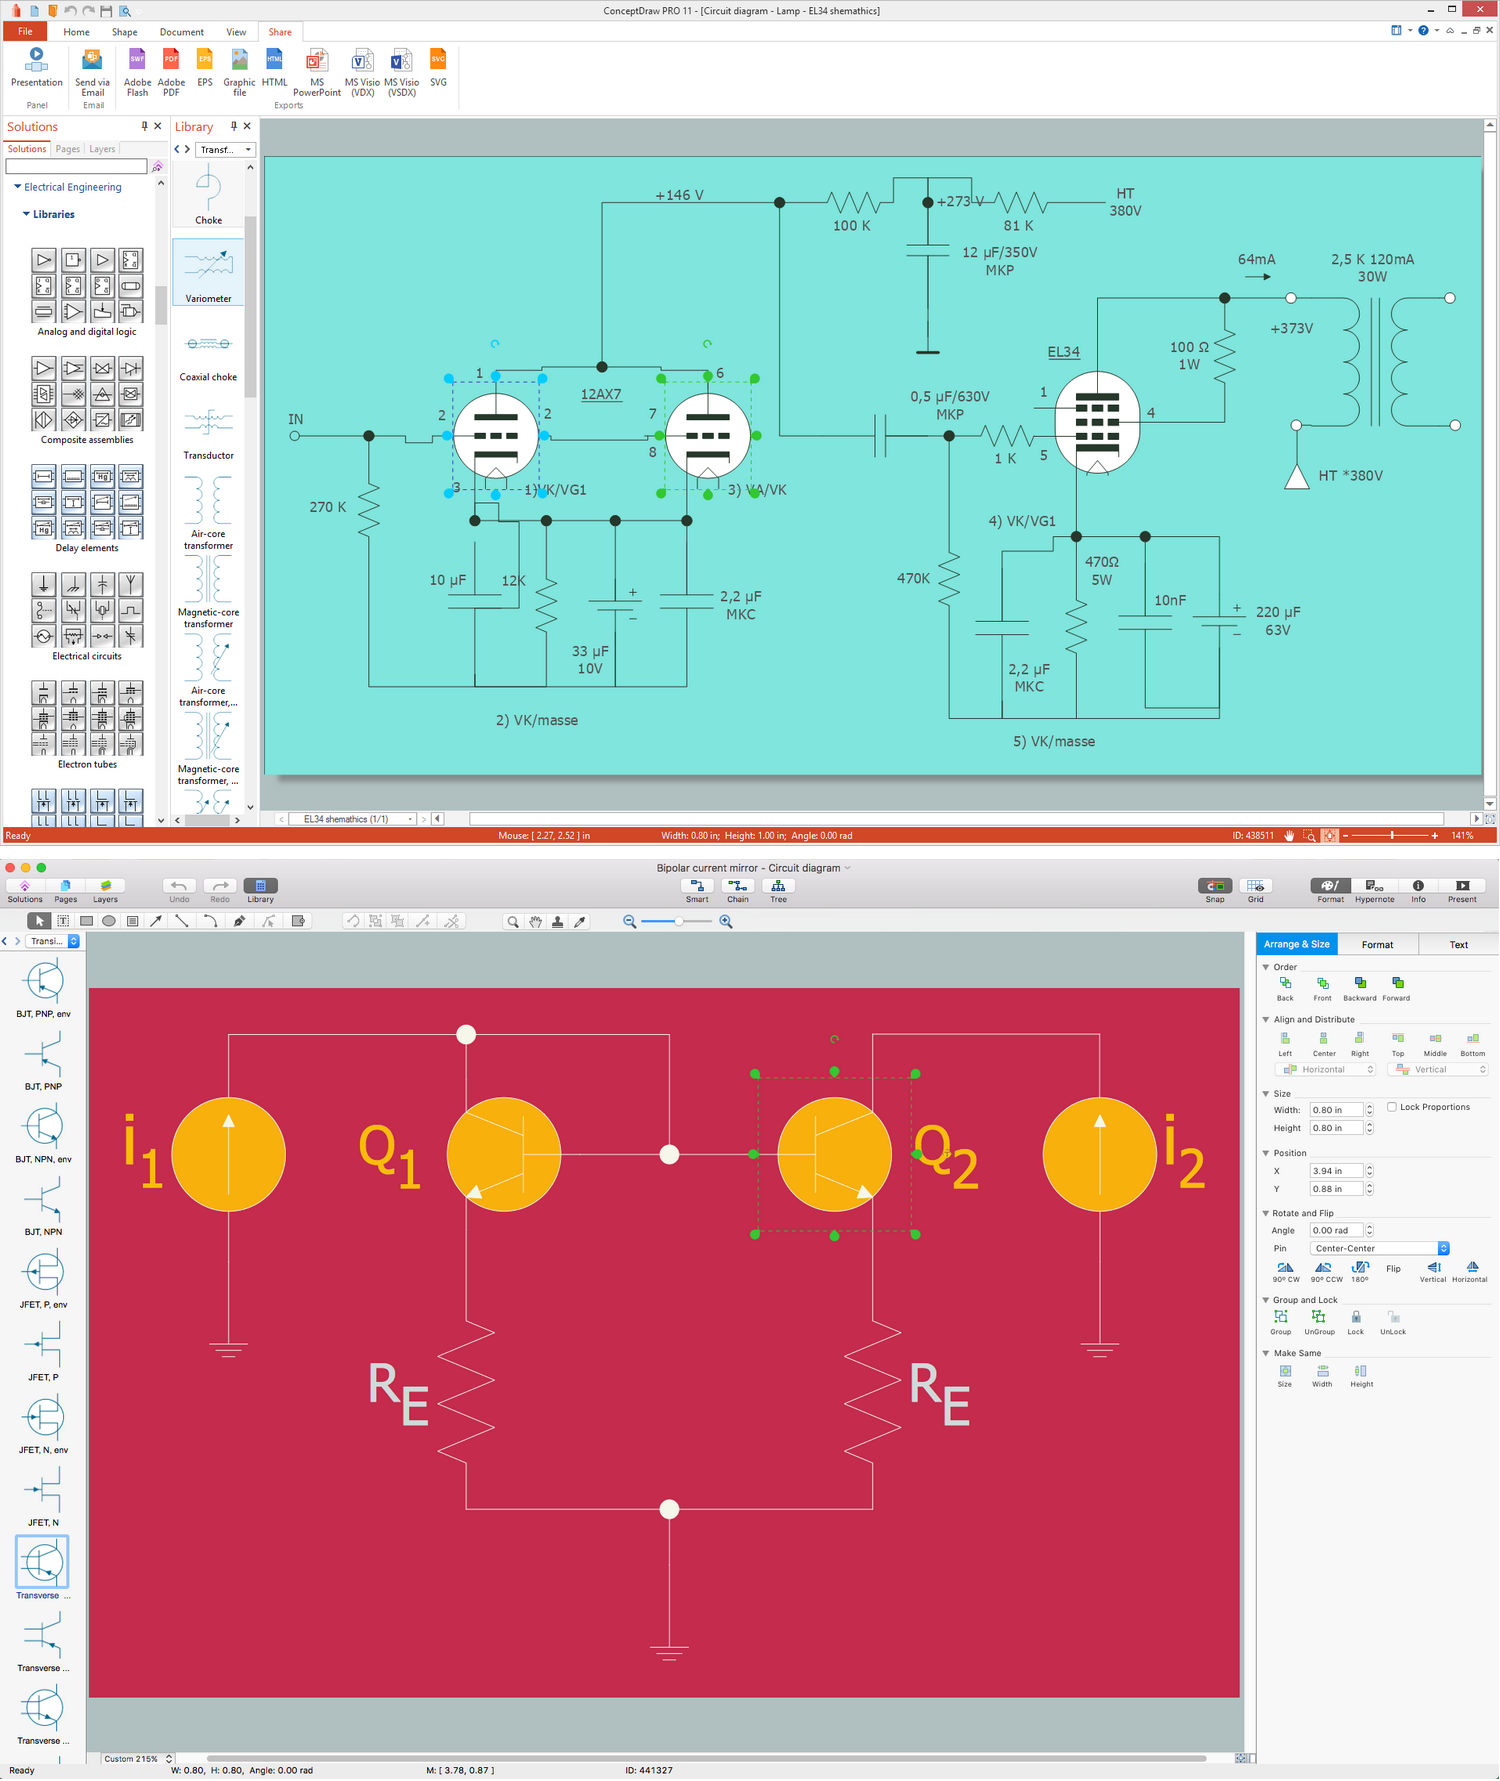
Picture:
What is Electrical Engineering?
Basic Electrical Engineering Software
Related Solution:
Using diagrams, you can visualize the flow of the information or build a detailed data structure. There's no need to have a degree in software and database design with ConceptDraw DIAGRAM , because this software has all the tools needed in developing models and diagrams. Project planning, designing and prototyping was never so easy.
This UML diagrams can be used to visualize a model of the data base development process. A UML diagram shows a graphical view of a structure of software system: components and relationships.
Using Unified Modeling Language helps to depict logical and physical elements of a data base, visually represent requirements and sub-systems. UML diagrams allows developers to organize and predict critical issues, as well as collaborate data base information.
Picture: Software and Database Design with ConceptDraw DIAGRAM
Related Solution:
UML Object Diagram shows the structure of a modeled system at a specific time.
ConceptDraw has 393 vector stencils in the 13 libraries that helps you to start using software for designing your own UML Diagrams. You can use the appropriate stencils of UML notation from UML Object library.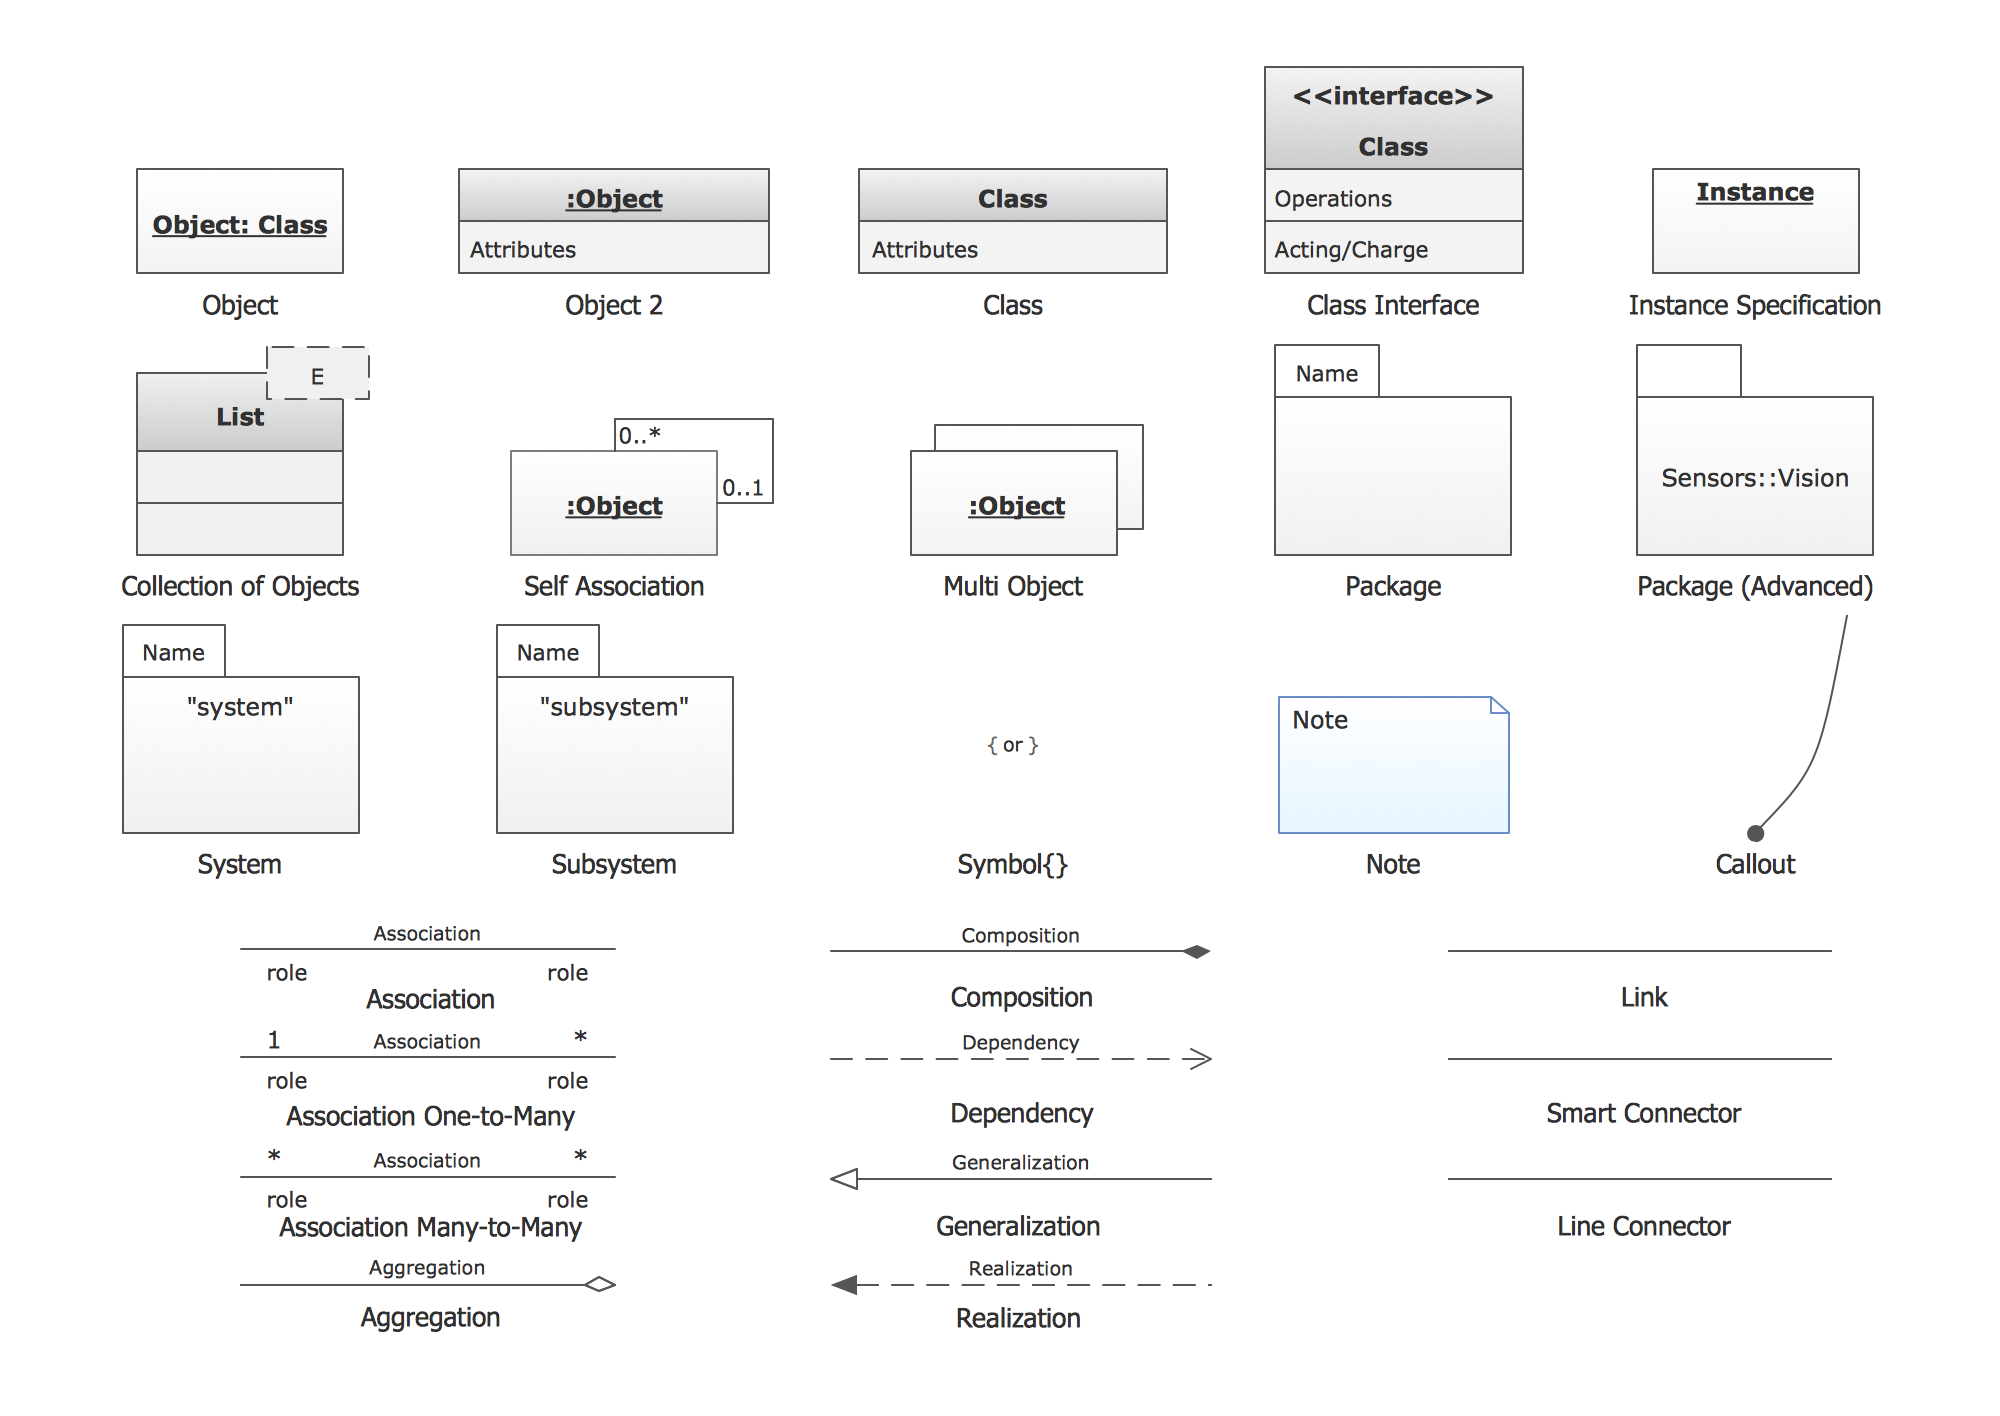
Picture: UML Object Diagram. Design Elements
Related Solution:
UML Activity Diagram illustrate the business and operational step-by-step workflow of components in a system and shows the overall flow of control.
Picture: UML Activity Diagram. Design Elements
ConceptDraw DIAGRAM is the best BPMN software for ✔️ modeling business processes, ✔️ graphical documenting processes, ✔️ analysis processes, ✔️ optimization business processes, ✔️ identifying inefficiencies, ✔️ efficient decision-making based on created Business Process Diagrams and Business Process Models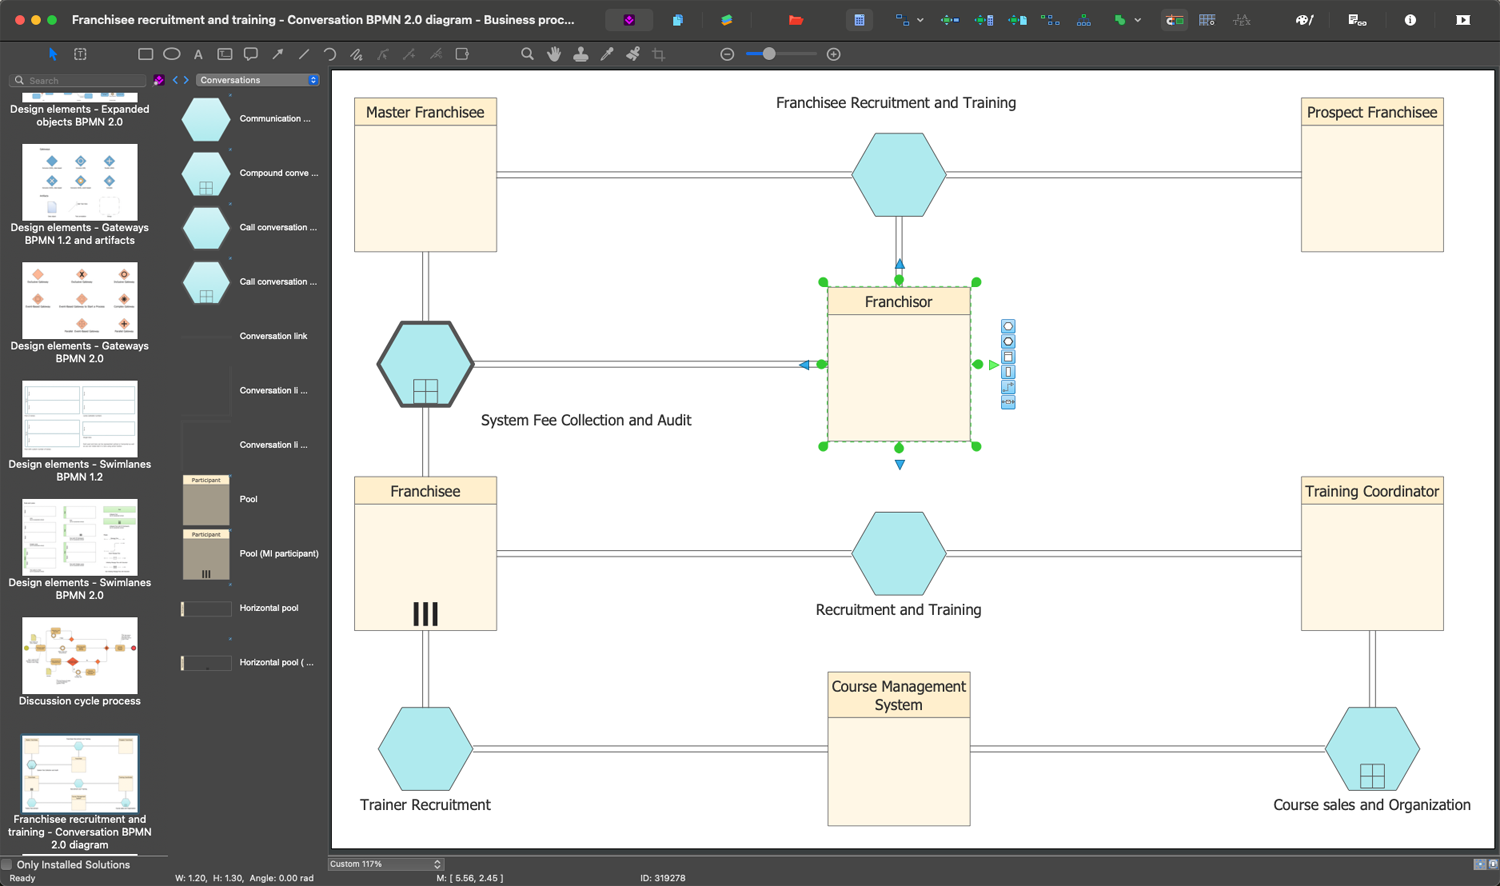
Picture: The Best Business Process Modeling Software: Comprehensive Guide
Related Solution:
UML Interaction Overview Diagram schematically shows a control flow with nodes and a sequence of activities that can contain interaction or sequence diagrams.
Picture: Interaction Overview Diagram
ConceptDraw DIAGRAM system design software is a product of CS Odessa that was developed especially for making it much simpler to create all the needed diagrams, charts, flowcharts, schemes and other drawings when there is such a need in it. Having the Specification and Description Language (SDL) solution installed from the ConceptDraw STORE application may be another bonus to any ConceptDraw DIAGRAM diagramming and drawing software’s user as it offers both stencil libraries with the design elements and the pre-made examples of the diagrams, such as the SDL ones.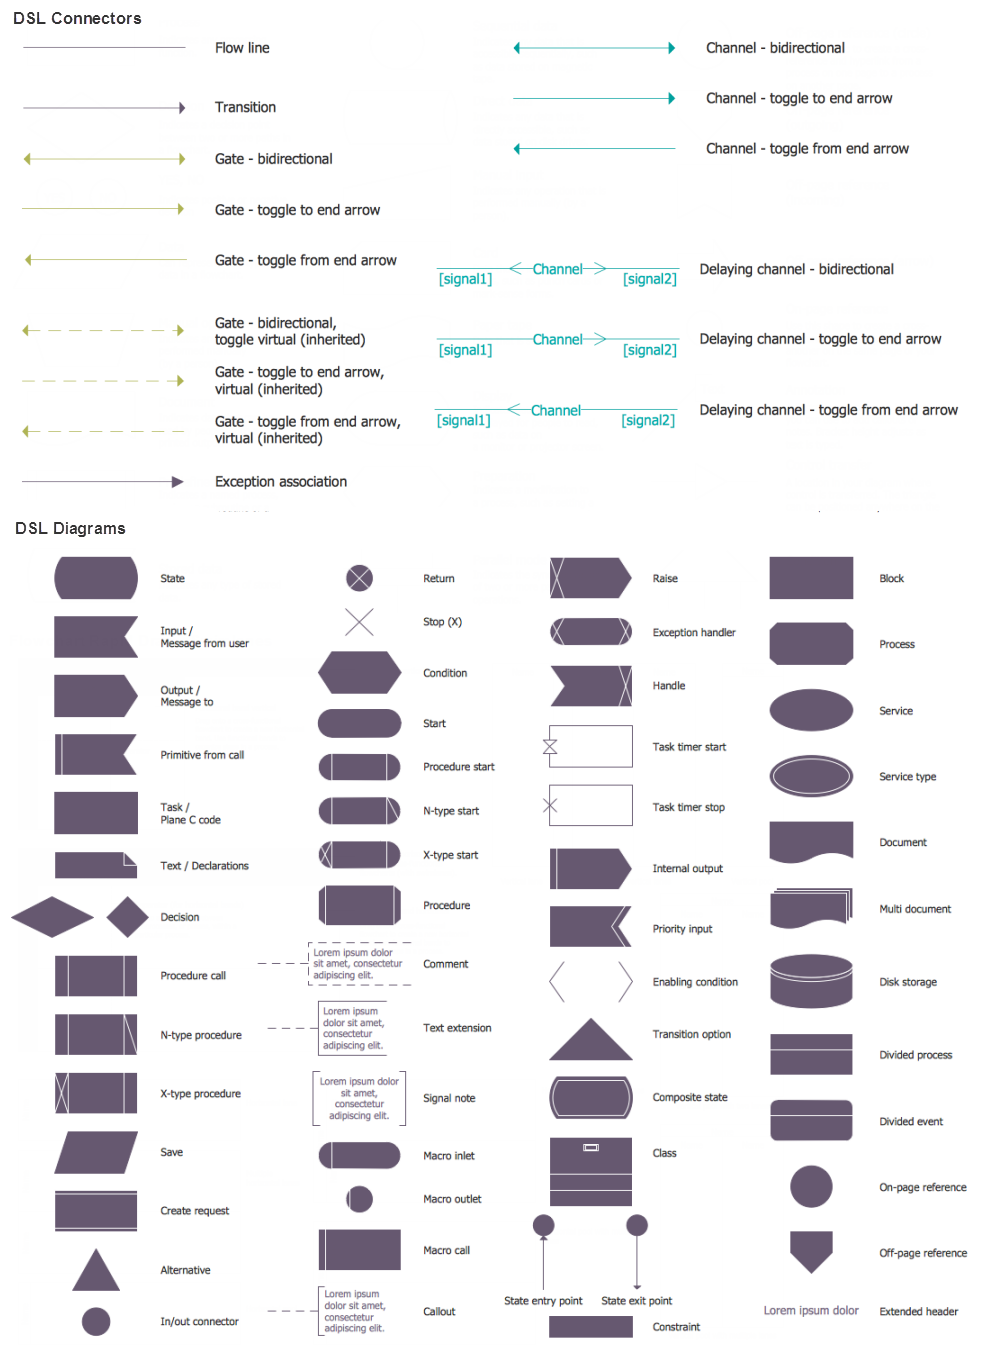
Picture: System Design
Related Solution:


