Sample 1. Anyone Have an ERD Symbols Quick Reference?
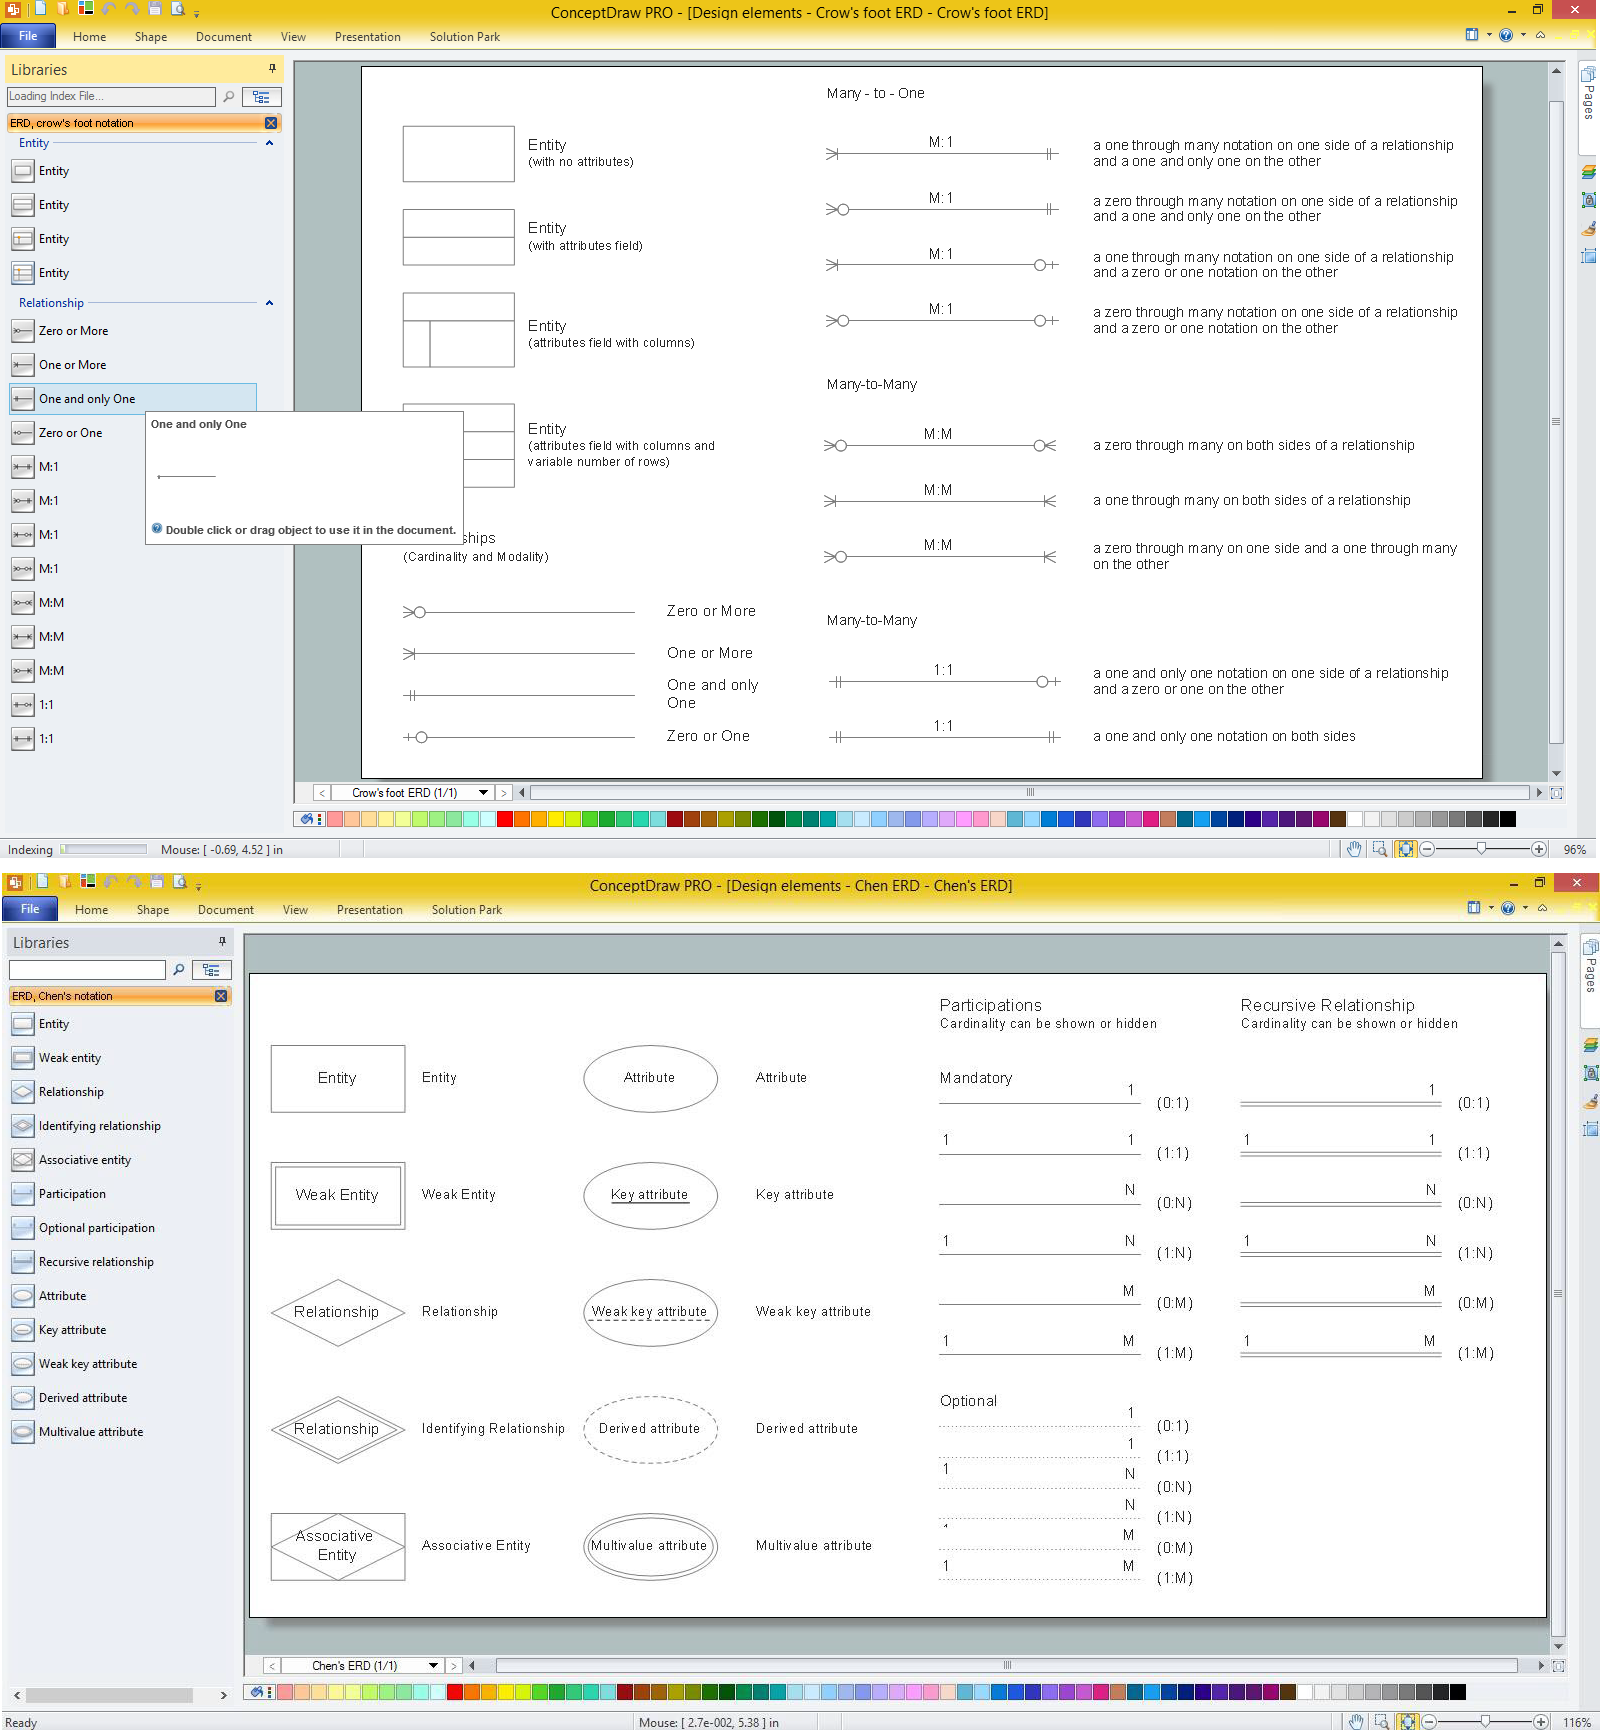
There are two notations used for ERDs: Chen and Crow's Foot. Variety of symbols offered by two libraries of Entity-Relationship Diagram (ERD) Solution covers both these notations.
Crow’s Foot notation ERD symbols
| Symbol |
Meaning |
| Relationships
(Cardinality and Modality) |
 |
Zero or More |
 |
One or More |
 |
One and only One |
 |
Zero or One |
| Many - to - One |
 |
a one through many notation on one side of a relationship and a one and only one on the other |
 |
a zero through many notation on one side of a relationship and a one and only one on the other |
 |
a one through many notation on one side of a relationship and a zero or one notation on the other |
 |
a zero through many notation on one side of a relationship and a zero or one notation on the other |
| Many - to - Many |
 |
a zero through many on both sides of a relationship |
 |
a one through many on both sides of a relationship |
 |
a zero through many on one side and a one through many on the other |
 |
a one and only one notation on one side of a relationship and a zero or one on the other |
 |
a one and only one notation on both sides |
Chen's notation ERD symbols
| Symbol |
Shape Name |
Symbol Description |
| Entities |
 |
Entity |
An entity is represented by a rectangle which contains the entity’s name. |
 |
Weak Entity |
An entity that cannot be uniquely identified by its attributes alone. The existence of a weak entity is dependent upon another entity called the owner entity. The weak entity’s identifier is a combination of the identifier of the owner entity and the partial key of the weak entity. |
 |
Associative Entity |
An entity used in a many-to-many relationship (represents an extra table). All relationships for the associative entity should be many |
| Attributes |
 |
Attribute |
In the Chen notation, each attribute is represented by an oval containing atributte’s name |
 |
Key attribute |
An attribute that uniquely identifies a particular entity. The name of a key attribute is underscored. |
 |
Multivalued attribute |
An attribute that can have many values (there are many distinct values entered for it in the same column of the table). Multivalued attribute is depicted by a dual oval. |
 |
Derived attribute |
An attribute whose value is calculated (derived) from other attributes. The derived attribute may or may not be physically stored in the database. In the Chen notation, this attribute is represented by dashed oval. |
| Relationships |
 |
Strong relationship |
A relationship where entity is existence-independent of other entities, and PK of Child doesn’t contain PK component of Parent Entity. A strong relationship is represented by a single rhombus |
 |
Weak (identifying) relationship |
A relationship where Child entity is existence-dependent on parent, and PK of Child Entity contains PK component of Parent Entity. This relationship is represented by a double rhombus. |
Collection of samples and examples included to Entity-Relationship Diagram (ERD) solution and represented at ConceptDraw STORE is an excellent illustration of the ease of application of ready-to-use objects for designing Entity-Relationship diagrams and models.

Example 2. ERD Example
This sample was created in ConceptDraw DIAGRAM using the vector objects from the ERD Chen's Notation library of Entity-Relationship Diagram (ERD) Solution and illustrates the Entity Relationship Diagram. An experienced user spent 15 minutes creating this sample.
Use the Entity-Relationship Diagram (ERD) Solution for ConceptDraw DIAGRAM software to create your own professional looking ER Diagrams quick, easy and effective.
All source documents are vector graphic documents. They are available for reviewing, modifying, or converting to a variety of formats (PDF file, MS PowerPoint, MS Visio, and many other graphic formats) from the ConceptDraw STORE. The Entity-Relationship Diagram (ERD) Solution is available for all ConceptDraw DIAGRAM or later users.
TEN RELATED HOW TO's:
There are many ways to describe a database structure. One of the most usual is to draw an entity relationship diagram (ERD) using a Crow’s Foot notation to represent database elements. If you don’t want to draw it on paper, you should use an appropriate software.
An entity-relationship (ER) diagram is used to show the structure of a business database. ERD represents data as objects (entities) that are connected with standard relationships symbols which Illustrate an association between entities. ERD, there is a wide range of ERD notations used by data bases architects for reflecting the relationships between the data entities. According to the crow’s foot notation relationships are drawn as single labeled lines designating a certain kinds of relationship. Crow foot notation is a most frequently used ERD standard, because of improved readability of diagrams, with a more accurate use of space on the page._Win_Mac.png)
Picture: Entity Relationship Diagram - ERD - Software for Design Crows Foot ER Diagrams
Related Solution:
It is easy to recreate any informational system structure using diagrams. There are three main components of any ER diagram: entity, attribute and relationship. Basing on these three components, one can define other, less used elements, such as weak entity or relationship, derived attribute, recursive relationship etc.
This is the set of graphic elements of ERD Chen's notation. This ERD notation is used to represent an entity–relationship models. It involves the set of geometric forms: rectangles - depicting entities, ovals - representing attributes and diamonds depicting relationships assigned for first-class objects, that can have relationships and attributes of their own. Connections are displayed with arrowed lines. It is known that the Chen's ERD notation is used to show a detailed view of entities and relationships. ConceptDraw Entity-Relationship Diagram solution from the Software Development section of Solution Park provides the ability to create ERD of database structure for software development purposes using the Chen’s notation elements.
Picture: Components of ER Diagram
Related Solution:
Describing a workflow or approval process can take hours and be too complicated, especially since there are options to do it quickly and vividly. Diagrams called flowcharts replace long paragraphs of boring text and represent information in a graphic way. You can draw one on paper or you can use flowchart software to do it quickly and scalable. This kind of software is easy to use and you don’t need any special skills to start using it. In addition, there are a lot examples and predesigned templates on the Internet.
Flowcharts are a best tool for staking out a huge and complex process into some small readable parts. Surely, flowcharts can be drawn manually but the use of standard symbols that make it clear for a wide audience makes a software tool preferred for this task. The core for a successful flowchart is its simplicity. That is why often before beginning making flowchart through software, people draw the sketch on a piece of paper. Designing an effective flowchart means the combination of the data needed to be shown and the simplicity with which you depict it.
Picture: Flowchart Software: A Comprehensive Guide
Related Solution:
In general, you can use any icons to represent network equipment on a diagram. However, there are some icons, for instance, Cisco icons, shapes, stencils and symbols, that are recognizable worldwide. Using those icons you can create Cisco network topology diagrams in minutes and share them anywhere.
The icons depicting Cisco network equipment are recognized and generally applied as standard images for designing network diagrams. They are free to used , but can not be reworked. Cisco network diagrams are created to depict how signals processed on the network equipment and end-user computers and how data transfer through LAN or WLAN between nodes. The vector graphic library of ConceptDraw CISCO Network Diagrams solution includes about 90 icons of Cisco network equipment for designing computer network diagrams with ConceptDraw DIAGRAM.
Picture: Cisco Network Topology. Cisco icons, shapes, stencils and symbols
Related Solution:
When you need to visually represent the structure of relational database, Entity relationship diagram (ERD) is a type of diagram for that case.
Most entity-relationship diagrams can be built with objects from Flowchart solution or ERD Solution which contains inbuilt templates. Follow these steps to create your own custom ERD diagram.
Don't be frightened if it looks complex, ConceptDraw DIAGRAM makes it easy to create an ERD, and hundreds of other diagrams, in minutes.
Picture: Developing Entity Relationship Diagrams
Related Solution:
A database is a data collection, structured into some conceptual model. Two most common approaches of developing data models are UML diagrams and ER-model diagrams. There are several notations of entity-relationship diagram symbols and their meaning is slightly different. Crow’s Foot notation is quite descriptive and easy to understand, meanwhile, the Chen notation is great for conceptual modeling.
An entity relationship diagrams look very simple to a flowcharts. The main difference is the symbols provided by specific ERD notations. There are several models applied in entity-relationship diagrams: conceptual, logical and physical. Creating an entity relationship diagram requires using a specific notation. There are five main components of common ERD notations: Entities, Actions, Attributes, Cardinality and Connections. The two of notations most widely used for creating ERD are Chen notation and Crow foot notation. By the way, the Crow foot notation originates from the Chen notation - it is an adapted version of the Chen notation.
Picture: ERD Symbols and Meanings
Related Solution:
Data modeling is actively applied in analysis and uses wide set of methods for description the data requirements in a system. One of the most popular and well-known is the ERD method of database modeling.
The best ERD tool for the Mac and Windows is ConceptDraw DIAGRAM software extended with the Entity-Relationship Diagram (ERD) solution from the Software Development Area for ConceptDraw Solution Park, which is sharpened for professional ERD drawing and data modeling with Entity Relationship Diagram.
Picture: Data Modeling with Entity Relationship Diagram
Related Solution:
The Wireless Network solution helps users to quickly transition from an idea to the implementation of a wireless computer network.
ConceptDraw DIAGRAM is well placed to provide experienced and comprehensive assistance in the workplace.
The vector stencils, examples, and templates included to solution is a strong toolset for network engineer.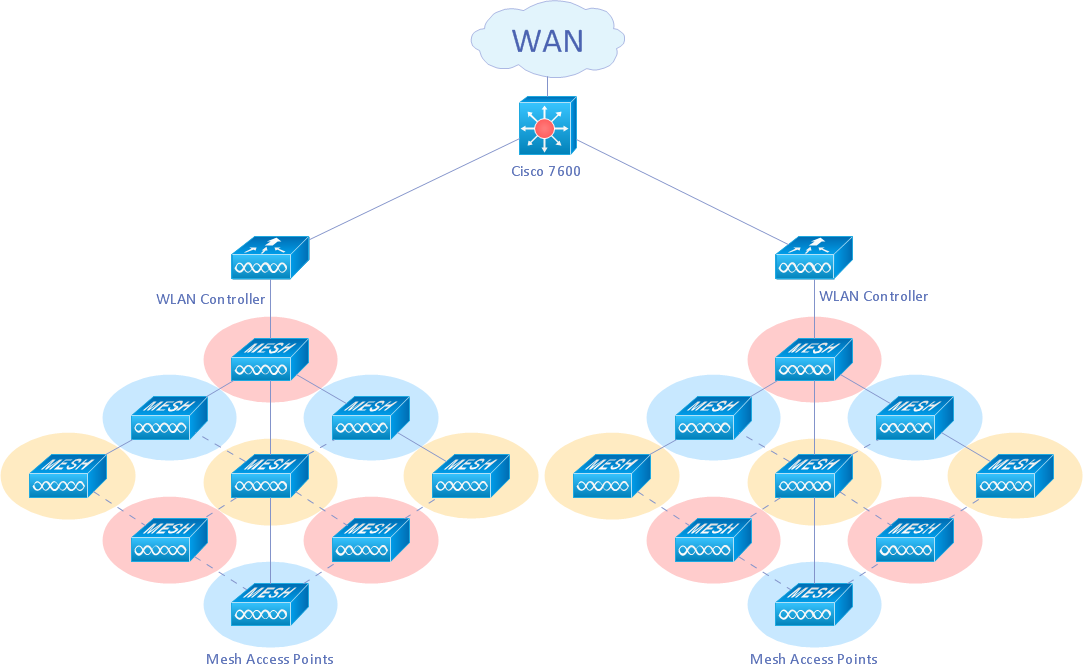
Picture: Wireless Network Drawing
Related Solution:
Data structure diagram (DSD) is intended for description of conceptual models of data (concepts and connections between them) in the graphic format for more obviousness. Data structure diagram includes entities description, connections between them and obligatory conditions and requirements which connect them. Create Data structure diagram with ConceptDraw DIAGRAM.
Picture: Data structure diagram with ConceptDraw DIAGRAM
When creating ER diagrams, you can apply different color ER diagram styles and also notation styles. ConceptDraw DIAGRAM enhanced with Entity-Relationship Diagram (ERD) Solution gives the ability to draw visual and attractive ER Diagrams using the style icons from Crow’s Foot notation and Chen's notation professionally designed and offered by ERD Chen's Notation and ERD Crow’s Foot Notation libraries.
Picture: ER Diagram Styles
Related Solution:
