Made with
ConceptDraw
DIAGRAM 18

Product Overview

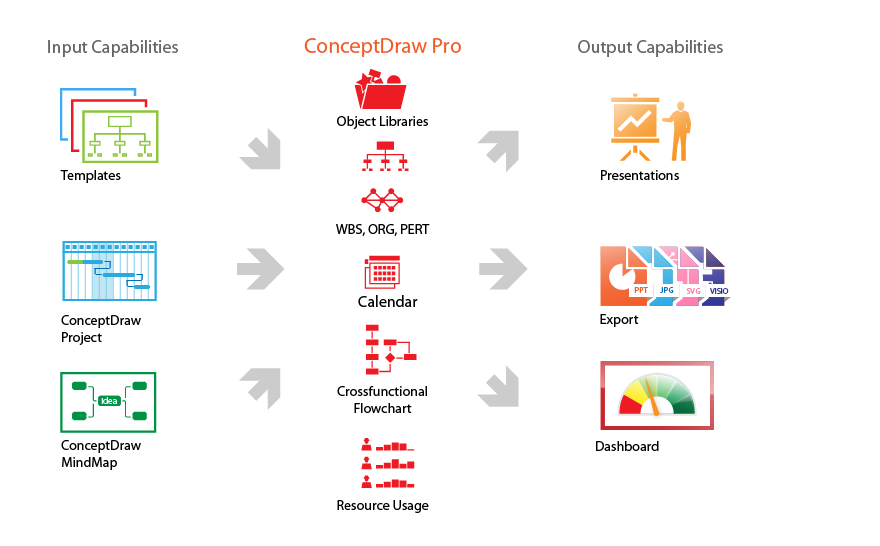
ConceptDraw DIAGRAM offers a wide choice of powerful and easy-to-use tools for quickly creating all kinds of charts and diagrams. Even if you've never used a drawing tool before, it's very easy to create high-quality professional graphic documents with ConceptDraw DIAGRAM That's possible thanks to the program's intuitive interface, comprehensive drawing capabilities, and many pre-drawn library shapes. Templates will help to quickly create most common documents.

ConceptDraw DIAGRAM as a component of ConceptDraw Office

The comprehensive professional features of ConceptDraw DIAGRAM deliver developing graphical enclosures to projects you work with. As a drawing tool, ConceptDraw DIAGRAM recommended to be used as a 'Project Whiteboard' to visualize necessary business and project-related information in the form of charts and diagrams; to organize project Work Breakdown Structure (WBS), and to track tasks execution on an intelligent dashboard.

With ConceptDraw Office ConceptDraw DIAGRAM provides you with the tools you need to generate reports documentation and presentations that entirely reflect project performance.It is a comprehensive tool used to create Work Breakdown Structure (WBS), and track project status on an intelligent dashboard.

Feature Tour

Comprehensive tools for information visualization
Simplest and fastest way to obtain best results
Customize and adjust your issues for perfect result
Effectively communicate and share visual information
ConceptDraw Office featured tools
Product Overview *
TEN RELATED HOW TO's:
Website wireframes are convenient and widely used by developers, visual designers, business analysts, and many other people related with projection, development and promotion websites. Usually website wireframes look lacking of brilliance, but they effectively reflect website functionality, content and visually represent its skeletal framework. ConceptDraw DIAGRAM software offers a unique Website Wireframe solution from the Software Development area with all needed tools for fast and easy drawing professional looking website wireframe with attractive interface design.Interface Design *
Picture: Interface Design
Related Solution:
A Data Flow Diagram (DFD) is a graphical technique which allows effectively model and analyze the information processes and systems. The ability to fast and easy create the DFDs is made possible with Data Flow Diagrams solution from the Software Development area of ConceptDraw Solution Park. For designing the Data Flow Diagrams are used simple DFD flowchart symbols which are connected each other by arrows depicting the data flow from one step to another.DFD Flowchart Symbols *
Picture: DFD Flowchart Symbols
Related Solution:
ConceptDraw PROJECT is simple project management software for planning projects, it include tools for planning project objectives. This type of project planning software intended for professional who use project terms daily. CoonceptDraw PROJECT can be used as customer project management software to keep on track on-site operations. It often used for planning marketing activity as marketing project management software, also it used as simple project management software for software development projects.

ConceptDraw PROJECT <br>Project Management Software Tool *
Picture: ConceptDraw PROJECT Project Management Software Tool
Plumbing systems are very important for any manufacture, and it's a good practice to have a clear scheme of that system. To create one, you should use a piping and instrumentation diagram software with a possibility to save files in vector format, so you can print them without quality loss. ConceptDraw DIAGRAM is a great tool for creating diagrams, and you don't need to be very experienced to use it efficiently. This example of Piping and Instrumentation Diagram (P&ID) depicts a scheme that illustrates the physical sequence and functional communications of piping, instrumentation and plumbing equipment components of a typical food trailer. Seeking to avoid health troubles in a mobile food service , the plumbing demands for food trailers must be considered accurately. This P&ID shows all of piping including a basic set of piping system components along with multiple sinks, extra water heaters and other elements to meet health guidelines.Piping and Instrumentation Diagram Software
Picture: Piping and Instrumentation Diagram Software
Related Solution:
Designing landscapes nowadays doesn’t require any special skills. Therefore, it’s not rocket science how to use landscape design software and create detailed plans and projects. Special Landscape & Garden Solution from the Building Plans area of ConceptDraw Solution Park provides vivid ready-to-use vector objects of trees, bushes, fences, furniture etc.How To use Landscape Design Software
Picture: How To use Landscape Design Software
Related Solution:
Planning a computer network can be a challenge for a junior specialist. However, knowing how to draw a computer network diagrams isn’t a rocket science anymore. There are a lot of special software for creating such diagrams with predesigned templates and examples. The core for Network Fault Tolerance System presented here, is the equipment of Cisco. You can see here the certified Cisco equipment icons. Generally, ConceptDraw DIAGRAM libraries contain more than half of a thousand objects representing the standardized images of Cisco equipment. ConceptDraw solution for network diagramming is a great network diagramming tool for any level skills - from students to network guru.How to Draw a Computer Network Diagrams
Picture: How to Draw a Computer Network Diagrams
Related Solution:
SIPOC is a tool that summarizes the inputs and outputs of one or more processes in table form. You need to draw professional looking SIPOC Diagram quick and easy? Pay please your attention on ConceptDraw DIAGRAM diagramming and vector drawing software. Extended with Business Process Mapping Solution from the Business Processes Area of ConceptDraw Solution Park, it suits ideal for this.SIPOC Diagram *
Picture: SIPOC Diagram
Related Solution:
How to draw pictorial chart quick, easy and effective? ConceptDraw DIAGRAM offers the unique Pictorial Infographics Solution that will help you! Pictorial Infographics solution contains large number of libraries with variety of predesigned vector pictograms that allows you design infographics in minutes. There are available 10 libraries with 197 vector pictograms.How to Draw Pictorial Chart. <br> How to Use Infograms *
Picture: How to Draw Pictorial Chart. How to Use Infograms
Related Solution:
Process mapping helps with sharing business results and reorganizing workflow. In almost every case, after creating a sales process flowchart the steps that are redundant become obvious for a manager. It's easy to find a flowchart examples that will help in developing one for your business. This sales process flowchart consists of a sequence of steps that represent a simple sale process. Each step is shown graphically by a rectangle representing processing steps or an activity, or a diamond representing a decision. These rectangles are linked by arrows, that indicate the direction of the sales workflow. ConceptDraw Sales Flowcharts solution delivers a the full set of classical flowchart notation symbols, along with sales-related icons and pictograms.Sales Process Flowchart
Picture:
Sales Process Flowchart
Flowchart Examples
Related Solutions:
Ultra high frequency (UHF) is the ITU designation for radio frequencies in the range between 300 MHz and 3 GHz, also known as the decimetre band as the wavelengths range from one meter to one decimetre. Radio waves with frequencies above the UHF band fall into the SHF (super-high frequency) or microwave frequency range. Lower frequency signals fall into the VHF (very high frequency) or lower bands. UHF radio waves propagate mainly by line of sight; they are blocked by hills and large buildings although the transmission through building walls is strong enough for indoor reception. They are used for television broadcasting, cell phones, satellite communication including GPS, personal radio services including Wi-Fi and Bluetooth, walkie-talkies, cordless phones, and numerous other applications. 26 libraries of the Electrical Engineering Solution of ConceptDraw DIAGRAM make your electrical diagramming simple, efficient, and effective. You can simply and quickly drop the ready-to-use objects from libraries into your document to create the electrical diagram.Electrical Symbols — VHF UHF SHF *
Picture: Electrical Symbols — VHF UHF SHF
Related Solution:
ConceptDraw
DIAGRAM 18