Internal Audit Process
Having ConceptDraw DIAGRAM software and Audit Flowcharts Solution is useful whether you work as a consultant for some auditing organization or the auditor.
Internal auditing itself is an objective consulting and assurance activity used to improve and so to add value to some organization's operations. With help of such activity any organization can accomplish its objectives in a way of bringing a disciplined systematic approach for evaluating and, as a result, improving the effectiveness of risk management, governance and control processes.
Internal auditing is known to be simply used for improving some organization's governance, management controls and risk management in a way of providing insight and so the recommendations, which are all based on the assessments of data and business processes as well as on the analyses. Being committed to accountability and integrity, all the internal auditing activities provide value to the senior management and governing bodies as an objective source of the independent advices.
The so called professional internal auditors are expected to be employed by organizations in order to perform all the needed the internal auditing activity. The whole scope of internal auditing within some particular organization is known to be very broad, involving such topics as: risk management, management controls and organization's governance over effectiveness as well as efficiency of the operations (such as safeguarding of the assets), compliance with laws and regulations and the reliability of management and financial reporting.
The internal auditing is also known to be involving the process of conducting the proactive fraud audits for identifying the potentially fraudulent acts. Such verifiable organizations are suspected to be involved in participating in such illegal activity as the fraud investigations. The actions of such organization are ruled by the direction of the fraud investigation professionals, that’s why it makes it more complicated to find out if there’s any fraud activity involved at all. In a way of conducting the post investigation fraud audits it becomes possible to identify and so to control the breakdowns as well as to establish any financial loss.
Although, the internal auditors are known to not be in charge for any execution of any company activities, they still tend to advise management as well as the oversight body about the best way for executing their responsibilities in a better way. As a result, the internal auditors end up having a variety of higher professional and educational backgrounds. Working for government agencies (such as local, state and federal), for the traded companies as well as for non-profit companies involved in all possible industries of business activity, the internal auditors can be very useful for guiding such institutes.
The activity of internal auditing itself is known to be very helpful at evaluating the general internal control. The term of “internal control” can be defined as a process, which can be effected by any management, directors as well as other personnel, which is expected to be providing the reasonable assurance due to the achievement of the following main objectives, which are efficiency and effectiveness of the operations, (as it was already mentioned before), reliability of management and financial reporting, compliance with regulations and laws, and safeguarding of the Assets.
Any management within any organization is known to be responsible for all the internal control, comprising all five critical components, which are: control environment, risk focused on the control activities, risk assessment, monitoring activities, and communication and information. Managers are expected to be establishing the policies, practices and processes in the mentioned five components of the management control in order to help any organization to achieve the specific objectives described above.
The internal auditors themselves perform any needed audit for evaluating if those five components of the management control operate effectively, or, in case it is not, provide all the needed recommendations for the further improvement. The Quality of the Internal Audit Report depends of a few factors, such as Objectivity, Clarity, Brevity, Accuracy and Timeliness. Keeping in mind that all the opinions and comments expressed in the issued report are both unbiased and objective, the used language is straightforward and simple, the fact that all the information which is contained in the report is accurate, the report itself is concise as well as released promptly straight after the audit is concluded (usually within one month), results in understanding in the auditors’ work done in a proper way.
Being based on the assessments of the risk within an organization, the management, the internal auditors as well as the oversight boards are known to be the only ones in charge for determining where the focus of the internal auditing efforts should be, as such focus (or prioritization) is part of the annual Audit Planning, being in most of the cases proposed by the CAE for reviewing and approving the Board of Directors. The internal auditing activity itself can be conducted as one or more than one discrete assignments and in case you are involved in such business activity you may need a professional tool for putting the mentioned assignments in order making them all look simply visually good.

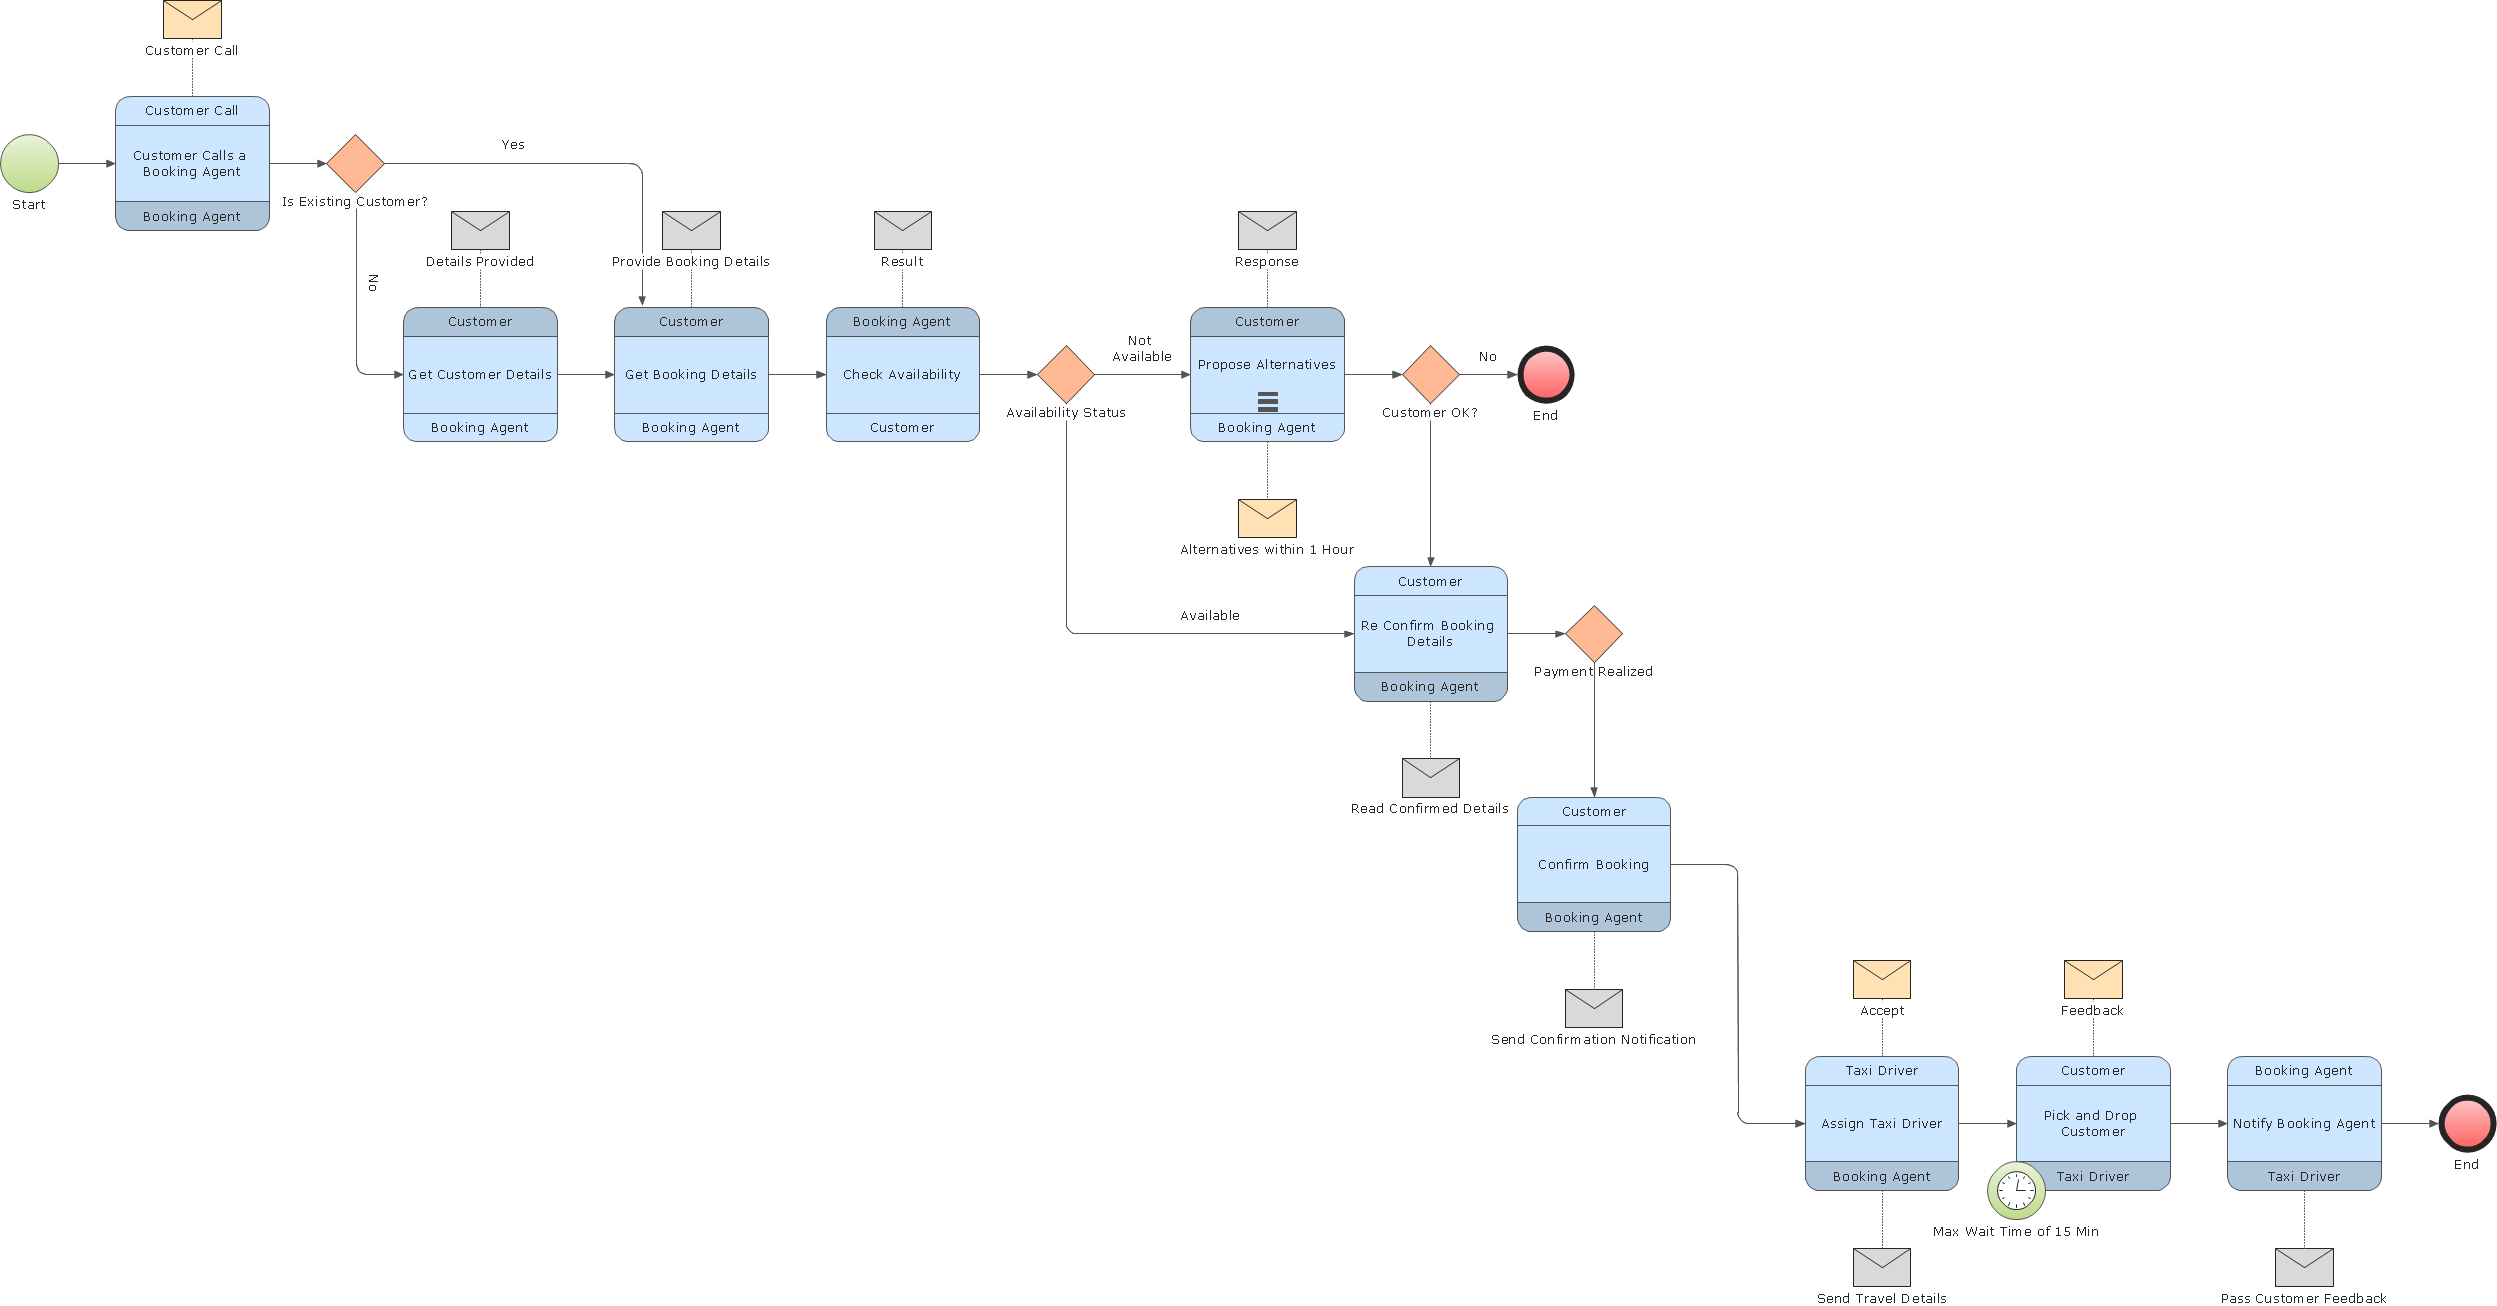
Example 1. Internal Audit Process in ConceptDraw DIAGRAM
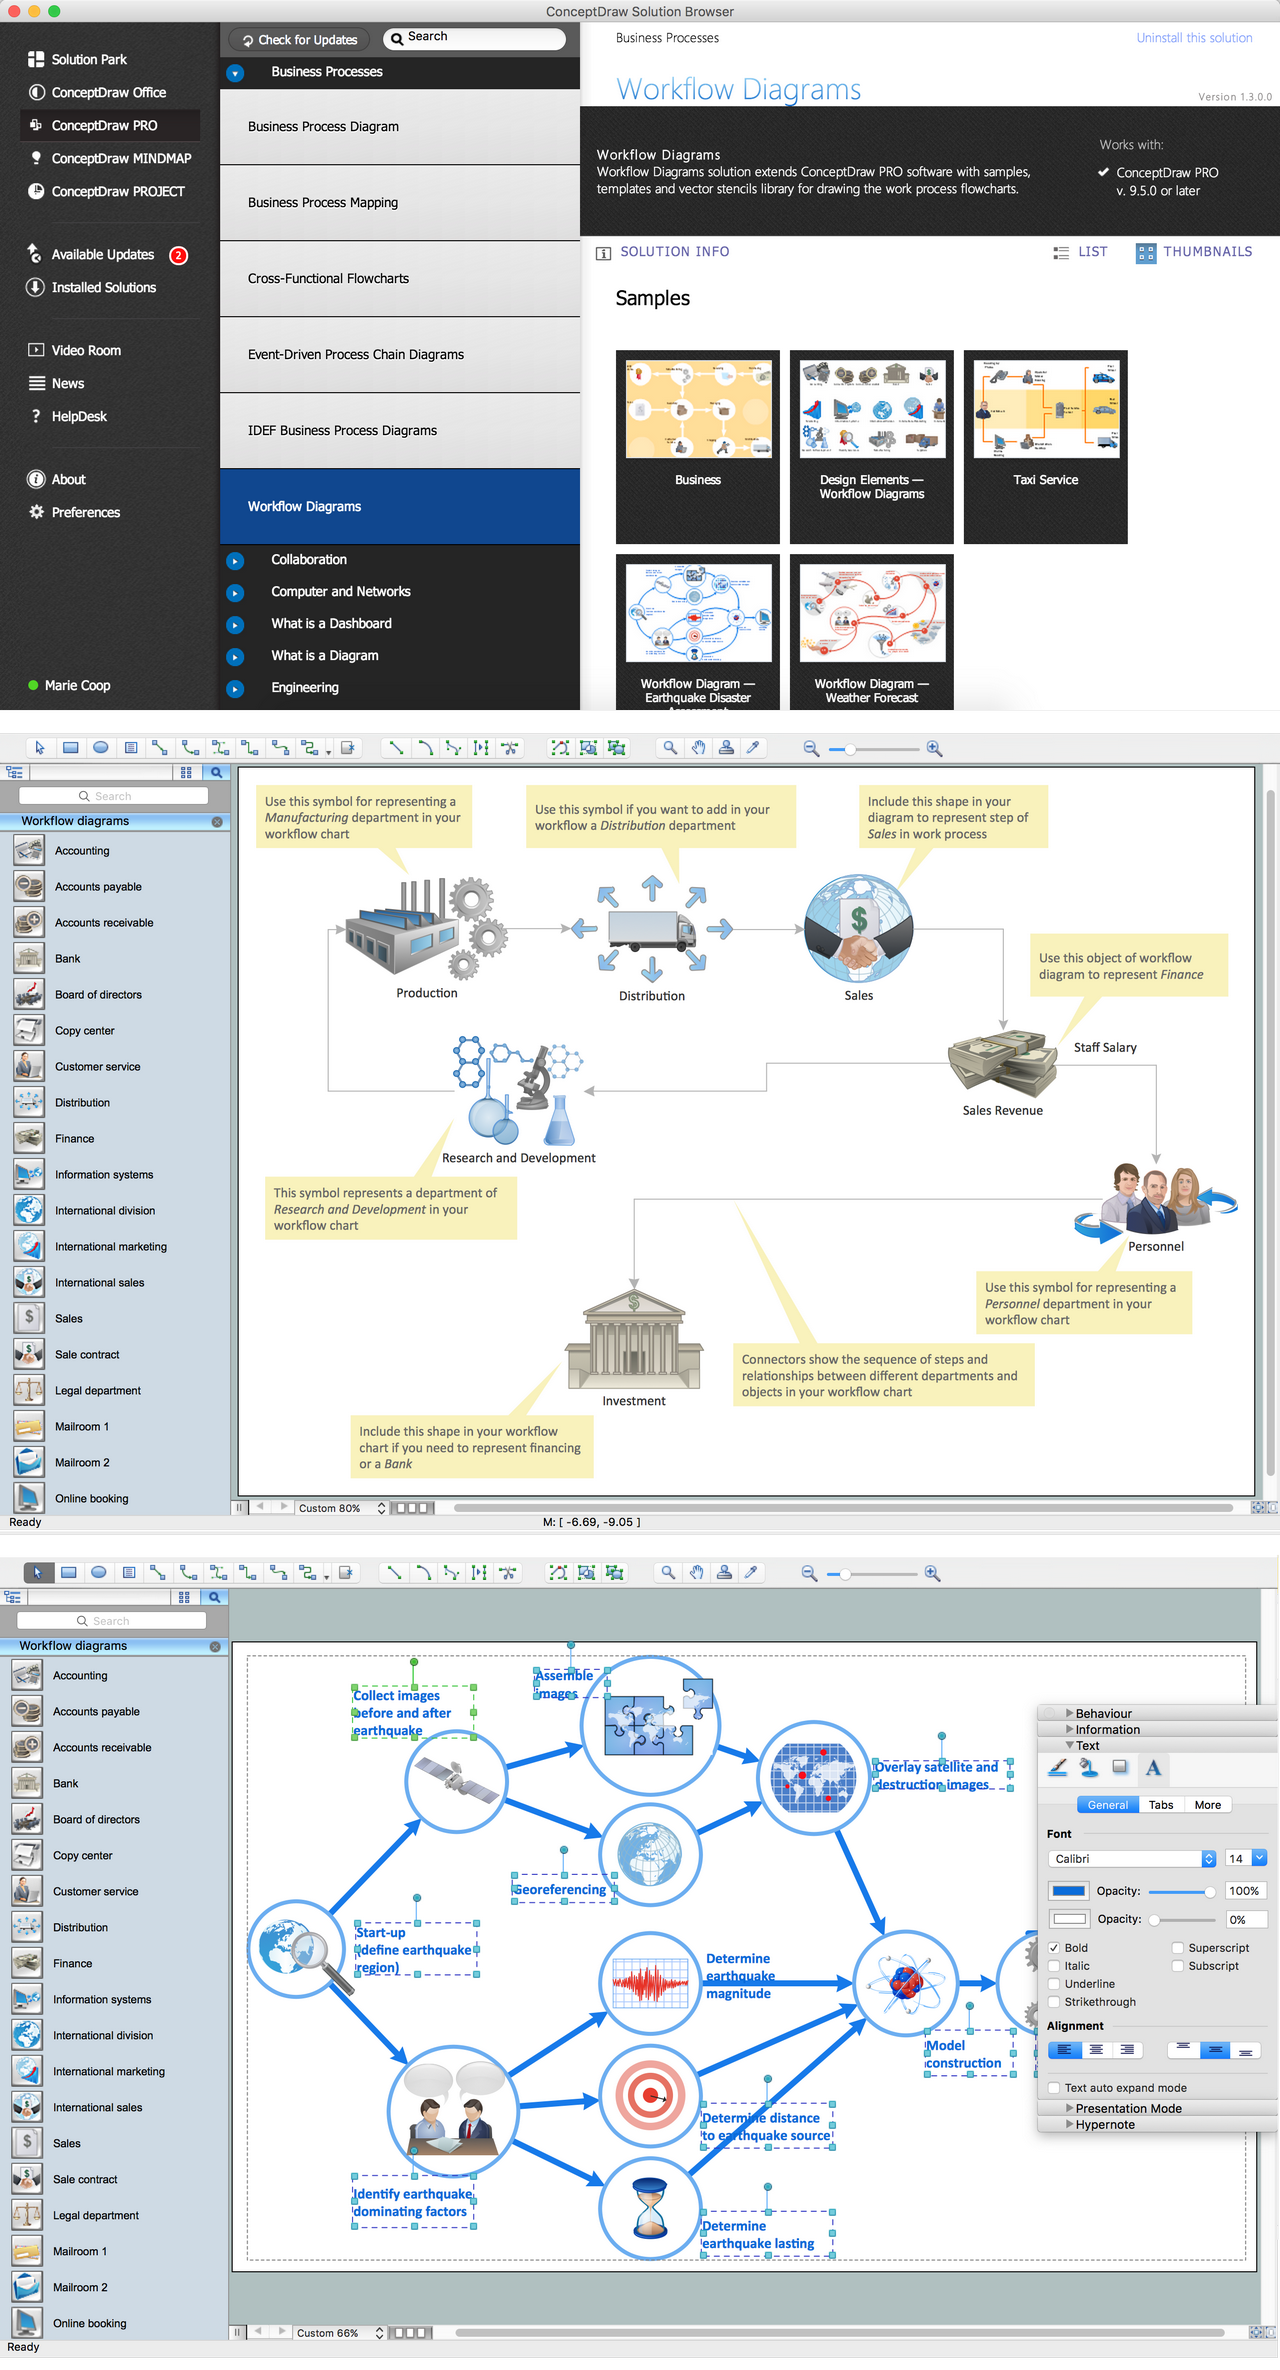
First of all, the Audit Flowcharts Solution offers at your disposal the Audit Flowcharts library with 35 ready-to-use vector objects which greatly facilitate creation of Audit Flowcharts and representation the steps of internal audit process.

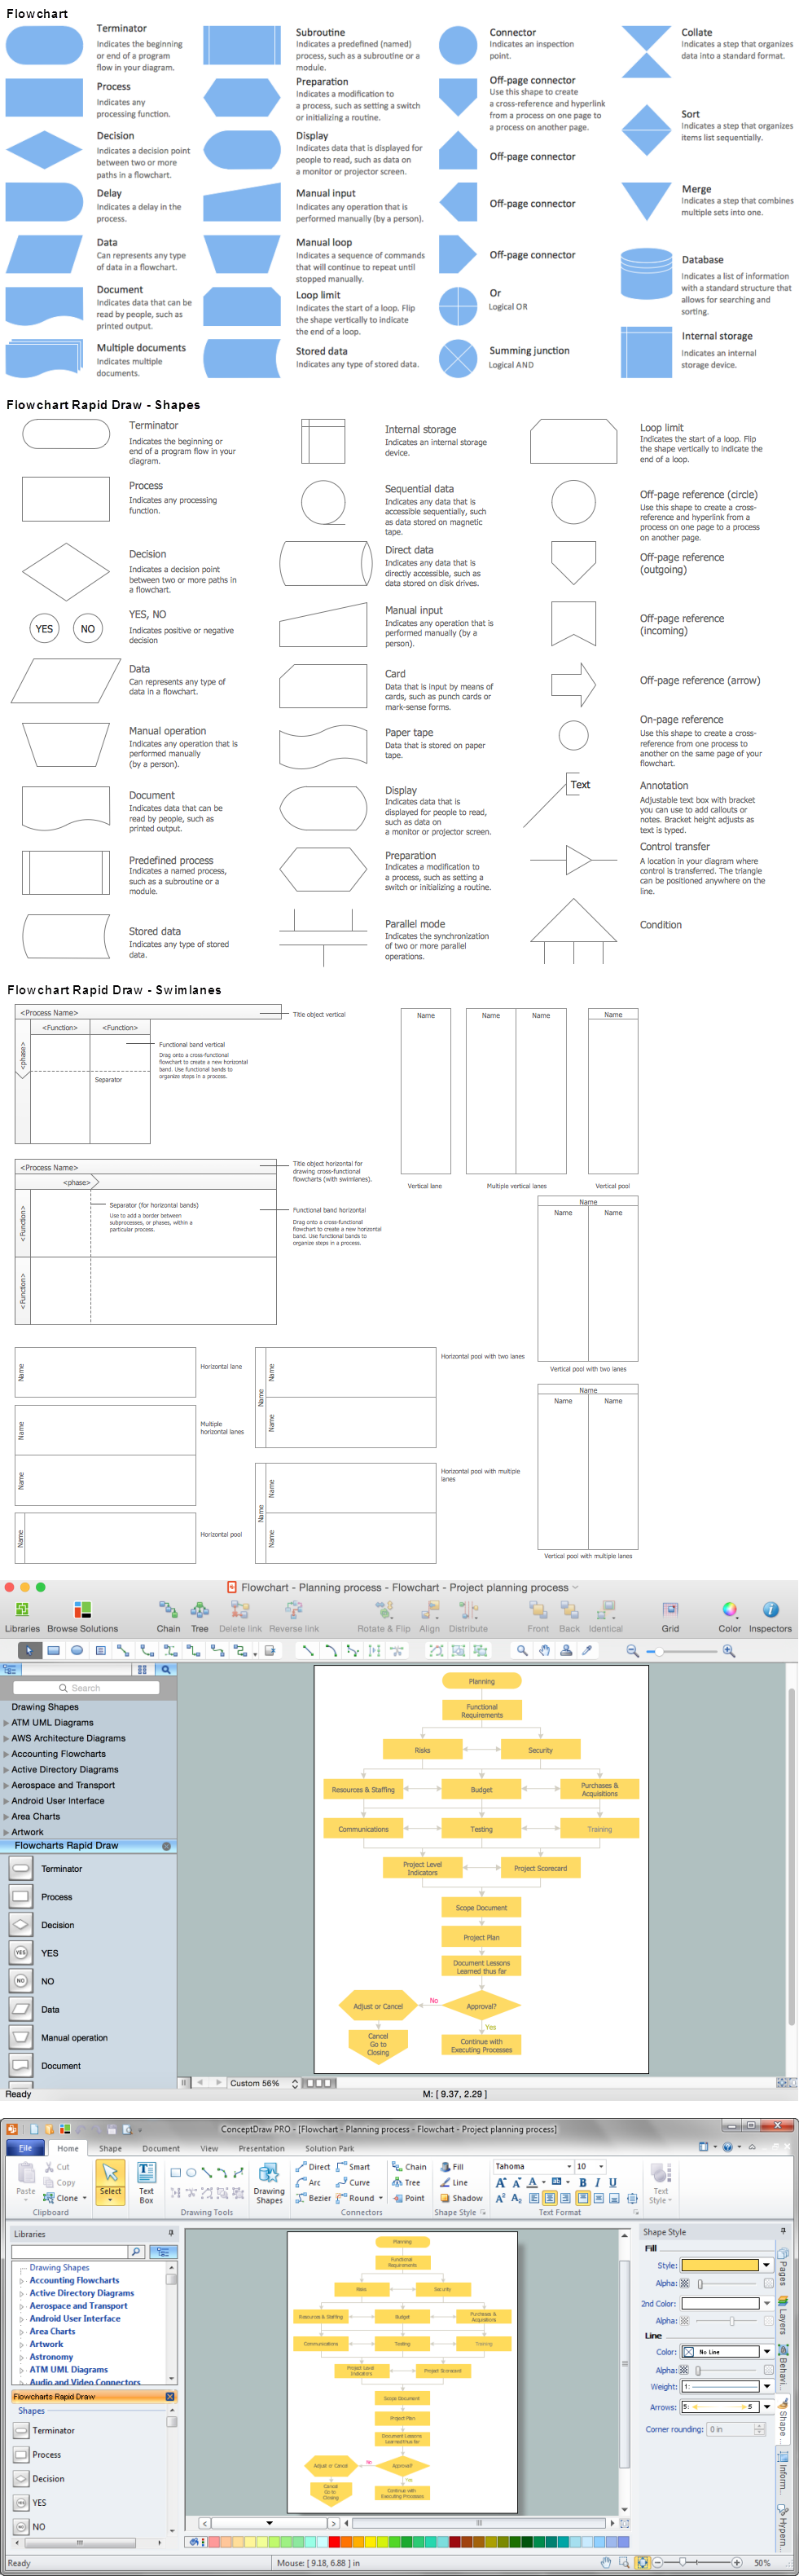
Example 2. Audit Flowcharts Library Design Elements
Having the right tool can always help to make things simpler, such as making an Audit Flowchart, which may be very useful for simplifying the understanding of the ongoing Audit processes. Having ConceptDraw DIAGRAM means having a chance to create any needed drawing, such as diagrams and charts, plans and flowcharts, e.g. the audit ones. Creating the mentioned drawing with help of both ConceptDraw DIAGRAM and another very useful product of CS Odessa — ConceptDraw STORE allows you to make the great as well as professionally looking charts and flowcharts.

Example 3. Internal Audit Process
This sample was created in ConceptDraw DIAGRAM software using the Audit Flowcharts Solution for ConceptDraw DIAGRAM Solution Park and visually illustrates the internal audit process. An experienced user spent 10 minutes creating this sample.
Use the Audit Flowcharts Solution for ConceptDraw DIAGRAM software to quick and easy create your own Audit Flowcharts, Audit Process and Internal Audit Process Flowcharts.