Made with
ConceptDraw
DIAGRAM 18

Accounting Process

Accounting is a powerful tool used for gaining quantitative information about the finances. The accounting process is a series of activities which begins with a transaction and ends with closing of books, and includes recording the income and expenditure of an organization.

ConceptDraw DIAGRAM software offers the Accounting Flowcharts Solution from the Finance and Accounting Area of ConceptDraw Solution Park which is perfect for accounting process visualization and for creation Accounting Process Flowcharts.

Accounting Process

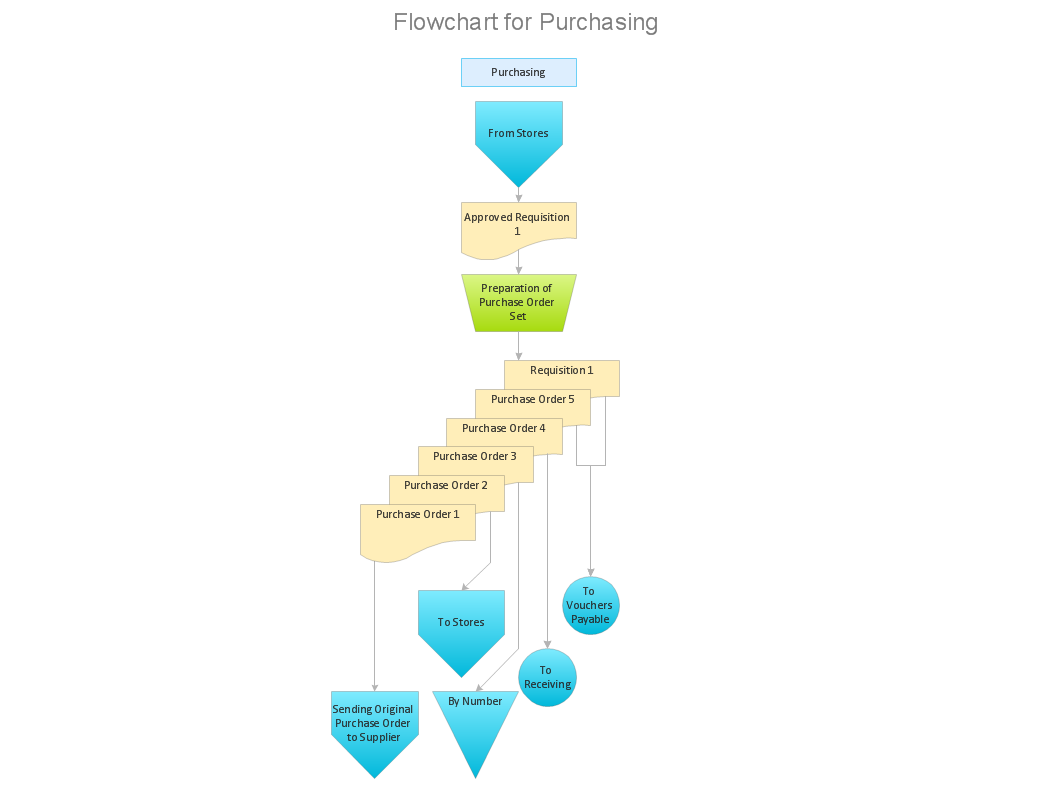
Example 1. Accounting Process Design in ConceptDraw DIAGRAM

When implementing accounting process, specialists often need to draw various accounting flowcharts and diagrams representing the detailed structure of the process. Accounting Flowcharts solution for ConceptDraw DIAGRAM includes the Accounting Flowcharts library with wide variety of vector objects which will help design professional looking Accounting Flowcharts.

Accounting Flowcharts Library Design Elements

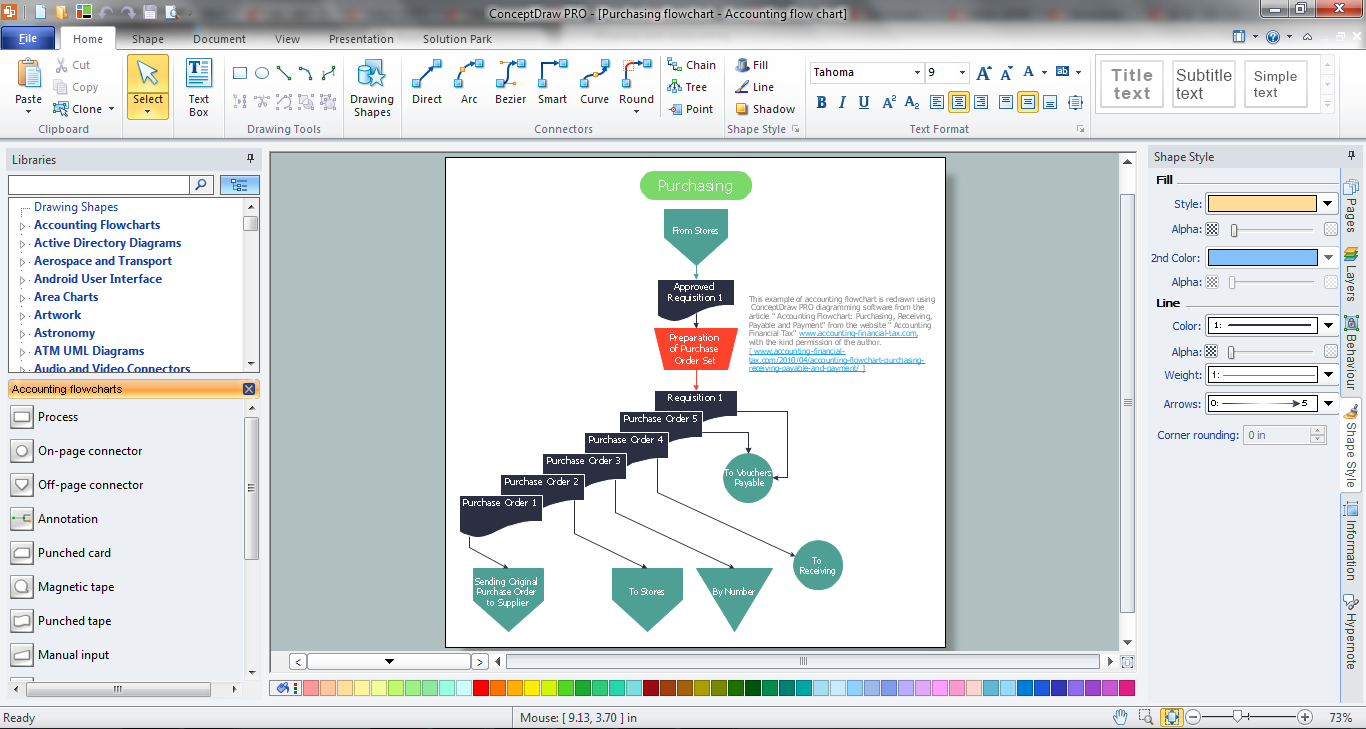
Example 2. Accounting Flowcharts Library Design Elements

All Accounting Flowcharts created in ConceptDraw DIAGRAM are bright and attractive, effectively represent information and will have a great success on conferences, on different meetings and discussions with colleagues.

Procurement Process Mapping

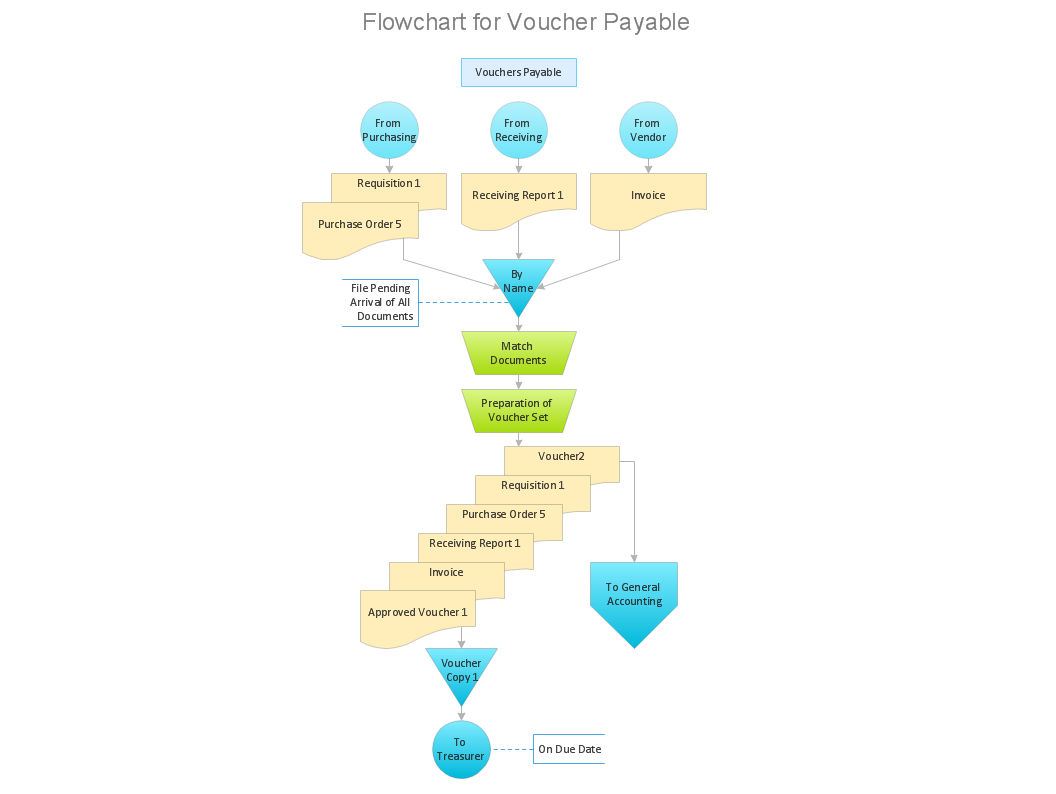
Example 3. Procurement Process Mapping

The samples you see on this page were created in ConceptDraw DIAGRAM using the objects from the Accounting Flowcharts library of the Accounting Flowcharts Solution. An experienced user spent 10 minutes creating each of them.

Use the ConceptDraw DIAGRAM software with Accounting Flowcharts Solution for quick, easy and effective accounting process design and development.

All source documents are vector graphic documents. They are available for reviewing, modifying, or converting to a variety of formats (PDF file, MS PowerPoint, MS Visio, and many other graphic formats) from the ConceptDraw STORE. The Accounting Flowcharts Solution is available for all ConceptDraw DIAGRAM or later users.


FIVE RELATED HOW TO's:
A requisition form is one of the documents used for accounting in different manufacturing processes. There are two main types of requisition: a purchasing requisition and material requisition and difference between them is significant. Creating a flowchart might help you in understanding all the details of accounting process. Flowcharts are a best visual method for dividing a large and complicated procedure into a several little clear pieces. The main value-ability of an effective flowchart is its simpleness. Material requisition flowcharts are used to document the process of relationships between the different departments and the purchasing department within an organization. The flow chart gives the step-by-step guide on how is carried out the procurement process of the materials necessary for the functioning of the organization. This type of flowchart along with many other business flowcharts, one can easy create using ConceptDraw Flowcharts solution.Material Requisition Flowchart
Picture: Material Requisition Flowchart. Flowchart Examples
Related Solution:
Steps in the Accounting Process - The Accounting Process is a sequence of organization activities that is used for gaining quantitative information about the finances. This complex process consists of a set of sequential steps. 9 steps in the accounting process: Analysis of Business Transactions, Make Journal Entries, Post to Ledger Accounts, Prepare Trial Balance, Make Adjusting Entries, Adjusted Trial Balance, Prepare Financial Statements, Close Accounts, Post-Closing Trial Balance.Steps in the Accounting Process *
Picture: Steps in the Accounting Process
Related Solution:
When used in different areas, flowcharts use specific symbols to depict different elements. ConceptDraw DIAGRAM offers libraries of symbols for many areas. One of such libraries is flowchart symbols accounting, which provides symbols for accounting diagrams. Activity-based costing calculates the costs of all products and services based on activities in an organization. A type of accounting flowchart that shows how costs are assigned to products with resources and activities is called Activity-based costing (ABC) flowchart. It can be designed in a digital drawing software such as ConceptDraw DIAGRAM. Here is an accounting flowchart template and symbols. These flowchart symbols are applied for making accounting flow charts in ConceptDraw DIAGRAM and with its Accounting Flowcharts solution. An accounting flowchart is a specific type of a flow diagram. Practically a number of flowchart-type diagrams commonly utilized to clarify many parts of an accounting department working process. Accounting flowchart assists a process of preparing accounting documentation. It shows who responsible for implementation of each step in the workflow of accounting department.Flowchart Symbols Accounting. Activity-based costing (ABC) flowchart
Picture:
Flowchart Symbols Accounting
Activity-based costing (ABC) flowchart
Related Solution:
It can be tough to get straight into business papers and processes.Otherwise, you can learn how to create flowcharts for an accounting information system and visualize these documents. Accounting diagrams are clear and easy to understand for all the participants of the process. There are symbols used for creating accounting flowcharts using ConceptDraw DIAGRAM and its Accounting Flowcharts solution. Accounting flow charts are a special kind of flow charts. Actually a variety of flowcharts are often used to facilitate many aspects of a workflow of accounting department. Accounting flowcharts are utilized to support creating accounting documentation, to depict positions responsible for fulfillment of each phase of accounting workflow.How to Create Flowcharts for an Accounting Information System
Picture:
How to Create Flowcharts for an
Accounting Information System
Related Solution:
When trying to figure out the nature of the problems occurring within a project, there are many ways to develop such understanding. One of the most common ways to document processes for further improvement is to draw a process flowchart, which depicts the activities of the process arranged in sequential order — this is business process management. ConceptDraw DIAGRAM is business process mapping software with impressive range of productivity features for business process management and classic project management. This business process management software is helpful for many purposes from different payment processes, or manufacturing processes to chemical processes. Business process mapping flowcharts helps clarify the actual workflow of different people engaged in the same process. This samples were made with ConceptDraw DIAGRAM — business process mapping software for flowcharting and used as classic visio alternative because its briefly named "visio for mac" and for windows, this sort of software named the business process management tools. This flowchart diagram shows a process flow of project management. The diagram that is presented here depicts the project life cycle that is basic for the most of project management methods. Breaking a project into phases allows to track it in the proper manner. Through separation on phases, the total workflow of a project is divided into some foreseeable components, thus making it easier to follow the project status. A project life cycle commonly includes: initiation, definition, design, development and implementation phases. Distinguished method to show parallel and interdependent processes, as well as project life cycle relationships. A flowchart diagram is often used as visual guide to project. For instance, it used by marketing project management software for visualizing stages of marketing activities or as project management workflow tools. Created with ConceptDraw DIAGRAM — business process mapping software which is flowcharting visio alternative or shortly its visio for mac, this sort of software platform often named the business process management tools.Process Flowchart
Picture: Process Flowchart: A Step-by-Step Comprehensive Guide
Related Solution:
ConceptDraw
DIAGRAM 18