Made with
ConceptDraw
DIAGRAM 18

Database Design

Being engaged in the database design, you can always find the ConceptDraw DIAGRAM diagramming and drawing software a very useful tool for making the database design related drawings, such as an architecture framework, having the examples as well as the stencil libraries from the IDEF Business Process Diagrams solution downloaded from another product of CS Odessa — the ConceptDraw STORE application.

Database Design *

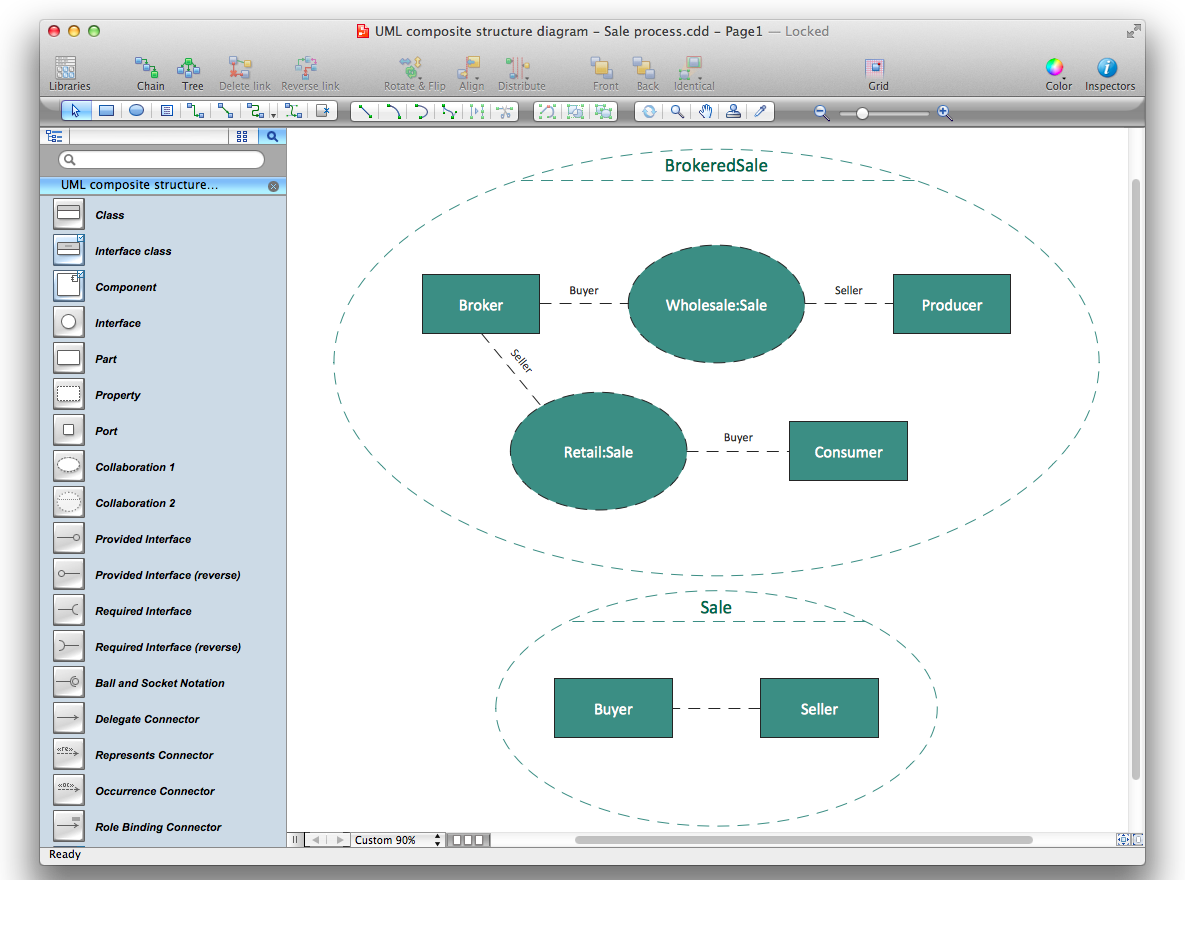
Example 1. Database Design in ConceptDraw DIAGRAM

Database design itself is known to be the process of producing some detailed data model of some particular database, which should contain all the needed physical as well as logical design choices and all the needed physical storage parameters for being able to generate some definite design in a data definition language, that can be used in order to create a database after. Any fully attributed data model is expected to be containing the detailed attributes for each of the existing entities.

The term “database design” itself can be also used for describing lots of different parts of the design of some database system. Any database design can be also called a logical design of some base data structures, which are used for storage of the data, such as the views and the tables in the relational model. At the same time, the relationships as well as the entities in some object database can map directly to the named relationships and the object classes with no intermediation.

The term of “database design” can also be used for applying to the process of designing, not only the base data structures, but also the queries and the forms that are used as part of the database application within some particular database management system. The process of designing the database design usually consists of a few steps which will can be carried out by the database designer, who has to, first of all, determine the data which is to be stored in the database, determine the relationships between lots of different data elements and to superimpose a logical structure on the data, based on the mentioned relationships.

Architecture Framework — IDEF0 Activity Diagram

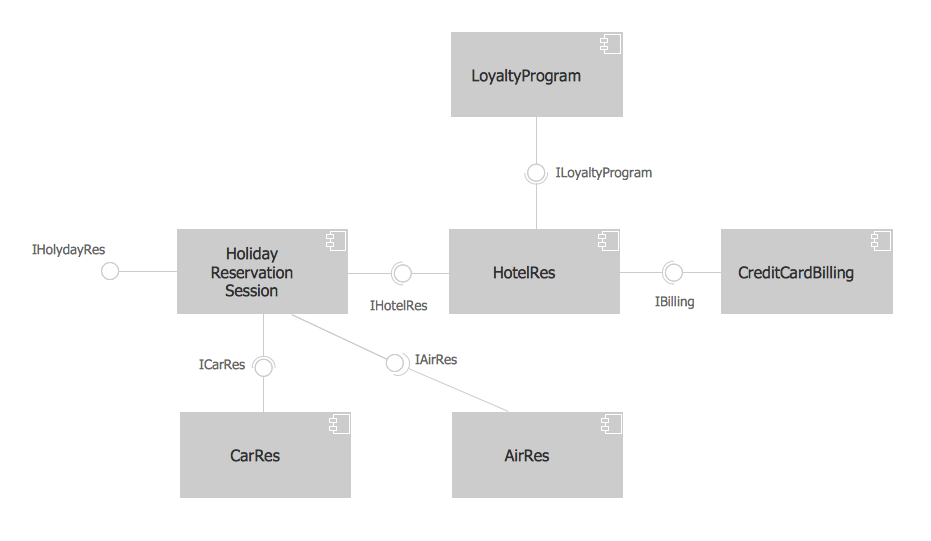
Example 2. Architecture Framework — IDEF0 Activity Diagram

The final step mentioned above can be broken down into 2 further steps within any relational model: determining the grouping of information within the given system by determining what exactly the basic objects are about which that information is being stored, and determining the relationships between the described groups of objects or information, which is never as necessary within one type of databases — an Object one.

In most of the cases, that person who is responsible for the design of some database is that person who has the necessary expertise in the area of database design, but he may have not as much of it in the domain from which the data is about to be stored, such as biological information or financial information. Thus, any data which is expected to be stored in the database, has to be determined in co-operation with a person who has enough expertise in that particular domain, being aware of what data should be stored within the system.

The mentioned process is the one, which can be usually considered as a part of the requirements analysis, requiring skill on the part of the database designer for eliciting the necessary information from those who have enough domain knowledge, as such people cannot express what their system requirements for the database are in a clear way, being unaccustomed to thinking in terms of the discrete data elements that must be stored. All the data to be stored can be always determined by the so-called “Requirement Specification”.

As long as a database designer knows about the data which has to be stored in the database, he must determine where the dependency is within the mentioned data. In case data is changed, then he can change other data which is invisible. In a list of addresses and names, for instance, assuming a situation where different people can have the same address, but one of them cannot have more than one address, the address is known to be dependent on the name. Once the name is provided, then the address can be determined. The inverse situation cannot happen, though, because many different people can reside at the same address. But once an address can be determined by a name, then it can be considered as the one dependent on a name.

Once the dependencies and the relationships between different pieces of information are determined, then it becomes possible to arrange any data into some logical structure which can always be mapped into the storage objects after, being supported by the database management system. In any Object database the storage objects are known to be corresponding directly to the objects, which are used by the Object-oriented programming language. The described language is usually used for writing the applications that will access and manage the data. Any relationships can be always defined as the attributes of the object classes, which are involved. They also can be defined as methods which operate on the object classes.

The way the mentioned mapping is usually performed is such that each of the sets of the related data which depends on a single object, whether it is abstract or actually real, is placed in one of the tables. The relationships between the dependent objects can after be stored as links between different objects. Each of the tables can represent some implementation of either a relationship joining one or more than one instances of a few logical objects or one single logical object. All the relationships between the existing tables can always be stored as links, which are connecting child tables with their parents. As the complex logical relationships are tables, they can have links to more than only one parent.

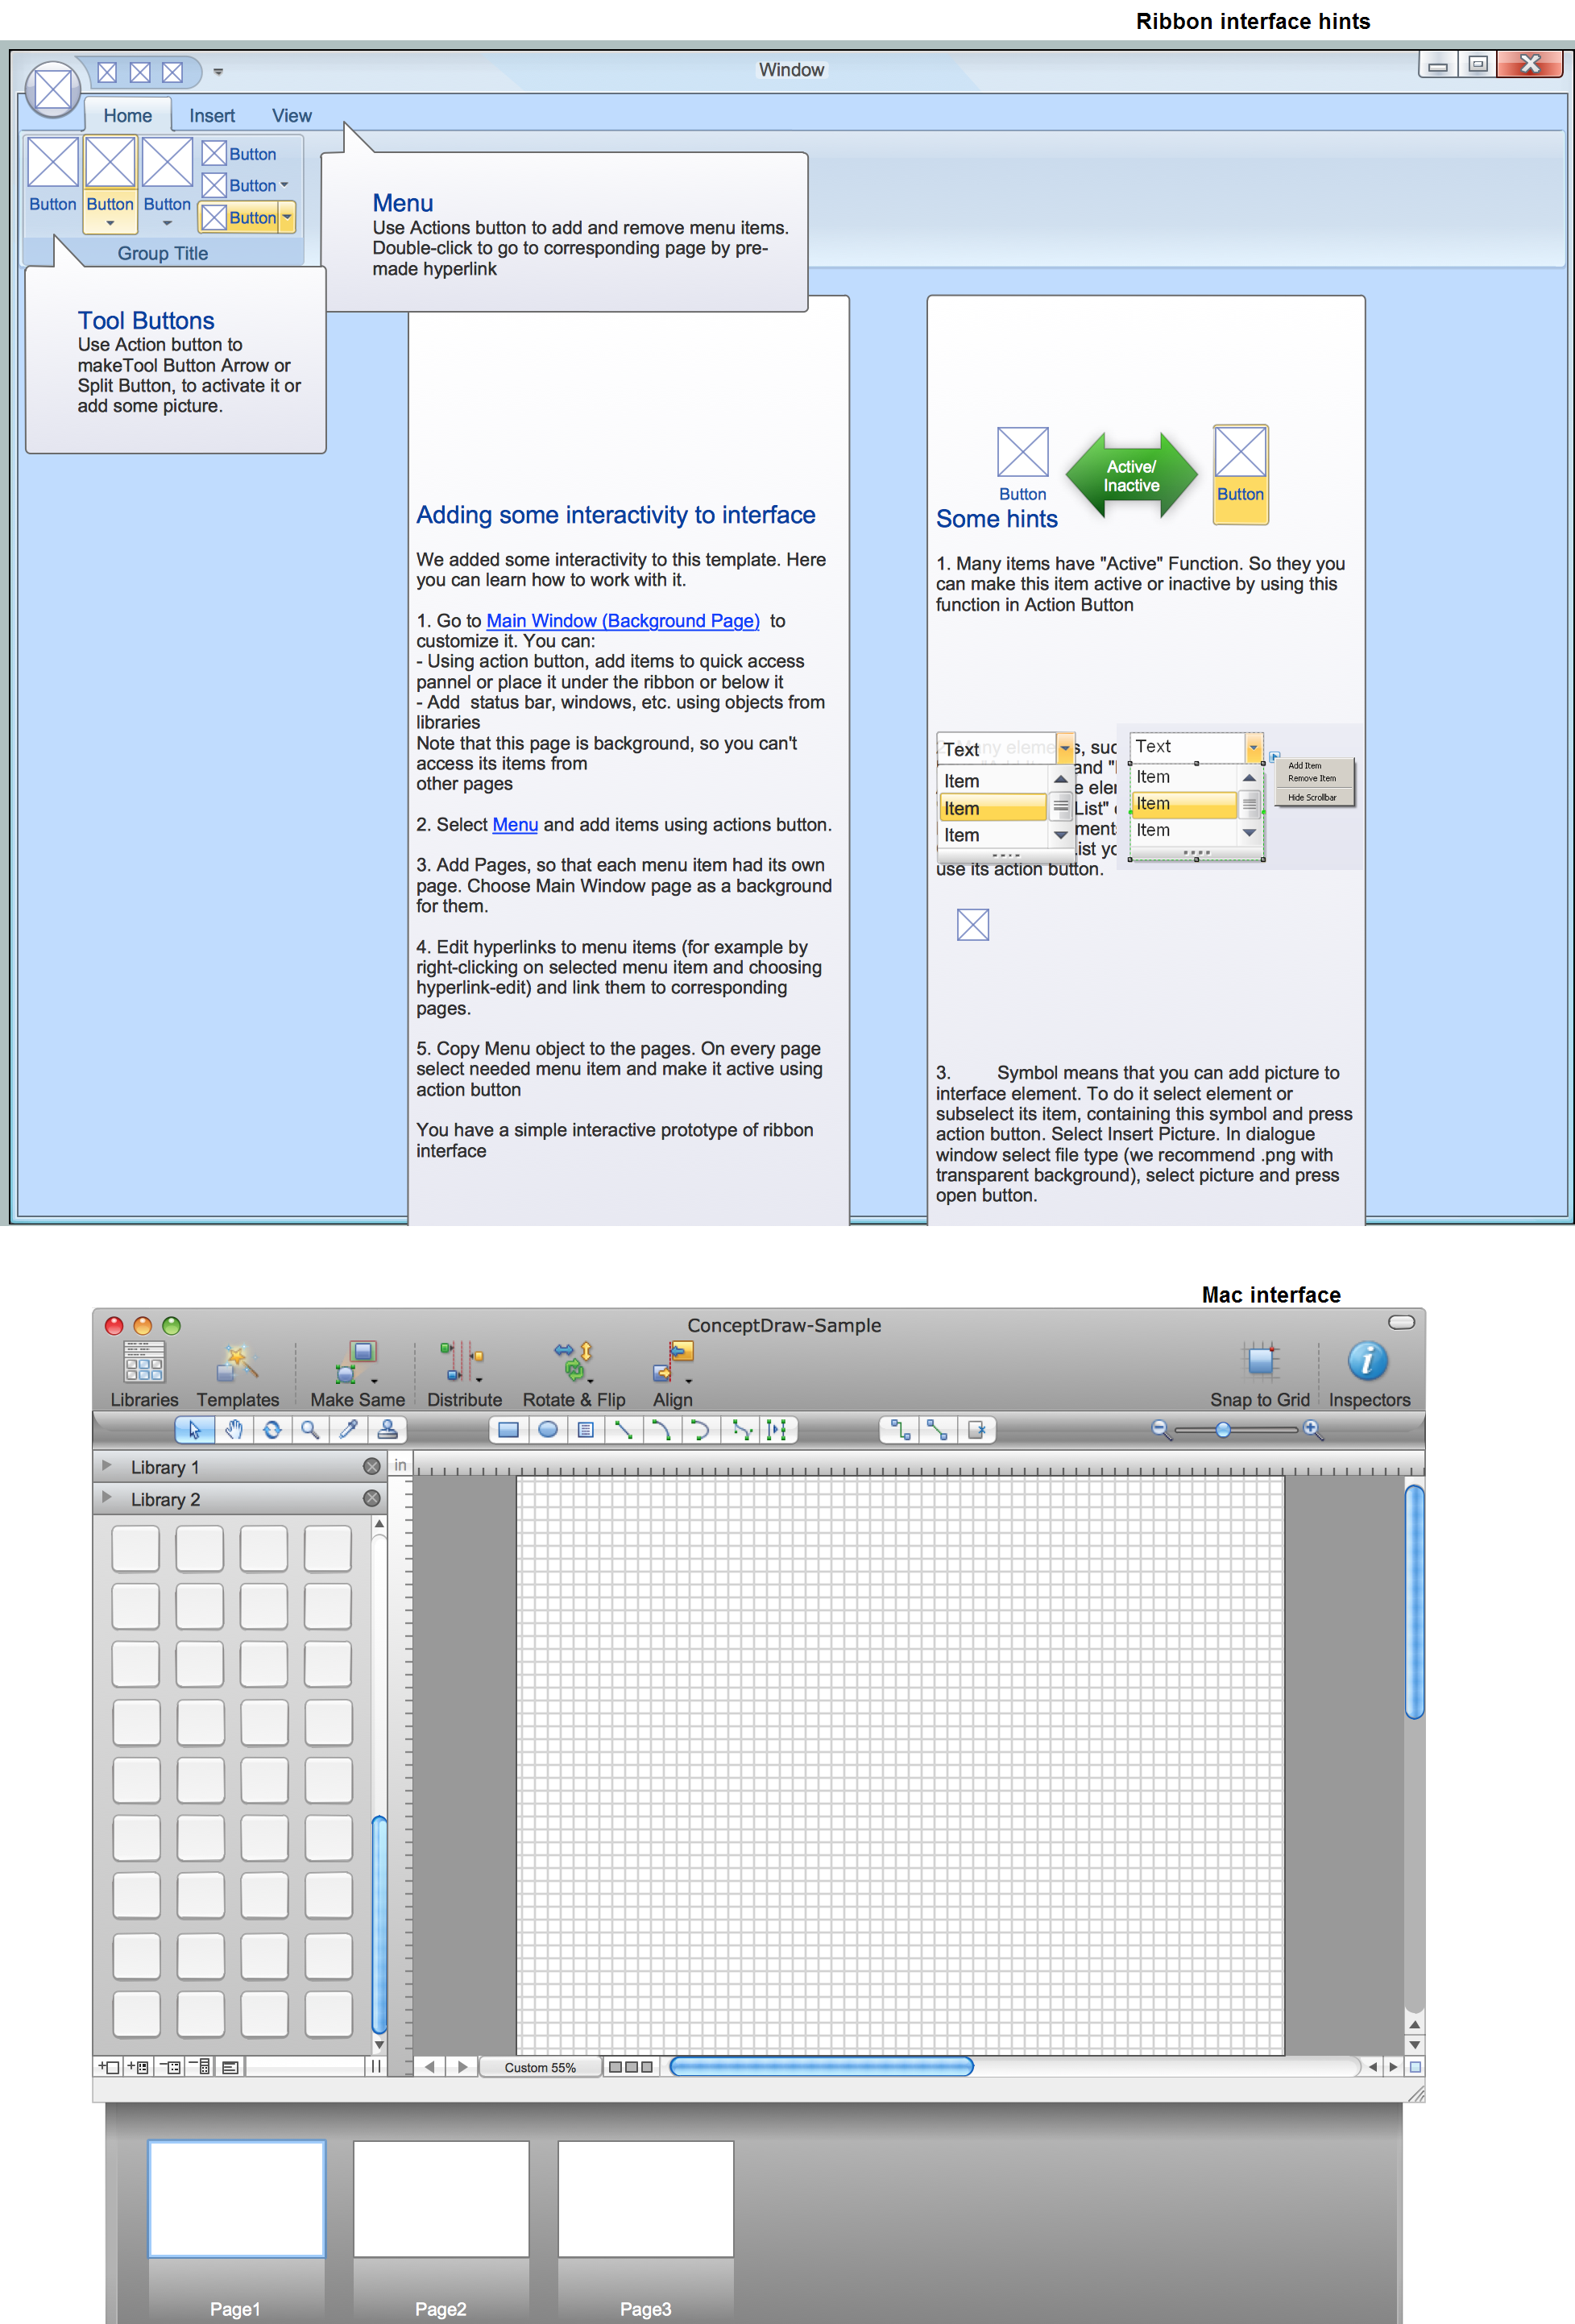
Example 3. Libraries of Database Design

Having an IDEF Business Process Diagrams solution, which is available for all the ConceptDraw DIAGRAM users means having all the necessary tools, such as the design symbols and the pre-made examples of the needed drawings which all can be used as the base for some other ones. The stencil libraries of the mentioned solution are full of the design elements, representing such terms as “Call and Continue Referent” (referent type/label in Locator), “Call and Wait Referent” (referent type/label in Locator), “Note” (Note ID), “UOB symbols” (unit behaviour - UOB labels), Junctions: AND junction (process), OR junction (process), Synchronous AND junction, Synchronous OR junction, XOR junction; and Links: Single precedence link, etc.


TEN RELATED HOW TO's:
Any information system receives data flows from external sources. In order to visualize them there is a list of data flow diagram symbols that describes how the system components cooperate. If you want to create a data flow diagram, ConceptDraw DIAGRAM Solution Park has DFD Library that contains both Yourdon and Gane-Sarson notations. This figure shows the content of vector libraries, delivered with ConceptDraw solution for data flow diagram (DFD). There are three libraries composed from about 50 vector objects used to make data flow diagrams. They include a complete set of objects utilized by Yourdon-Coad and Gane-Sarson notations - two primary notations that are apply for data flow diagramming. Also, one can discover additional "Data flow diagram (DFD)" library that provides a data flow diagram elements for designing level 1 and context-level data flow diagrams.Data Flow Diagram Symbols. DFD Library *
Picture: Data Flow Diagram Symbols. DFD Library
Related Solution:
As restaurant industry is growing rapidly nowadays, researches show that almost half of the adults have worked in a restaurant or a cafe. Moreover, many of them dream to start their own someday. Unfortunately, it takes a lot of time to write a business plan and to find a great location, although some know how to create a restaurant floor plan in minutes or how to plan budget effortlessly. Hiring employees can also cause a lot of headache, but this is crucial for further success, because every guest comes to restaurant for a good service and delicious food. It is also worth noting that restaurant concept is also important, because it defines target audience and influences the menu. This diagram represents the floor plan of an ongoing sports-theme establishment - restaurant, cafe, or other food service. A number of widescreen monitors installed along the perimeter provide visitors the opportunity to follow the course of a match from anywhere in the dining room of restaurant or cafe. The most of sports fans believe that food and alcohol is a big part of any sports show. That is why the dining room takes the most space - almost 60% of the total establishment space. Nearly all sports fans consume beverages while watching sports - beer, soda or water at least. Thus, the restaurant floor plan designers added a large lavatory there. Moreover, project developers considered unnecessary the gender division of such delicate place - perhaps they guess that only men are watching football, or believe that alcohol will eliminate the most of gender differences.Restaurant Floor Plan
Picture: How To Create Restaurant Floor Plan in Minutes
Related Solution:
If you want to find a way to understand complex things in minutes, you should try to visualize data. One of the most useful tool for this is creating a flowchart, which is a diagram representing stages of some process in sequential order. There are so many possible uses of flowcharts and you can find tons of flow charts examples and predesigned templates on the Internet. Warehouse flowchart is often used for describing workflow and business process mapping. Using your imagination, you can simplify your job or daily routine with flowcharts. Warehouse flowcharts are used to document product and information flow between sources of supply and consumers. The flowchart provides the staged guidance on how to manage each aspect of warehousing and describes such aspects as receiving of supplies; control of quality; shipment and storage and corresponding document flow. Warehouse flowchart, being actual is a good source of information. It indicates the stepwise way to complete the warehouse and inventory management process flow. Also it can be very useful for an inventory and audit procedures.Warehouse Flowchart
Picture: Flow Chart Example: Warehouse Flowchart
Related Solution:
Sometimes it’s quite useful to look on a problem from another view. To gain insight into an obstacle you should use SWOT analysis, and this will help you to see the whole situation. When composing a SWOT matrix, you divide your problem onto four elements - strengths, weaknesses, opportunities and threats and place them into matrix. This sample SWOT analysis matrix of the athletic shoes producing company was designed on the base of template provided by ConceptDraw SWOT and TOWS Matrix Diagrams solution. It delivers number of easy-to-use templates and samples of SWOT and TOWS matrices for ConceptDraw DIAGRAM. Applying one of these templates, enables to quickly find out Strengths, Weaknesses, Opportunities, and Threats. After creating a list managers can consider methods the business can use to amplify strengths and to decrease weaknesses; realize opportunities; and avoid threats.SWOT Analysis *
Picture: SWOT Analysis
Related Solution:
Building plans are usually very complicated and a hard work to do. It would be nice to use a proper drawing software to facilitate the task. Design a site plan quick and easily with all the stencils and samples from ConceptDraw libraries. This drawing shows content of the ConceptDraw vector libraries related to the site planning and arrangement of the living environment. ConceptDraw delivers about 50 libraries containing near one and a half thousands vector objects that will help you to design territory arrangement plans and make the Site plan sketches. You can use the Parking and Roads library for designing a parking space, or drawing transport management schemes. The Site Accessories library provides a number of objects, that allow you to depict various equipment of vehicle access control, street lamps, benches, trash cans and other items of the street environment.Building Drawing Software for Design Site Plan
Picture: Building Drawing Software for Design Site Plan
Related Solution:
ConceptDraw DIAGRAM is a very easy-to-use and intuitive database design tool which can save you hundreds of work hours. See database diagram samples created with ConceptDraw DIAGRAM database modeling database diagram software.ConceptDraw DIAGRAM Database Modeling Software *
Picture: ConceptDraw DIAGRAM Database Modeling Software
Use the set of special professionally developed swim lane flowchart symbols - single, multiple, vertical and horizontal lanes from the Swimlanes and Swimlanes BPMN 1.2 libraries from the Business Process Diagram solution, the Swim Lanes library from the Business Process Mapping solution as the perfect basis for your Swim Lane Flowcharts of processes, algorithms and procedures.Swim Lane Flowchart Symbols *
Picture: Swim Lane Flowchart Symbols
Related Solution:
When it comes to system construction, a class diagram is the most widely used diagram. UML Class Diagrams is a type of static structure diagram that is used for general conceptual modeling of the systematics of the application. Such a diagram would illustrate the object-oriented view of a system. The object orientation of a system is indicated by a class diagram. It describes the structure of a system by showing the general issues,classes of a system, attributes, operations, interfaces, inheritance, and the relationships between them.UML Class Diagram Notation *
Picture: UML Class Diagram Notation
Related Solution:
ConceptDraw DIAGRAM software is the best Mac software for drawing workflow diagrams. Its rich set of samples and templates, and specific features to draw diagrams faster make this software as comfortable as possible for drawing workflow diagrams. Use the ConceptDraw DIAGRAM professional Mac OS X software for drawing workflow diagram. The Workflow Diagrams solution with its libraries and templates set make the possibility to identify resources that are required for work goal implementation. The process flow diagram identify flow which occurs as network of process dependencies, organizational decisions and interactions between departments. Usually workflow diagrams show business participants actions that carry product or service to the final destination, the consumer.Workflow Diagram Software Mac *
Picture: Workflow Diagram Software Mac
Related Solution:
ConceptDraw Office is the most effective tool for planning, tracking, and reporting all types of projects with strong management capabilities, user friendly functionality, and superior ease of use. In this tutorial video we will assist you in planning and managing a project using ConceptDraw Office.How To Plan and Implement Projects Faster *
Picture: How To Plan and Implement Projects Faster
ConceptDraw
DIAGRAM 18