What process should be essentially adopted.
Accounting Flowchart Example
Flowchart
It is important to know what process should be essentially adopted at the work. The Accounting Flowcharts Solution allows to document and present visually such processes like a receiving process, purchasing process, payment process, etc.ConceptDraw DIAGRAM is a flowcharting software that gives the ability to draw accounting processes flowchart for the presenting.

Sample 1. Flowchart - Receiving.
Accounting Flowcharts solution from ConceptDraw Solution Park provides templates, samples and library of vector shapes for drawing the Accounting Process Flowcharts.
Use ConceptDraw DIAGRAM with Accounting Flowcharts solution to document and communicate visually how accounting processes work, and how each operation is done.
TEN RELATED HOW TO's:
In software engineering, it is important to understand how the system would cooperate with external sources, like data sources. To give this information a visual representation, data flow diagrams (DFD) were used for years. The entire system is usually divided into smaller ones, and all of them process data flows in appropriate ways.
The visualizing business processes which engages the data transfer, is commonly preformed using DFDs (data flow diagrams). DFD is used to show the data flow processing and transformation. This DFD represents the electronic system of a customer purchase. It was created using Gane/Sarson notation. Data flow diagrams helps you to sort through and clarify transferring process making it available for analysis, and representation. ConceptDraw DFD solution introduces the vector library, containing the full set of icons from DFD notations.
Picture: Data Flow Diagram (DFD)
Related Solution:
There are many ways to define the flow of information within a system. Structured-systems analysis method often uses data flow diagrams to show data flow, data storages and data processing visualization. These diagrams are easy to develop and quite useful.
Here is a dataflow diagram presenting an example of the manufacturing process flow. The oval process shapes represent a process that controls data within the current system. The process may produce data or make some action based on data. Data flows are represented by lines. They show the movement of information through the system. The direction of the data flow is depicted by the arrow. The external entities are shown by rectangles. They represent the external entities interacting with the system. The data store objects (unclosed rectangles) are used to show data bases participating in a process flow.
Picture: Data Flow Diagram
Related Solution:
Design efficiently the technical flow charts in ConceptDraw DIAGRAM software for various fields and provide ✔️ clarity, ✔️ accuracy, ✔️ usability, ✔️ simple communication, analysis, and improvement
Picture: Technical Flow Chart Example
Related Solution:
Accounts Payable Flowchart - There is nothing easier than do it in ConceptDraw DIAGRAM. ConceptDraw DIAGRAM diagramming and vector drawing software provides the Accounting Flowcharts Solution from the Finance and Accounting Area of ConceptDraw Solution Park.
The Accounting Flowcharts Solution contains templates, samples and library of ready-to-use predesigned vector objects that will help you create: accounts payable flowchart, accounts payable process flow chart, accounting flowchart of any complexity quick and easy.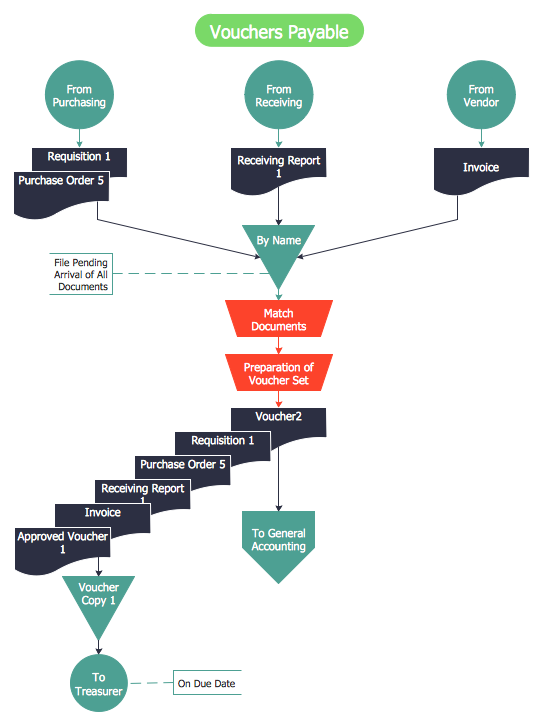
Picture: Accounts Payable Flowchart
Related Solution:
The Total Quality Management Diagram solution helps you and your organization visualize business and industrial processes. Create Total Quality Management diagrams for business process with ConceptDraw software.
Picture: TQM Diagram Tool
Related Solution:
Create flowcharts, org charts, shipping flowcharts, floor plans, business diagrams and more with ConceptDraw. Includes 1000s of professional-looking business templates that you can modify and make your own.
Picture: Basic Diagramming
Related Solution:
Mac compatible remote presentation, A simple way to share your presentation remotely via Skype. All participants receive presentation file.
Picture: Mac Compatible Remote Presentation
Related Solution:
Create a Pie Chart with ConceptDraw software quickly and easily. The simple tutorial helps you learn how to create a pie chart.
Picture: How to Create a Pie Chart
Related Solution:
Use the set of special professionally developed swim lane flowchart symbols - single, multiple, vertical and horizontal lanes from the Swimlanes and Swimlanes BPMN 1.2 libraries from the Business Process Diagram solution, the Swim Lanes library from the Business Process Mapping solution as the perfect basis for your Swim Lane Flowcharts of processes, algorithms and procedures.
Picture: Swim Lane Flowchart Symbols
Related Solution:
Steps in the Accounting Process - The Accounting Process is a sequence of organization activities that is used for gaining quantitative information about the finances. This complex process consists of a set of sequential steps.
9 steps in the accounting process: Analysis of Business Transactions, Make Journal Entries, Post to Ledger Accounts, Prepare Trial Balance, Make Adjusting Entries, Adjusted Trial Balance, Prepare Financial Statements, Close Accounts, Post-Closing Trial Balance.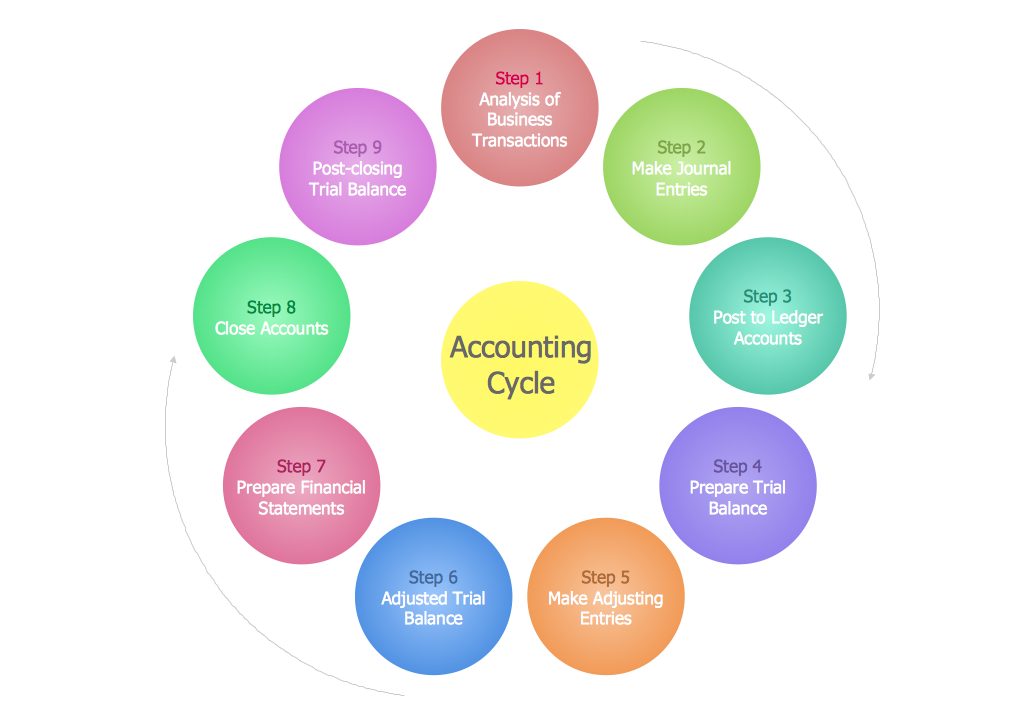
Picture: Steps in the Accounting Process
Related Solution:
ConceptDraw
DIAGRAM 18