Building Social Media Response Plan DFD
Organizing and Selecting Social Media Response Action
The Social Media Response solution provides the means to respond to social media mentions quickly and professionally. This tool keeps the entire team on the same page allowing you to realize your social media strategy, improve the quality of your answers, and minimize the time it takes to respond.
Interactive Flowcharts can change the way one creates and organizes their social media response process. Visual navigation through the stages of a response process helps you locate specific actions to be taken via Action Mind Maps. Action Mind Maps can be used to describe primary messages and good additions, show examples of messages, and also define the main objective of messaging for a specific situation.
See also Videos:
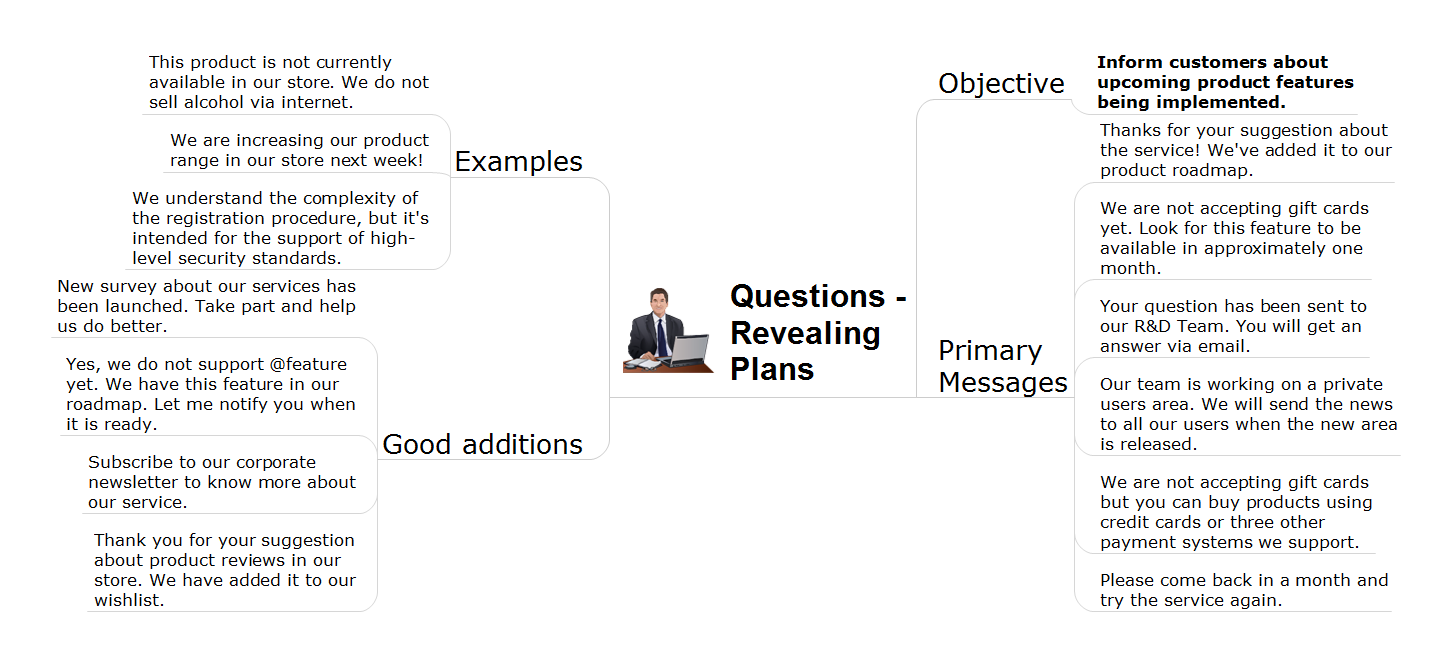
Sample 1. Social media response action mindmap sample: Discover plans question.
It’s a big help to customers if you can answer questions before they were asked.
Action Maps helps the teams be on the same page and follow the social media response plan.


