Made with
ConceptDraw
MINDMAP 16

Business Process

Benefits

Business Process Diagrams (Cross-Functional-Flowcharts, Workflows, Process Charts, IDEF0 and IDEF2, Timeline, Calendars, Gantt Charts, Business Process Modeling, Audit and Opportunity Flowcharts) and Mind Maps (presentations, meeting agendas).

Objective

Visually document and communicate Business Process information.

Solution Purpose

Business Process diagrams and mind maps are quick and easy to put together.

Intended For

Managers who are responsible for control and design of Business Process, and need to use visual documents and communication strategy.

Products and methods

To support you in your tasks you can use the power of ConceptDraw DIAGRAM providing intelligent vector graphics that are useful for Business Process diagramming and ConceptDraw MINDMAP for key Business Process mind maps.

Business Process *

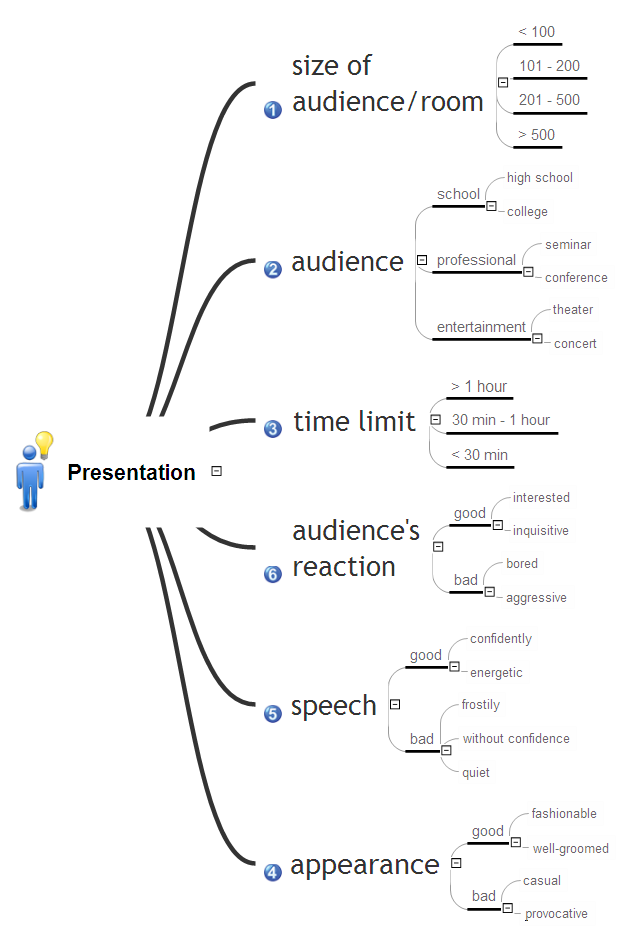
Example 1. Business Process Presentation

Business Process Meeting

Example 2. Business Process Meeting


The Benefits for ConceptDraw MINDMAP Brainstorming Software

  • ConceptDraw MINDMAP is effective for brainstorming, designing mind maps, idea generating, creative and lateral thinking, creativity and problem solving.
  • ConceptDraw MINDMAP is ideal for team and personal work in Business, Marketing and Project Management.
  • The libraries with large quantity of vector objects help to illustrate your mind maps and to make them bright, visual and comprehensible.
  • Use of View Navigator tool lets create presentations from a mind map: you can simply select the map parts you want to present, sequence your slides, and preview the presentation.
  • ConceptDraw MINDMAP provides wide capabilities of importing and exporting in various formats: Microsoft PowerPoint, Microsoft Word, MS Excel, Mindjet MindManager, image, HTML, PDF file.
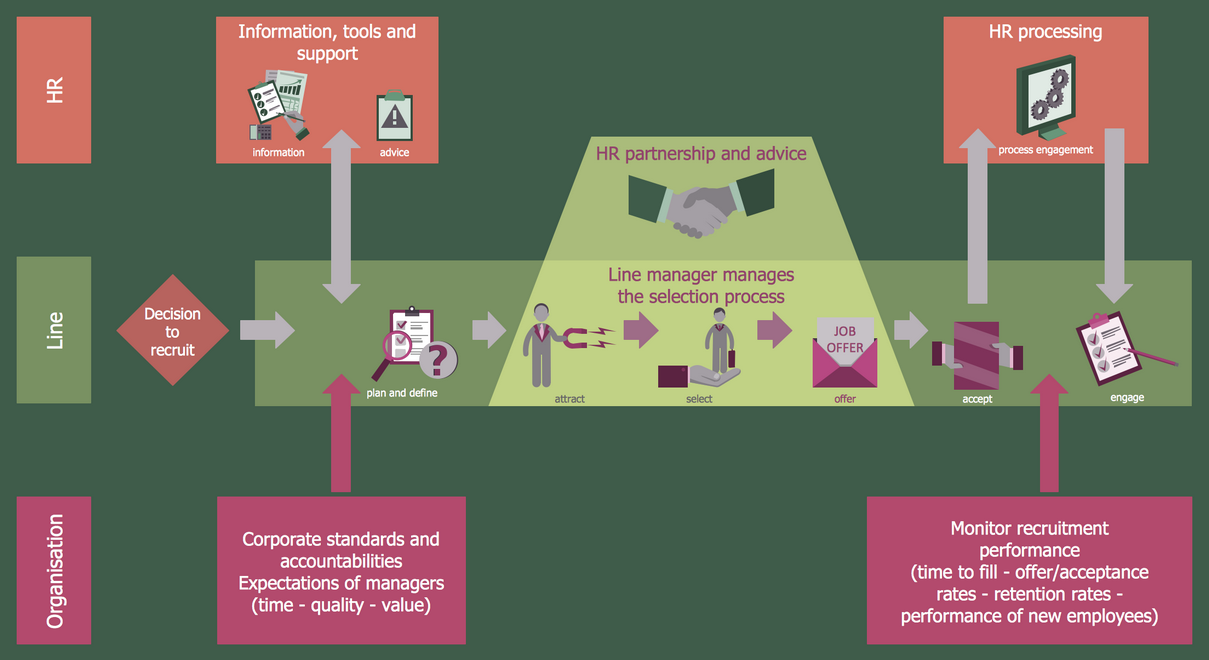


TEN RELATED HOW TO's:
Business process maps help you evaluate and manage quality in a work process chain, placing an emphasis on corporate performance and optimization. Business Mapping Software a versatile collection of libraries and templates, that allow you to create business process and SIPOC diagrams, using the Six Sigma methodology.Business Mapping Software *
Picture: Business Mapping Software
Related Solution:
Successful quality management implemented in a company of any size is a critical component of a company organization.What is a Quality Management *
Picture: What is a Quality Management
Related Solution:
Design efficiently the technical flow charts in ConceptDraw DIAGRAM software for various fields and provide ✔️ clarity, ✔️ accuracy, ✔️ usability, ✔️ simple communication, analysis, and improvementTechnical Flow Chart Example Design in ConceptDraw DIAGRAM
Picture: Technical Flow Chart Example
Related Solution:
Sales process engineering is a complex and labour-intensive process which requires a lot of time, efforts, and powerful software. We recommend to use the ConceptDraw DIAGRAM software enhanced with Sales Flowcharts solution from the Marketing area of ConceptDraw Solution Park. It gives the possibility to easy illustrate all sales process steps and their results.Sales Process Steps *
Picture: Sales Process Steps
Related Solution:
This sample shows the Spider Chart that represents the budget and spending for one organization and allows to compare them. The multivariate data are represented on the Spider Chart as a two-dimensional chart with four or more variables displayed on the axes that start in one point. The Spider Charts are used in the management, business and sport.Spider Chart Template *
Picture: Spider Chart Template
While creating flowcharts and process flow diagrams, you should use special objects to define different statements, so anyone aware of flowcharts can get your scheme right. There is a short and an extended list of basic flowchart symbols and their meaning. Basic flowchart symbols include terminator objects, rectangles for describing steps of a process, diamonds representing appearing conditions and questions and parallelograms to show incoming data. This diagram gives a general review of the standard symbols that are used when creating flowcharts and process flow diagrams. The practice of using a set of standard flowchart symbols was admitted in order to make flowcharts and other process flow diagrams created by any person properly understandable by other people. The flowchart symbols depict different kinds of actions and phases in a process. The sequence of the actions, and the relationships between them are shown by special lines and arrows. There are a large number of flowchart symbols. Which of them can be used in the particular diagram depends on its type. For instance, some symbols used in data flow diagrams usually are not used in the process flowcharts. Business process system use exactly these flowchart symbols.Basic Flowchart Symbols Meaning
Picture: Flowchart Symbols: Meaning and Examples
Related Solution:
MS Word →
PM Meeting makes preparing for meetings a quick task. Meetings become more efficient because of the ability to easily record results. Collaborative decisions made by the project team are captured as part of the meeting process and then distributed. This innovative process makes meetings more productive and keeps activities on track. Meeting notes can be easily distributed at a meeting's conclusion to all participants and stakeholders.MS Word *
Picture: MS Word
Related Solution:
This sample shows the Perceptual map. It was created in ConceptDraw DIAGRAM diagramming and vector drawing software using the Matrices Solution from the Marketing area of ConceptDraw Solution Park. Perception Mapping helps organizations measure and transform all aspects of their business, people and culture. Perception Mapping allows to represent the complex relationships graphically, helps identify potential problems of the organization and make the best decisions.Business Tools Perceptual Mapping *
Picture: Business Tools Perceptual Mapping
Related Solution:
Big and complex projects sometimes need some simplification of plans and schedules. That's why Program Evaluation and Review Technique was invented and first implemented in 1958. You can create PERT diagrams effortlessly with ConceptDraw DIAGRAM and share them with your colleagues. Program Evaluation Review Technique (PERT) is a method that is used to assess and analyze projects. PERT is a valuable tool for the project management practice. PERT gives an assessment and analysis of the time needed to the project completion. A PERT chart is a visual tool that delivers a graphical view of a project timeline. It is used to display the sequences and dependences of project tasks necessary to complete a project. ConceptDraw DIAGRAM delivers the possibility to build a PERT along with other diagrams applied to assist management process by using its Seven Management and Planning Tools solution.Program Evaluation and Review Technique <br>(PERT) with ConceptDraw DIAGRAM  *
Picture: Program Evaluation and Review Technique (PERT) with ConceptDraw DIAGRAM
Related Solution:
A flowchart is a simple but very functional tool when it comes to understanding a workflow or to removing unnecessary stages from a process. When drawing flowcharts, keep in mind that there are four common types of flowcharts, like document flowcharts and data flowcharts that show control over a data or document flow over a system. To show controls on a physical level, use system flowcharts. In addition, to show controls in a program, you can draw a program flowchart. This flowchart diagram represents the piece of an article editing process, that involves the author and editor. It was created using the Basic Flowchart notation that consists from the basic flowchart symbols. The start and the end of the process are indicated with "Terminator" symbols. The "Process" symbols show the action steps consisting from making edits and searching for a compromise, when the author does not agree with the suggestions of the editor. The "Process" symbol is the general symbol in process flowcharts. The "Decision" symbol indicates a branching in the process flow. There are two branches indicated by a Decision shape in the current flowchart (Yes/No, Disagree/Agree). This basic flowchart can be used as a repeating unit in the workflow diagram describing the working process of some editorial office.Types of Flowcharts *
Picture: Types of Flowcharts
Related Solution:
ConceptDraw
MINDMAP 16