Made with
ConceptDraw
DIAGRAM 18

Easy Flowchart Software

Flowchart is a type of chart gathering the shapes and symbols and describing a process with their use. The area of the Flowcharts applications is enormous — business, education, software development, engineering, and much more.

Flowchart design software is an application providing the specialized functionalities for creating Flow Charts and Graphs. The most effective and easiest way to design a Flowchart is to use an easy Flowchart software — ConceptDraw DIAGRAM. It is enhanced with the special Flowcharts solution from the Diagrams area of ConceptDraw Solution Park. This software allows designing as simple as complex processes in a moment. And even drawing multiple flowcharts simultaneously on the separate pages of one document or different ones is also possible.

Easy Flowchart Software

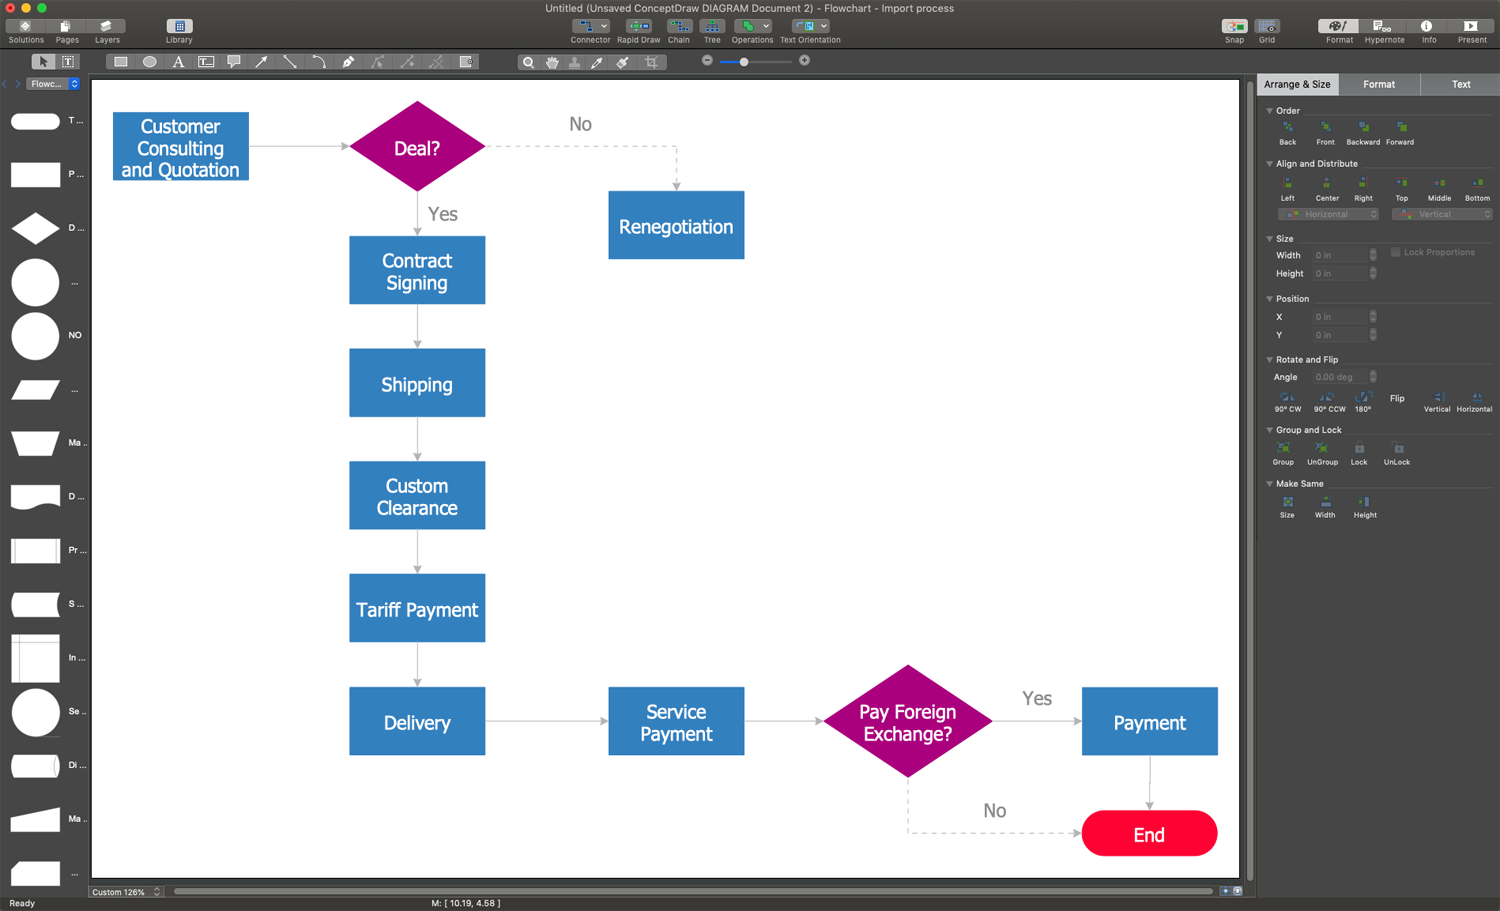
Example 1. Easy Flowchart Software - ConceptDraw DIAGRAM

Flowcharts solution is rich in the powerful drawing tools useful in Flowcharts design. These are three libraries with the predefined vector elements, a set of Flowchart samples, examples, and a Flowchart template. A variety of samples for different areas is included and shows wide opportunities for the solution use. All they are available from the ConceptDraw STORE. You can find one closest to your field of activity, open it, and use it as is or change something according to your modeled process. This will be just a new Flowchart – your own and professionally looking Cross-functional Flowchart Stages of Personnel Certification, Invoice Payment Process Flowchart, or some else.

Cross-Functional Flowchart - Order Processing

Example 2. Cross-Functional Flowchart - Order Processing

The following features make ConceptDraw DIAGRAM the easy Flowchart software:

  1. You don't need to be an artist to draw professional-looking diagrams in a few minutes.
  2. Large quantity of ready-to-use vector objects makes your drawing diagrams quick and simple.
  3. Great number of predesigned templates and samples give you a good start for your own diagrams.
  4. ConceptDraw DIAGRAM provides you the possibility to use the grid, rules, and guides. You can easily rotate, group, align, arrange the objects, use different fonts and colors to make your diagram exceptionally looking.
  5. All ConceptDraw DIAGRAM documents are vector graphic files and are available for reviewing, modifying, and converting to a variety of formats: image, HTML, PDF file, MS PowerPoint Presentation, Adobe Flash, MS Visio.
  6. Using ConceptDraw STORE you can navigate through ConceptDraw Solution Park, managing downloads and updates. You can access libraries, templates, and samples directly from the ConceptDraw STORE.
  7. If you have any questions, our free of charge support is always ready to come to your aid.


FOUR RELATED HOW TO's:
A flowchart is a powerful tool for examining processes. It helps improving processes a lot, as it becomes much easier to communicate between involved people, to identify potential problems and to optimize workflow. There are flowcharts of different shapes, sizes and types of flowchart vary from quite basic process flowcharts to complex program flowcharts. Nevertheless, all these diagrams use the same set of special symbols like arrows to connect blocks, parallelogram to show data receiving or rectangles for showing process steps. Basic flowcharts are used to represent a simple process algorithm. A basic flowchart notation consists of rectangles (business processes), arrows (the flow of information, documents, etc.). The same notation is used in items such as the "decision", which allow you to do the branching. To indicate the start of the entire business process and its termination can be used the "Terminator" element. The advantages of Basic Flowchart are simplicity and clarity. With it you can quickly describe the business process steps. Creating of Basic Flowchart does not require any special knowledge, as easily understand by employees with different levels of education and IQ.Types of Flowchart — Overview
Picture: Types of Flowchart: Comprehensive Overview
Related Solution:
There are many ways to define the flow of information within a system. Structured-systems analysis method often uses data flow diagrams to show data flow, data storages and data processing visualization. These diagrams are easy to develop and quite useful. Here is a dataflow diagram presenting an example of the manufacturing process flow. The oval process shapes represent a process that controls data within the current system. The process may produce data or make some action based on data. Data flows are represented by lines. They show the movement of information through the system. The direction of the data flow is depicted by the arrow. The external entities are shown by rectangles. They represent the external entities interacting with the system. The data store objects (unclosed rectangles) are used to show data bases participating in a process flow.Data Flow Diagram *
Picture: Data Flow Diagram
Related Solution:
This sample shows the Flowchart of the ACC general account creation. This Flowchart describes the Start point, the process of the handling the user requests and the End point – creating of the account. The shapes represent the subprocesses and the arrows between the shapes shows the sequence of the actions. This sample was created in ConceptDraw DIAGRAM diagramming and vector drawing software using the Flowcharts solution from the Diagrams area of ConceptDraw Solution Park.Examples of Flowchart *
Picture: Examples of Flowchart
Related Solution:
One of the most popular option helps to draw diagrams faster is pre-designed set of examples related to each kind of diagram. ConceptDraw DIAGRAM software extended with the Workflow Diagrams solution delivers a complete set of workflow process examples helps you to start making your own workflow faster.Workflow Process Example *
Picture: Workflow Process Example
Related Solution:
ConceptDraw
DIAGRAM 18