
Pic.1 Workflow diagram - Template.
The Workflow Diagrams solution extends ConceptDraw DIAGRAM software with samples, templates and library of vector stencils for drawing workflow diagrams. It represents the transferring of data, documents, and tasks during performance of a work process. Use workflow flowcharts to analyze the work processes, to show the path of the tasks, the responsible persons and the associated documents, to identify required resources, to optimize a workflow, and to discover its inherent weak points.
See also Samples:
TEN RELATED HOW TO's:
Do you need to draw a check order process flowchart?
Use the intuitive product - ConceptDraw.
Picture: Check Order Process Flowchart. Flowchart Examples
Related Solution:
There are many tools to manage a process or to illustrate an algorithm or a workflow. Flowcharting is one of those tools. However, it may be difficult to show complex processes that require multiple attributes or several people in a simple flowchart, so a cross-functional flowchart would be a solution for that situation. To create such flowchart, group processes and steps to labeled rows or columns, and divide those groups with horizontal or vertical parallel lines. It is worth mentioning that there are different types of cross-functional flowcharts, like opportunity or deployment flowchart.
This diagram shows a cross-functional flowchart that was made for a trading process. It contains 14 processes, distributed through 5 lines depicting the participants who interact with the process. Also there are connectors that show the data flow of information between processes. The cross-functional flowchart displays a detailed model of the trading process, as well as all participants in the process and how they interact with each other. The lines in the flowchart indicates the position, department and role of the trading process participants.
Picture: Cross-Functional Flowchart
Related Solution:
The first step to optimize a workflow is to get its visual depiction. Then you can analyse and optimize the workflow making changes to your workflow diagram. We recommend to use ConceptDraw DIAGRAM software extended with the Workflow Diagram solution to visualize and optimize your workflow. It allows you produce easy-to-change scalable vector graphic workflow and then present it to your team or partners.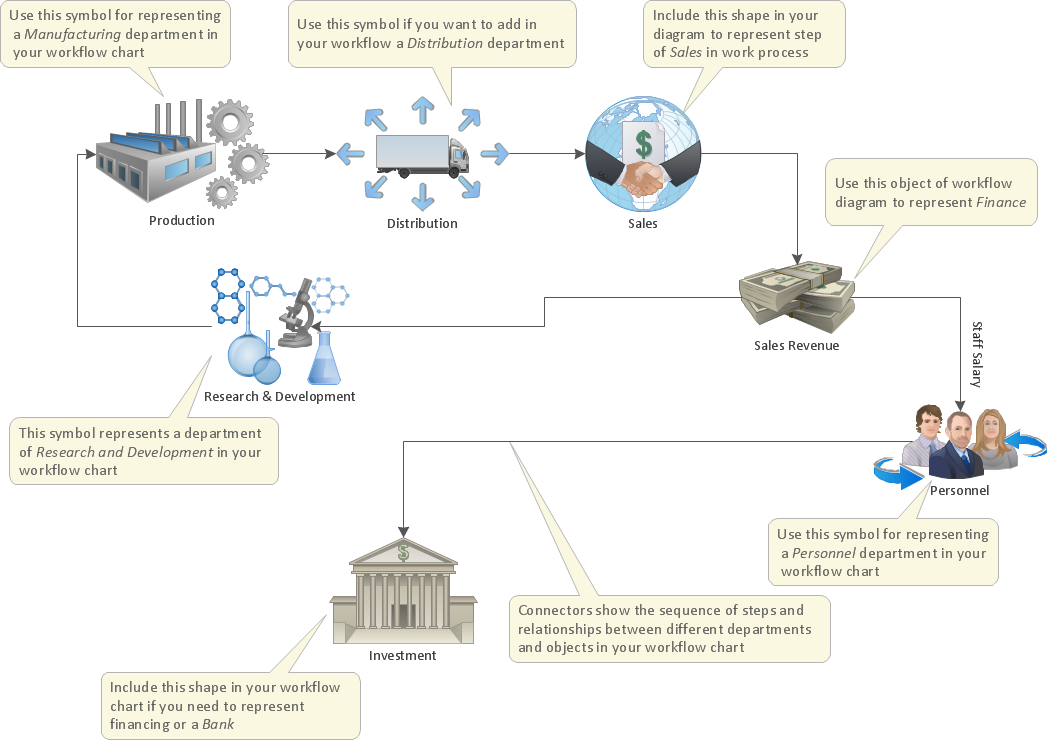
Picture: Optimize a Workflow
Related Solution:
If you need to describe some process, diagramming is a perfect tool for almost any imaginable purpose. The set of the most commonly used flow charts symbols is quite wide and includes symbols for operations, processes, data inputs and outputs. You can see the full list of all the symbols used for flowcharting in Flowcharts solution from Diagrams area in ConceptDraw Solution Park.
A flow chart is often used for visual representation of a sequential process flow. The flowchart approach to any process is to divide it into some sequential actions. What makes a flow chart so popular and clear to make out is the set of standard flowchart symbols that has the same reading independently from processes described with their applying. The current drawing represents the vector library containing the pack of standard flowchart symbols. This library is supplied with ConceptDraw Flowcharts solution.
Picture: Flow Chart Symbols
Related Solution:
When you need a drawing software to create a professional looking cross-functional charts, ConceptDraw with its Arrows10 Technology - is more than enough versatility to draw any type of diagram with any degree of complexity.
Use templates with process maps, diagrams, charts to get the drawing in minutes.
Picture: Cross-Functional Process Map Template
Use ConceptDraw DIAGRAM business diagramming and business graphics software for general diagramming purposes, it inludes tousands colored professional flowchart symbols, examples and samples which saves time when you prepare documents, professional presentations or make an explanation of process flow diagram.
Picture: Flow Chart Design — How to Design a Good Flowchart
Related Solution:
ConceptDraw DIAGRAM - workflow software extended with the Workflow Diagram solution provides a complete set of samples, templates and features help you to draw diagrams faster. A workflow software you use for drawing workflow diagrams and business process flow diagrams should provide a wide set of examples allows you get closer with workflow diagrams, learn symbols meaning, find appropriate layout and design, and then start drawing your own workflow diagram masterfully. Workflow diagrams used for orchestrating organizational processes between company departments and humans, so critical process diagrams used to train many people to interact must be clear and professional to convey an idea from a view. Thats a reason we created a lot workflow symbols and workflow icons collected them into special Workflow Diagram solution in ConceptDraw Solution Park.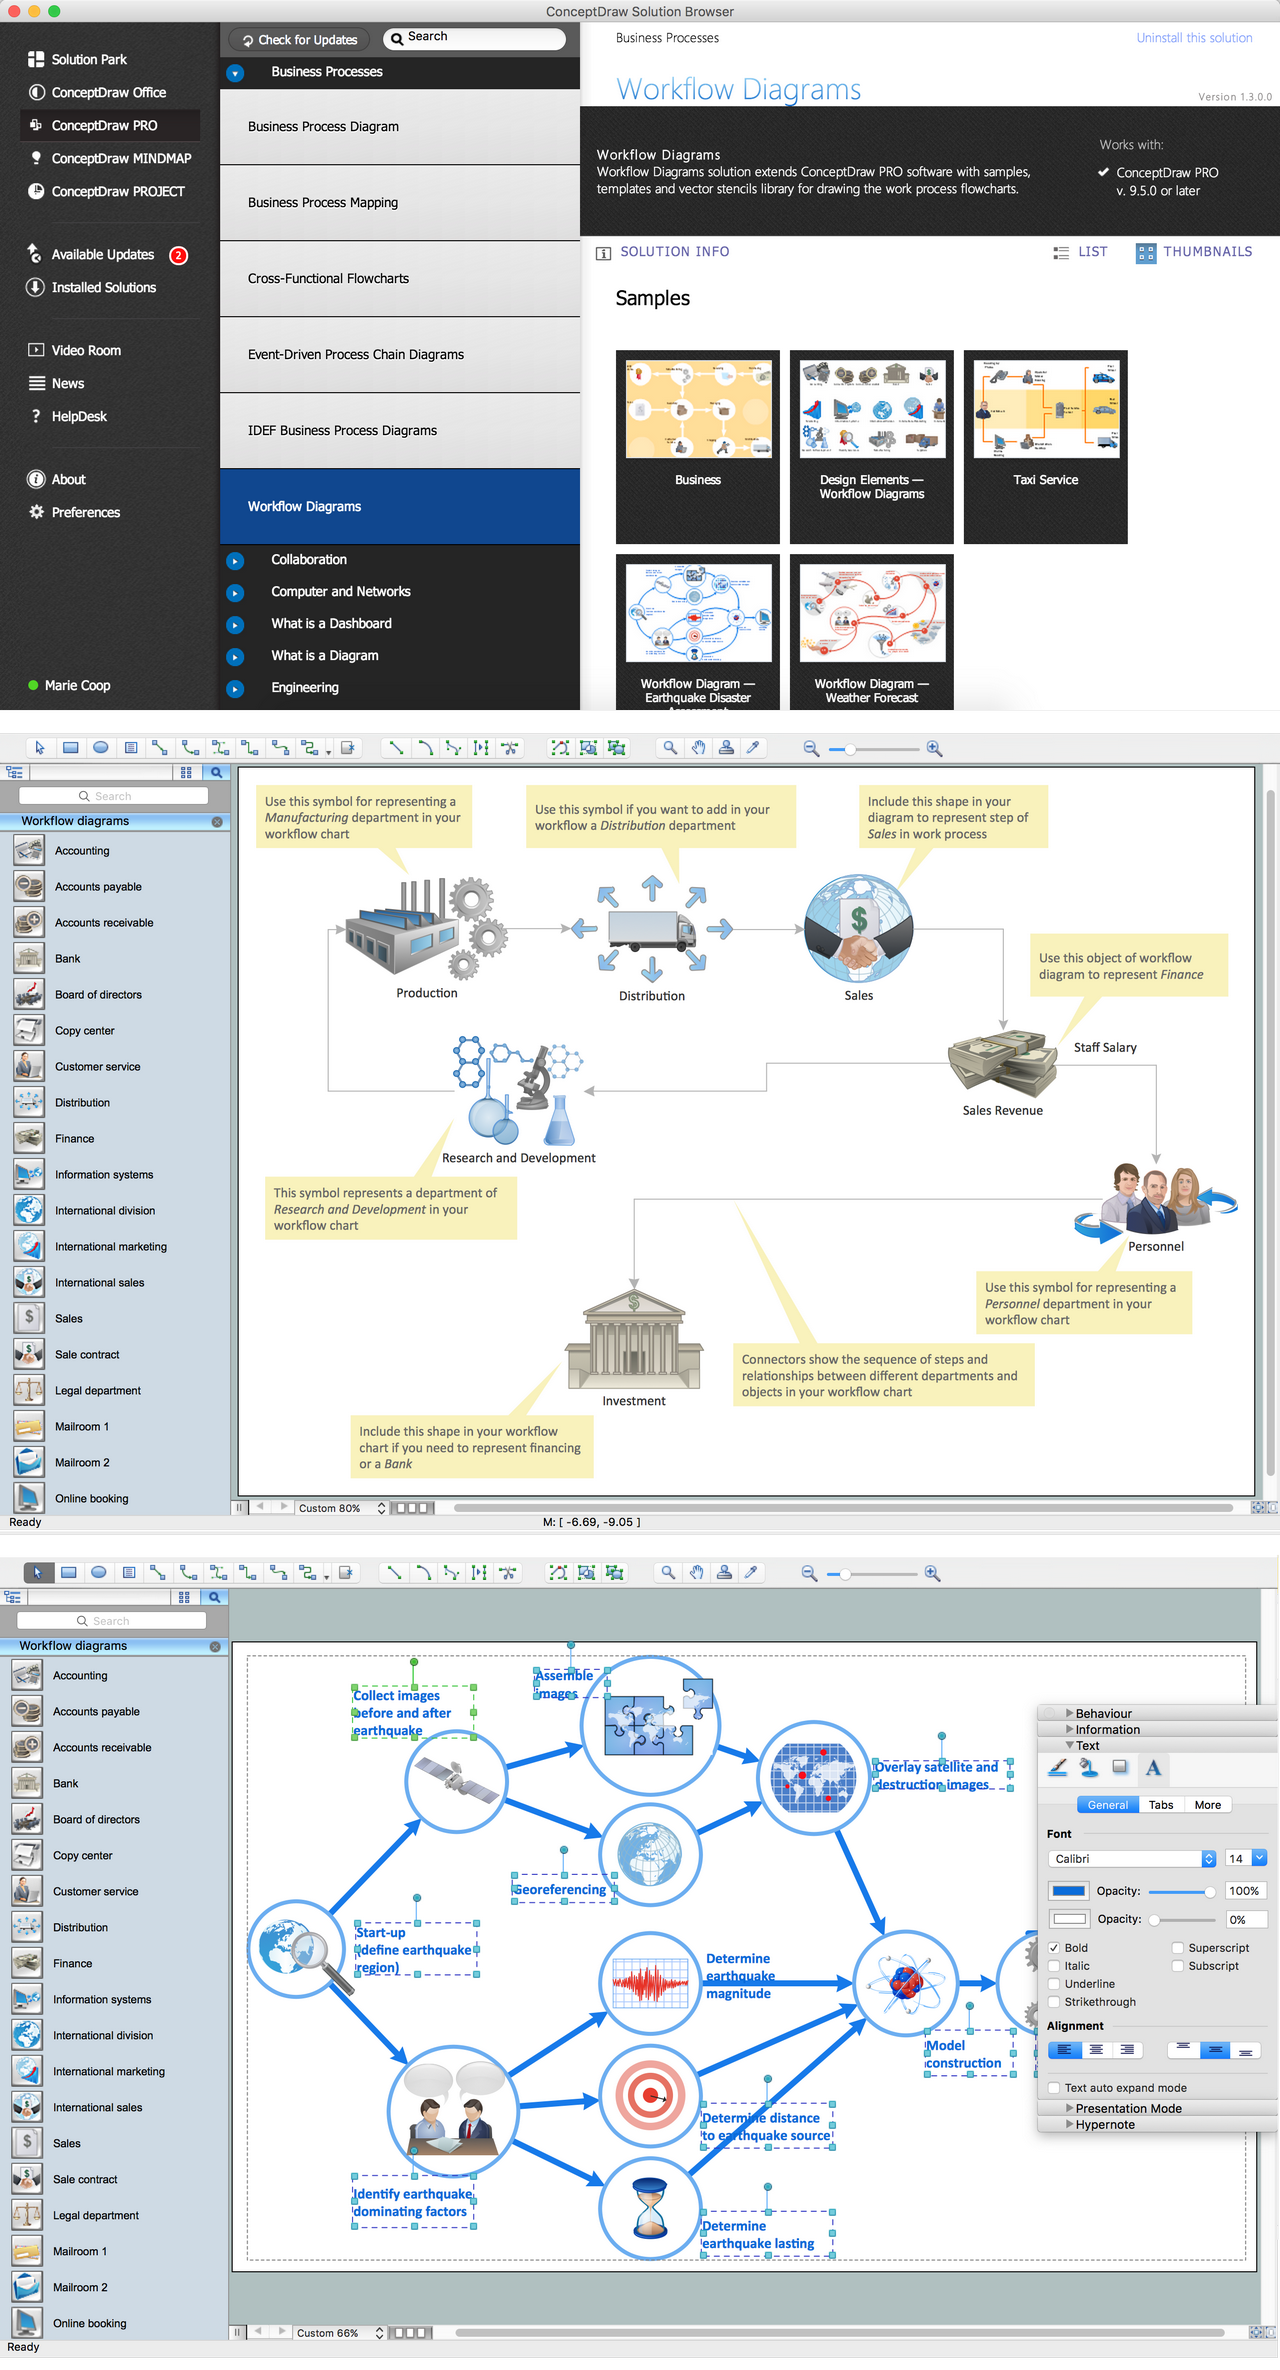
Picture: Workflow Diagram Examples
Related Solution:
This will let you create professional diagrams and charts using its simple RapidDraw option just in clicks. Take a look on a diagram you are looking for and create it fast and quickly.
Picture: Powerful Drawing Feature for Creating Professional Diagrams
ConceptDraw DIAGRAM the best business process modeling tools.contains pre-designed libraries and templates based on the BPMN 2.0 standard that allows to create of both simple and complex (nested) models of processes.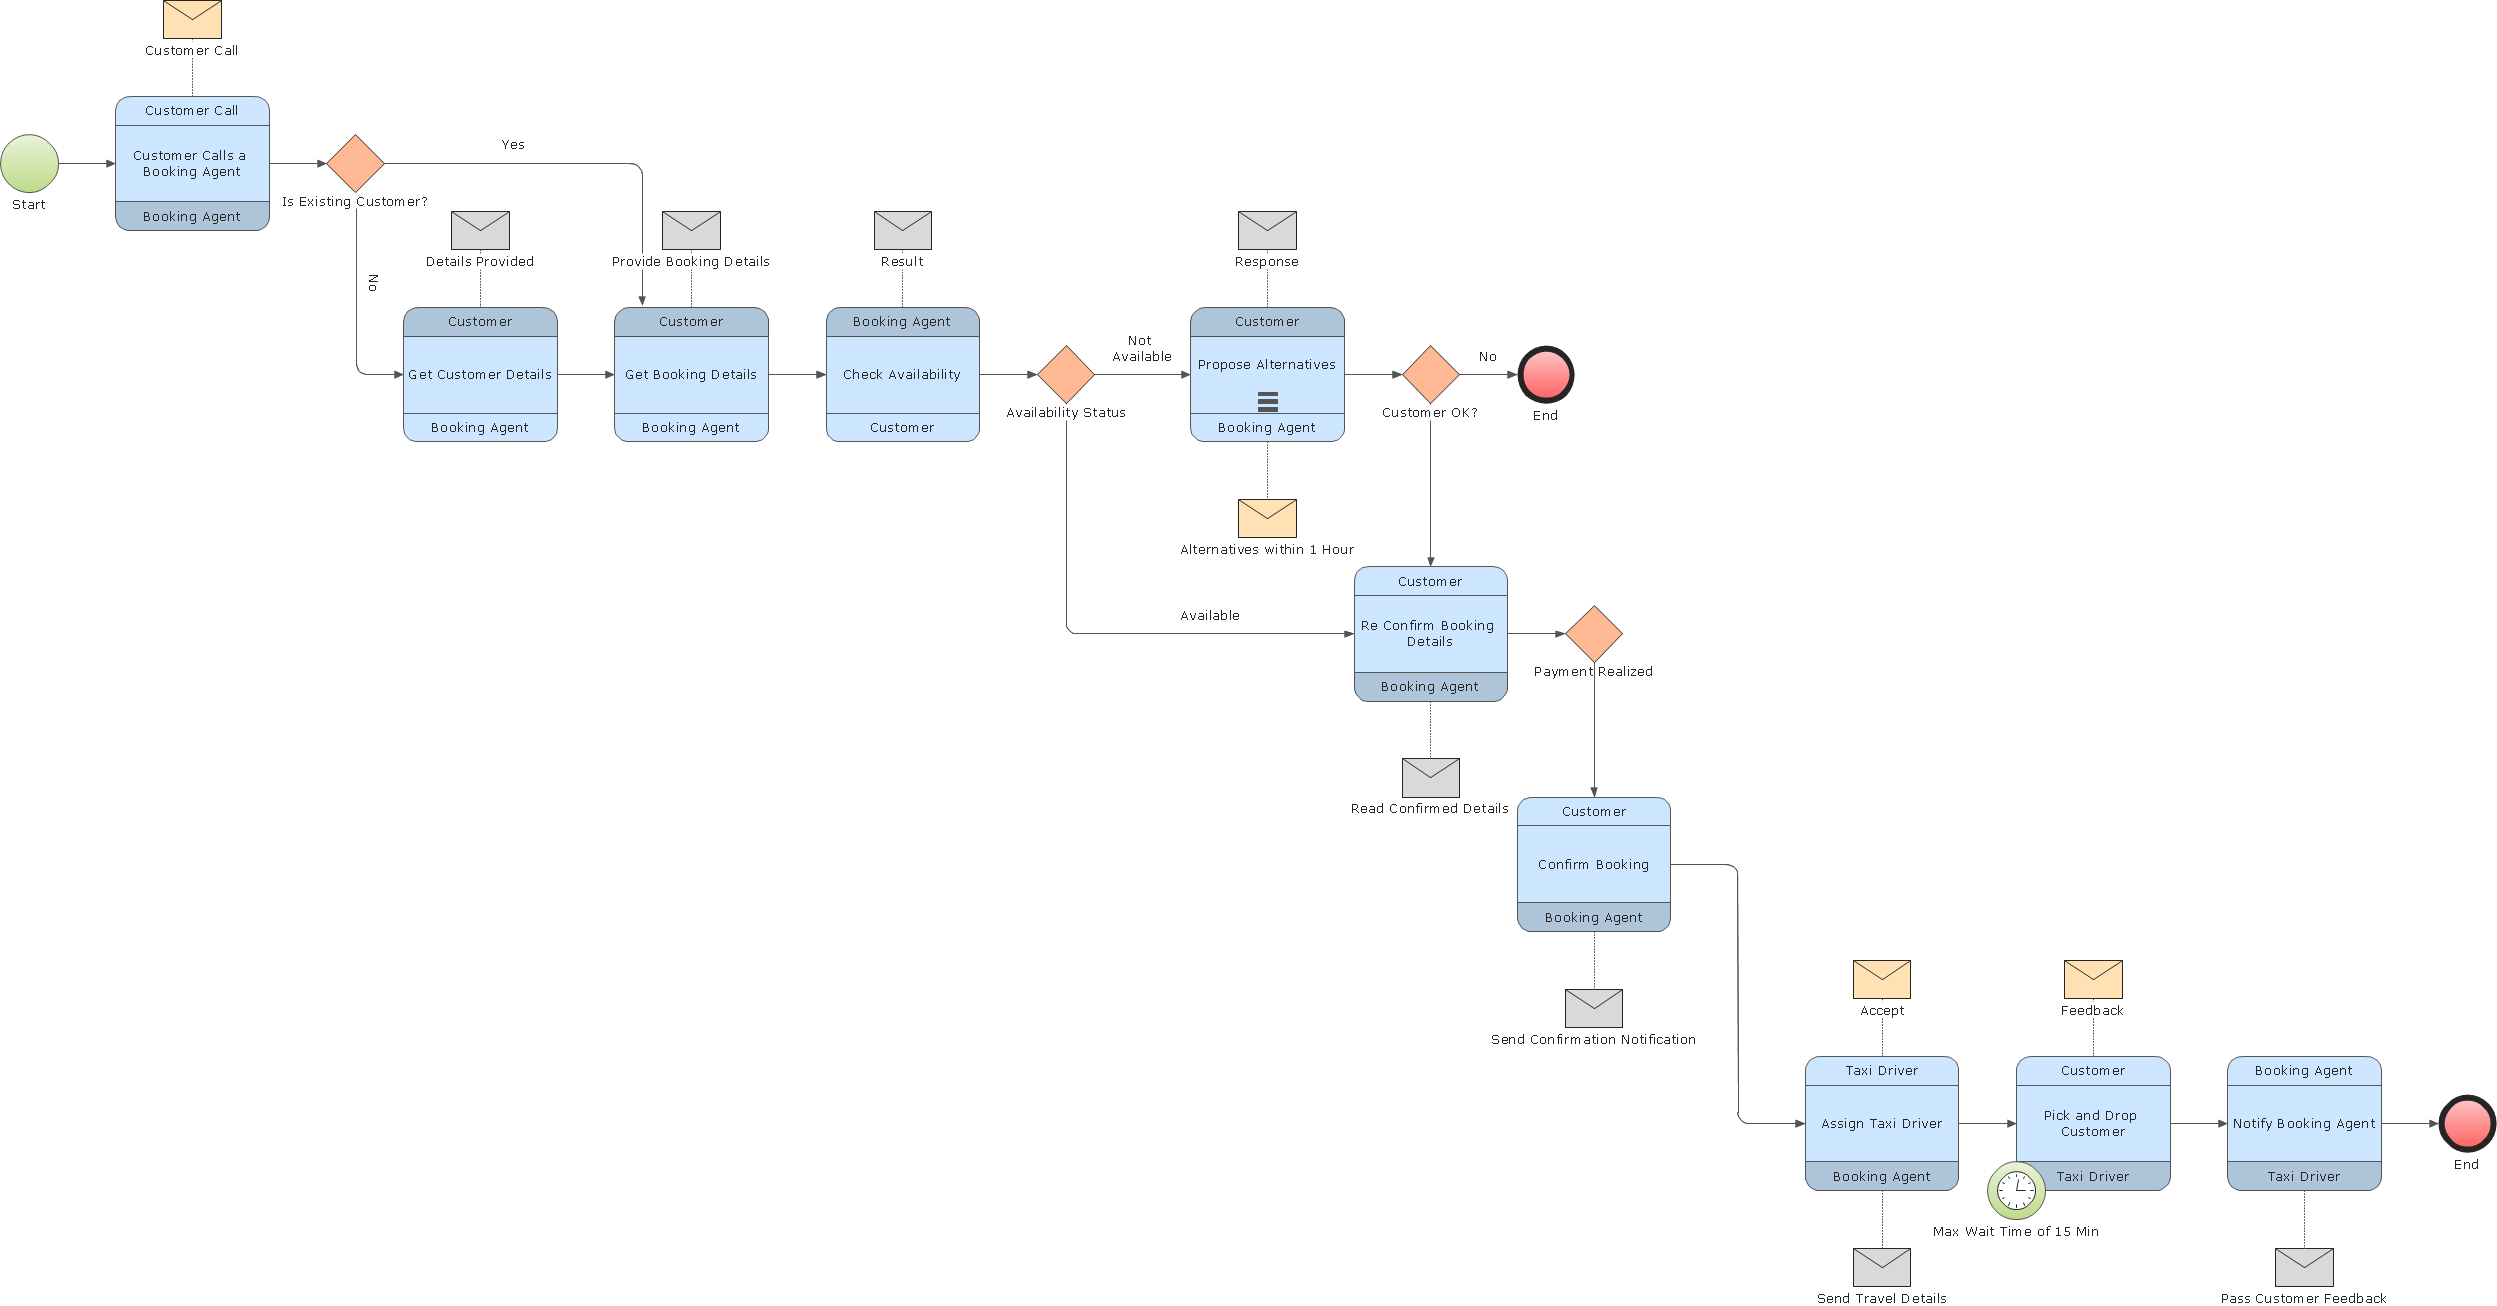
Picture: Business Process Modeling Tools
When you are connecting existing objects you can control the diagram structure by changing selection order.
This is how diagramming software should work. You are able to draw a diagram as quickly as the ideas come to you.
Picture: ConceptDraw Arrows10 Technology