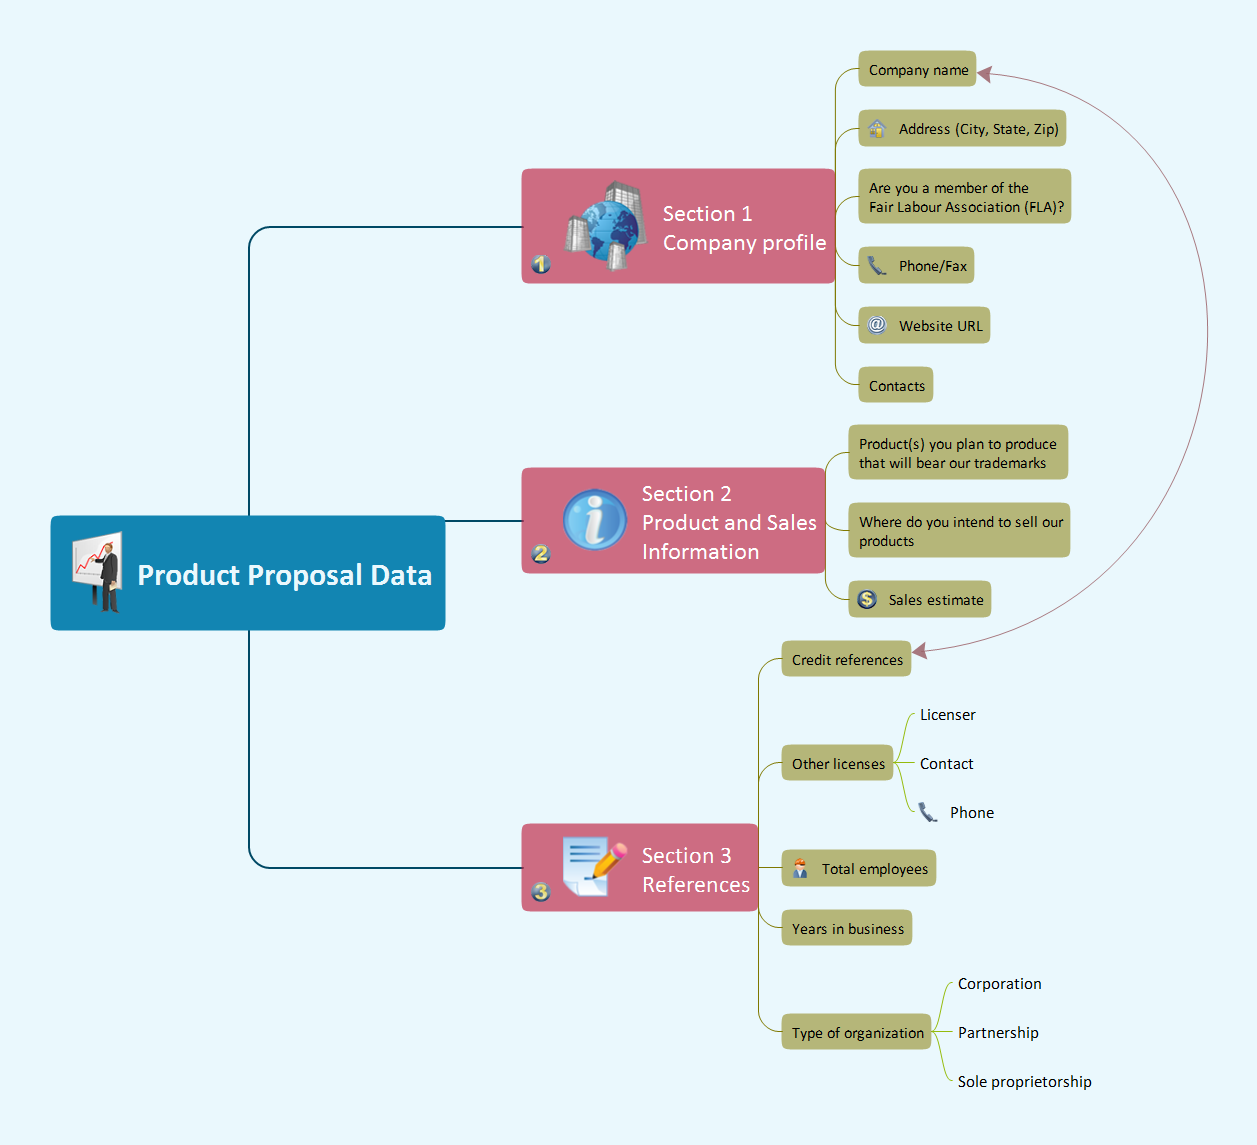
Sample 1. Mindmap presentation - Product proposal data.
Presentation Exchange solution extends ConceptDraw MINDMAP software with the ability to import presentations from Microsoft PowerPoint, as well as enhancing its existing presentation capabilities.
With the Presentation Exchange solution you can easily extract the content from a PowerPoint presentation to see how it all fits together in a single view. You can review slide content, see how the slides support one another, and refine the story.
TEN RELATED HOW TO's:
The growth–share matrix (BCG Matrix) was created by Bruce D. Henderson for the Boston Consulting Group in 1970 to help corporations to analyze their business units and to help the company allocate resources. How is it easy design the BCG Matrices in ConceptDraw DIAGRAM diagramming and vector drawing software supplied with unique Matrices Solution from the Marketing Area of ConceptDraw Solution Park.
Picture: BCG Matrix
Related Solution:
The Education Infographics are popular and effectively applied in the educational process. Now you don't need to be an artist to design colorful pictorial education infographics thanks to the unique drawing tools of Education Infographics Solution for ConceptDraw DIAGRAM diagramming and vector drawing software.
Picture: Education Infographics
Related Solution:
Collaboration software for small and medium business allows communicate with partners around the globe via Skype.
Picture: How to Collaborate in Business via Skype
Related Solution:
A block diagram is a diagram of a system in which the principal parts or functions are represented by blocks connected by lines that show the relationships of the blocks. ConceptDraw DIAGRAM diagramming and vector drawing software extended with Block Diagrams Solution from the Diagrams Area is a powerful Block Diagram Creator.
Picture: Block Diagram Creator
Related Solution:
For making successful PowerPoint presentations use advanced tool ConceptDraw MINDMAP.
Picture: How To Do A PowerPoint In Mind Map
Related Solution:
Everyone wants to be efficient. To succeed, try Mind Maps for Business - SWOT Analysis and enjoy the result. But be careful: it can be addictive!
ConceptDraw products and supported by SWOT and TOWS Matrix Diagrams solution forms a great tool for providing SWOT analysis. The solution contains mind map templates. By filling mind map templates, one can easily determine Strengths, Weaknesses, Opportunities, and Threats of the current business. Just a one click is needed to turn the SWOT mind map into a SWOT matrix. The SWOT diagram will be created in ConceptDraw DIAGRAM on the base of SWOT mind map.
Picture: Mind Maps for Business - SWOT Analysis
A Home Area Networks (HAN) is a type of local area network that is used in an individual home. The home computers can be connected together by twisted pair or by a wireless network. HAN facilitates the communication and interoperability among digital devices at the home, allows to easier access to the entertainments and increase the productivity, organize the home security.
This example was created in ConceptDraw DIAGRAM using the Computer and Networks Area of ConceptDraw Solution Park and shows the home network diagram.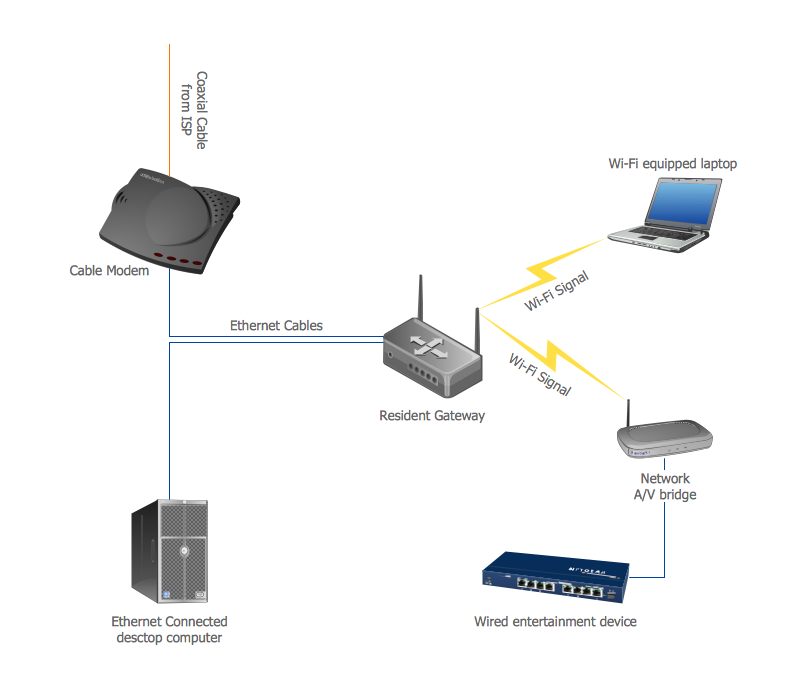
Picture: Home area networks (HAN). Computer and Network Examples
Related Solution:
The strategic balance is a combination of factors that can both positively and negatively affect the activity of the company. To know the factors that influence the organization success, managers should use SWOT matrix template that will define the potential inner strengths and weaknesses and potential external opportunities and threats. This matrix does not contain a ready solution, but allows to streamline all the available information.
This is a handy template of a SWOT matrix. It can serves as a visual guide for management students. To simplify the task, on the left and on the right we have added hints with examples of external and internal factors. This template one can found among numerous templates of SWOT and TOWS matrices that are included in the the eponymous solution by ConceptDraw Solution Park.
Picture: SWOT Matrix Template
Describing a workflow or approval process can take hours and be too complicated, especially since there are options to do it quickly and vividly. Diagrams called flowcharts replace long paragraphs of boring text and represent information in a graphic way. You can draw one on paper or you can use flowchart software to do it quickly and scalable. This kind of software is easy to use and you don’t need any special skills to start using it. In addition, there are a lot examples and predesigned templates on the Internet.
Flowcharts are a best tool for staking out a huge and complex process into some small readable parts. Surely, flowcharts can be drawn manually but the use of standard symbols that make it clear for a wide audience makes a software tool preferred for this task. The core for a successful flowchart is its simplicity. That is why often before beginning making flowchart through software, people draw the sketch on a piece of paper. Designing an effective flowchart means the combination of the data needed to be shown and the simplicity with which you depict it.
Picture: Flowchart Software: A Comprehensive Guide
Related Solution:
ConceptDraw PROJECT delivers a rich set of built-in functionalities and optional product extensions that support your daily workflow in time-saving and creative ways. This video lesson will teach you how to work with costs in your project document.
Picture: Project — Working With Costs