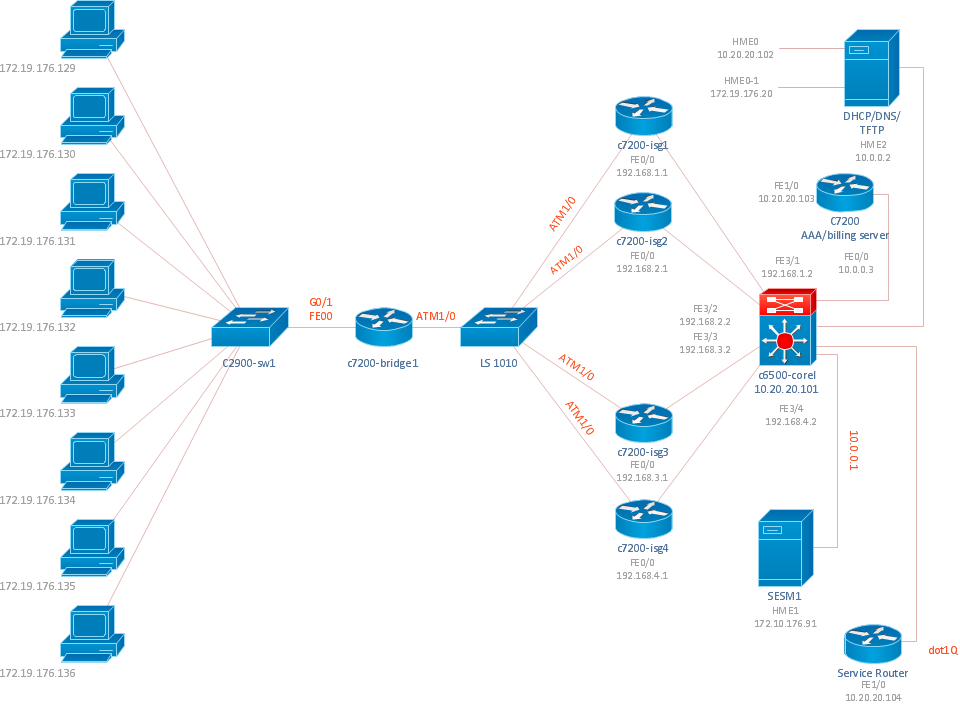
Sample 1. Cisco ISG network topology diagram.
ConceptDraw DIAGRAM diagramming software provides vector shapes and connector tools for quick and easy drawing diagrams for business, technology, science and education.
Use ConceptDraw DIAGRAM enhanced with solutions from ConceptDraw Solution Park to create diagrams to present and explain structures, process flows, logical relationships, networks, design schemes and other visually organized information and knowledge.
TEN RELATED HOW TO's:
How to draw a Process Flow Chart? It's very fast and easy to draw any Process Flow Chart using the tools of special Process Flow Chart software free.
Flowcharts Solution offers wide set of useful drawing tools, collection of samples, ready-to-use template and 2 libraries with predesigned vector elements which will help facilitate drawing process and designing professional looking process flow chart, process flow scheme, process block diagram, etc.
Picture: Process Flow Chart Software Free
Related Solution:
ConceptDraw solution Computer and Networks provides Interactive Voice Response samples, templates and library of 35 vector stencils for drawing the IVR network diagrams.
Use ConceptDraw DIAGRAM diagramming and vector drawing software enhanced with solution Computer and Networks to visualize the logical and physical structure of IVR systems for inbound and outbound call centers and voice mail systems.
Picture: Interactive Voice Response Network Diagram
Network infrastructure planning is a very important process in the network construction, and the share of time allocated to this within the scope of the entire project may reach 60-80%. A competent and thorough approach to planning contributes to the quick investment return, and also increases the reliability and flexibility of the final system, reducing the probability of additional costs related to the incorrect implementation.
Any planning begins with an analysis of the business requirements to the final system. Basic network parameters, which should be assessed are the scalability, accessibility, cost, speed and safety.
Speed and cost are often mistaken for the most important parameters, and the rest of the parameters aren't even remembered. This is not entirely correct. Initially, it is necessary to assess the business plans for the future, because sometimes it is more profitable to invest more money in the beginning. If the business is to develop, then, consequently, demands on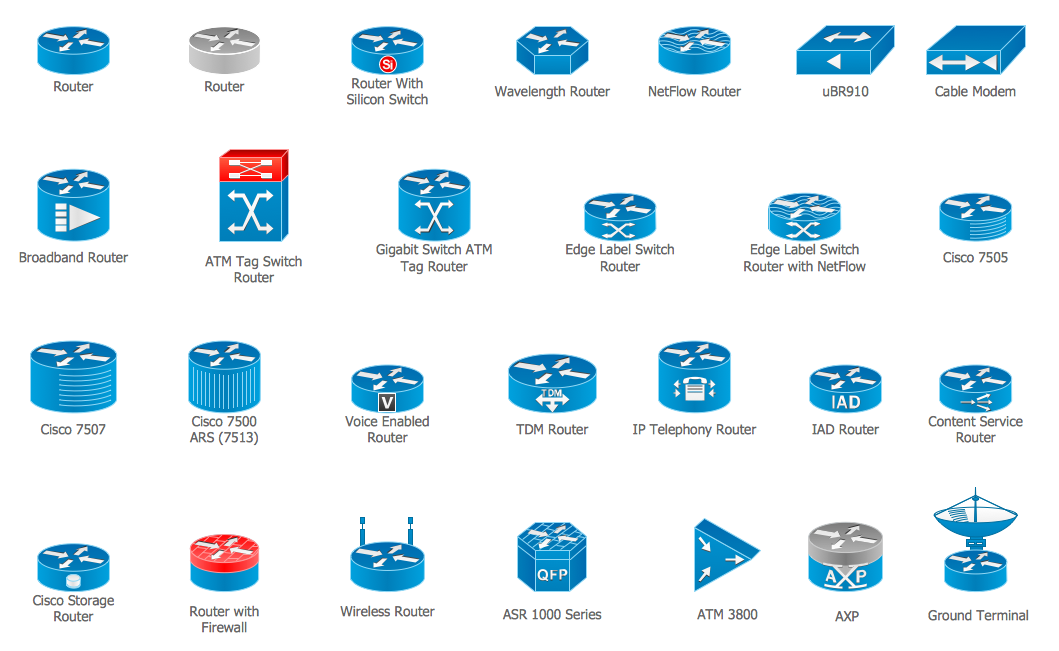
Picture: Cisco Routers. Cisco icons, shapes, stencils and symbols
Related Solution:
ConceptDraw DIAGRAM is new software for business and technical drawing. Powerful business drawing tools, extensive libraries with pre-drawn shapes, free samples of business drawings, technical drawings and flowcharts, support of many graphic formats enable users to visually develop their business drawings charts and diagrams in any combination of drawings, diagrams and flow charts.
Picture: ConceptDraw DIAGRAM The best Business Drawing Software
Related Solution:
Times when you had difficulties in searching for an appropriate software depending on your OS, had passed. If you still look for a great software to create flowcharts on Mac, here is the answer. ConceptDraw Pro is a great tool for creating diagrams, with tons of samples, libraries and tutorials.
Making flowchart diagram is the best way to represent a process as a sequence of steps. Flowcharting provides a simple way of organizing and representing data so that even complex and detailed processes become clear. That is why using a flowchart software tool is proven to be an ideal for structure and share an information on process workflow structure. This flow chart was created to depict the steps of certification process. This flow chart was created using ConceptDraw DIAGRAM software for Apple OS X. The Rapid Draw technology was used to create this flow chart. ConceptDraw DIAGRAM also supports popular Apple OS X features such as Quick Look, Full-Screen Mode, Version Browsing and Autosave. You can export your multi-page diagrams to SVG or graphic formats such as TIFF, JPEG, PNG and PDF.
Picture: Create Flow Chart on Mac: The Comprehensive Guide
Related Solution:
Electrical rotating machines, such as motors and generators, are vital assets for any power plant or large industrial company.
An electric motor is an electrical machine that converts electrical energy into mechanical energy. The reverse of this would be the conversion of mechanical energy into electrical energy and is done by an electric generator.
In normal motoring mode, most electric motors operate through the interaction between an electric motor's magnetic field and winding currents to generate force within the motor. In certain applications, such as in the transportation industry with traction motors, electric motors can operate in both motoring and generating or braking modes to also produce electrical energy from mechanical energy.
26 libraries of the Electrical Engineering Solution of ConceptDraw DIAGRAM make your electrical diagramming simple, efficient, and effective. You can simply and quickly drop the ready-to-use objects from libraries into your document to create the electrical diagram.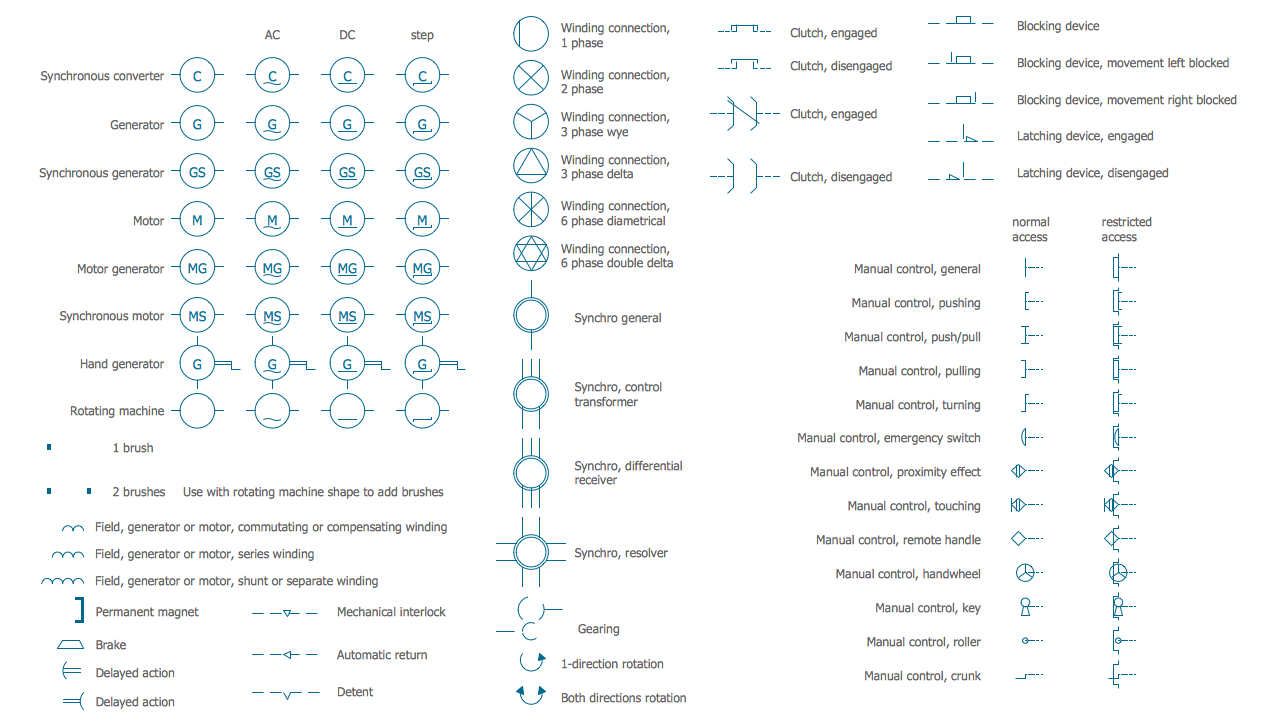
Picture: Electrical Symbols — Rotating Equipment
Related Solution:
Engineering students usually have huge amount of homework. Learning how to develop a technical drawing is one of the necessary skills. Luckily, at the present time, there’s no need to draw it on paper, because there a lot of software tools for it.
This drawing represents the Bearing symbols library, that is the part of the ConceptDraw Mechanical Engineering solution. Bearings are the important components of any movable mechanism. The function of bearing is to align, guide, and support the moving parts in any mechanical construction. Usually they are located between moving and stationary parts, it works as a connection point between them. Using Mechanical Engineering solution and ConceptDraw DIAGRAM one can effortlessly draw engineering diagrams of any complexity.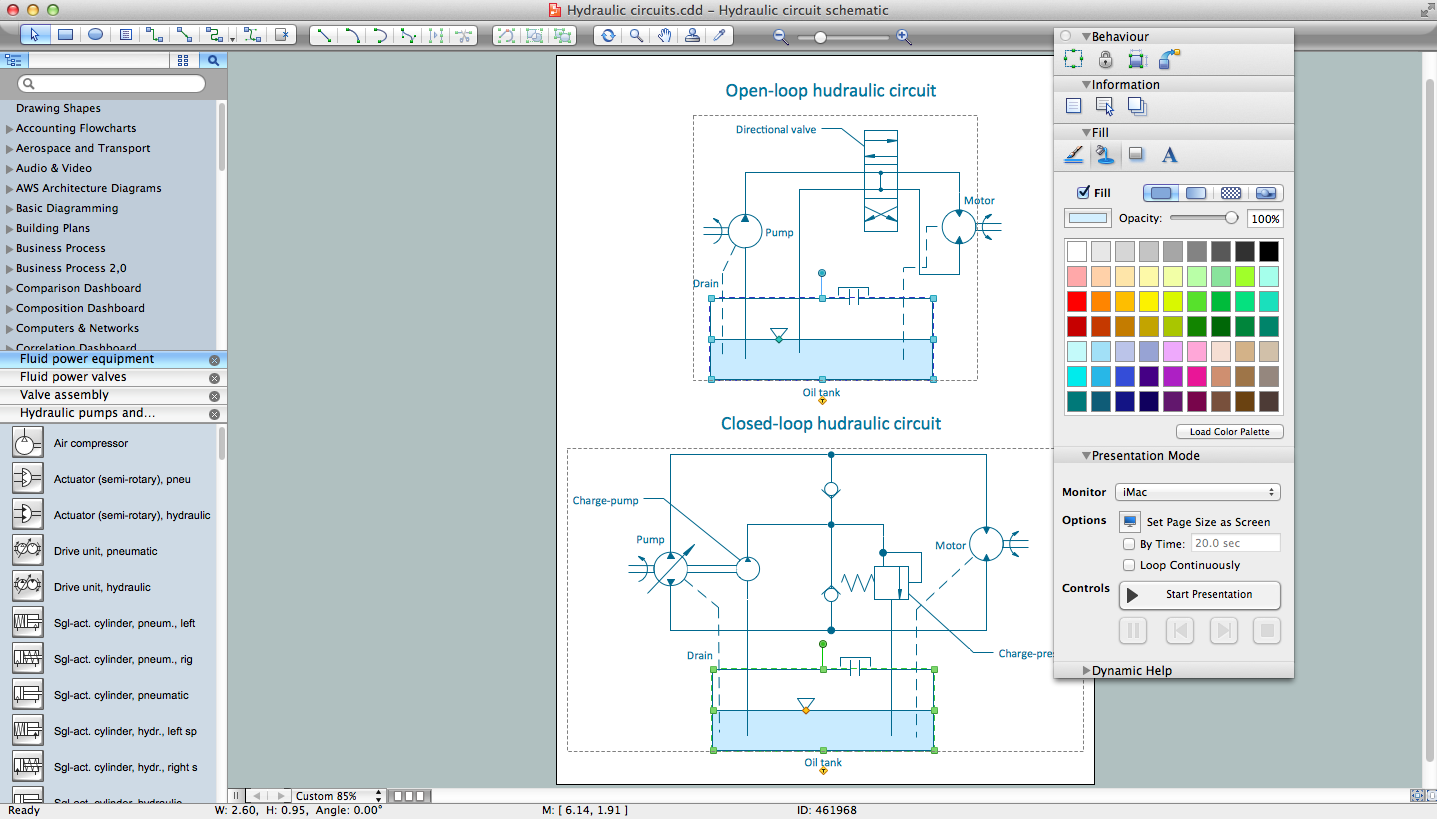
Picture: Technical Drawing Software
Related Solution:
This diagram represents the electrical floor plan. This is a common practice - to draw the electrical plan on the floor plan. The outlets, fixtures and other electrical equipment are depicted on the floor plan with special symbols. This drawing was created using the possibilities of ConceptDraw DIAGRAM as CAD software. Computer-aided design software is intended to replaces manual engineering drafting with an automated process. CAD software is used by engineers, architects, and others to make high-precision technical drawings and illustrations. CAD software allows technical specialists to develop, examine and manage various engineering projects.
It is almost impossible nowadays to imagine mechanical engineering without digital technologies. Finding a suitable CAD software for creating mechanic diagram and electrical diagram architectural designs can take a lot of time and effort. However, with ConceptDraw DIAGRAM you can create any diagram that you want and later convert it to the most popular graphic formats like.vsdx,.png,.pptx etc.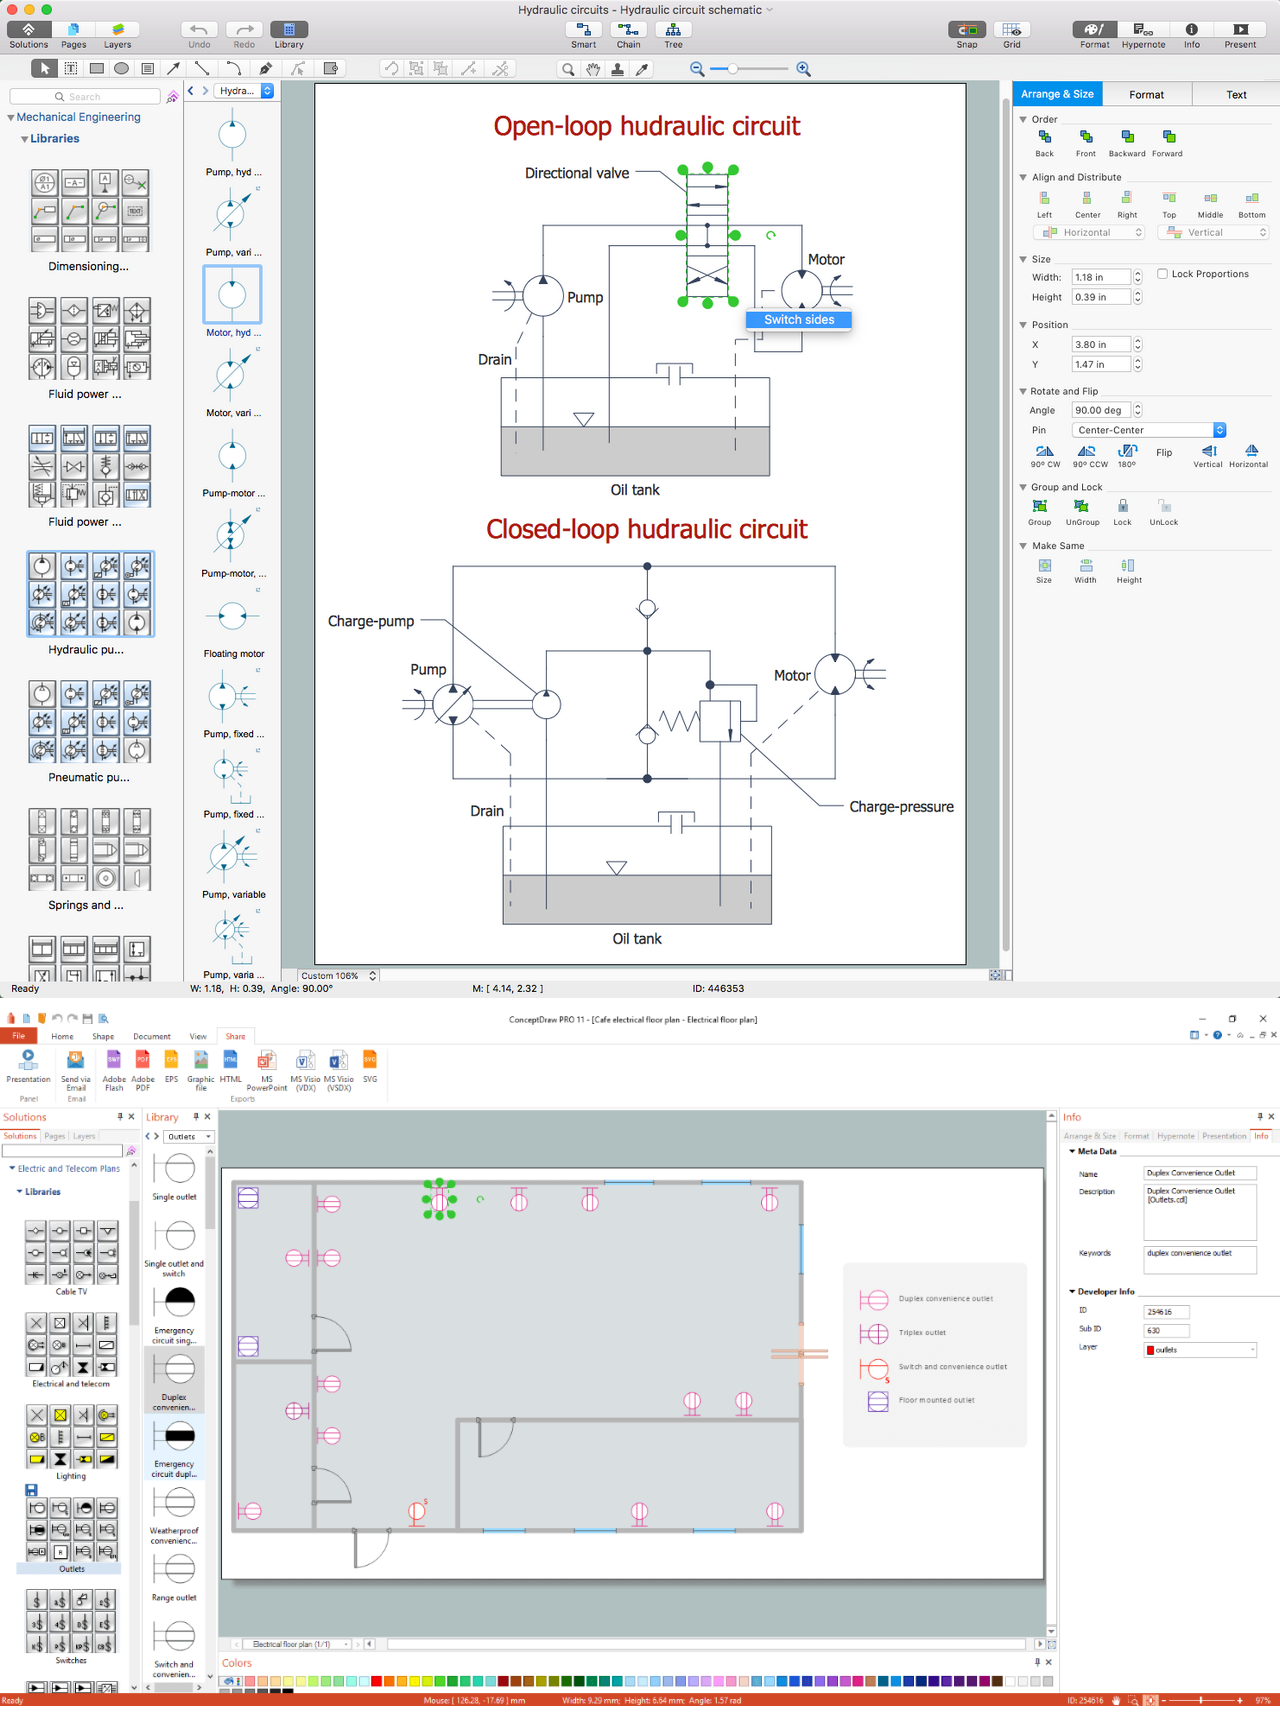
Picture: CAD Drawing Software for Making Mechanic Diagram and Electrical Diagram Architectural Designs
Related Solution:
Variable delay elements are often used to manipulate the rising or falling edges of the clock or any other signal in integrated circuits. Delay elements are also used in delay locked loops and in defining a time reference for the movement of data within those systems.
26 libraries of the Electrical Engineering Solution of ConceptDraw DIAGRAM make your electrical diagramming simple, efficient, and effective. You can simply and quickly drop the ready-to-use objects from libraries into your document to create the electrical diagram.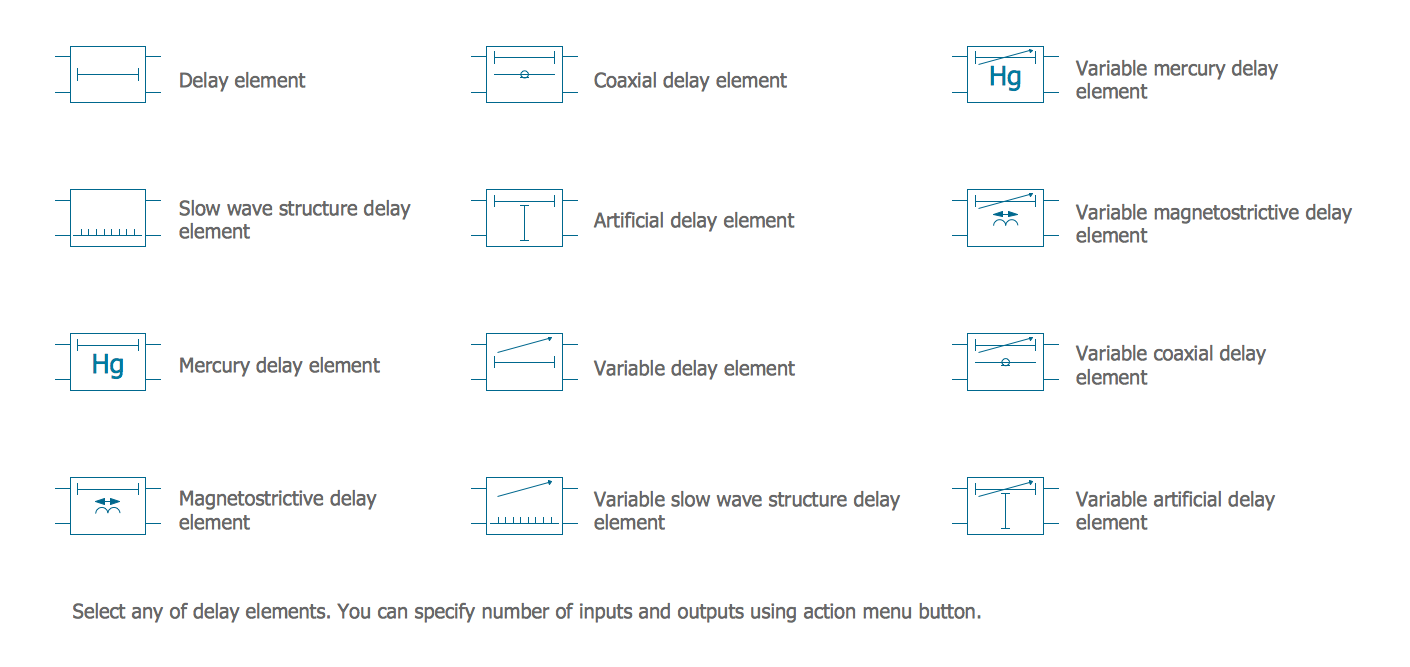
Picture: Electrical Symbols — Delay Elements
Related Solution:
If we divide computer networks by scale, we get several main categories. The smallest network is PAN, as it connects personal devices themselves, and as the number of users grows, a local area network can be recognized, and campus area networks (CAN) connects several local networks located within some area like a university or a corporation. Computers connected to CAN share public educational materials and list of CAN network examples includes such prestigious universities like Stanford and Carnegie Mellon.
This is an example of a computer network diagram created for a campus area network. It was created using using ConceptDraw solution for the Computer and Network diagramming. The specific of this sample campus network is its distribution. It is rather broad to embrace a big campus territory. This diagram can be applied as a template for designing custom area network topology diagram for a particular educational institution.
Picture: Campus Area Networks (CAN). Computer and Network Examples
Related Solution: