Electrical Symbols — Delay Elements
Variable delay elements are often used to manipulate the rising or falling edges of the clock or any other signal in integrated circuits. Delay elements are also used in delay locked loops and in defining a time reference for the movement of data within those systems.

Pic. 1. Delay Elements Library
ConceptDraw DIAGRAM is a powerful software for creating professional looking electrical diagram quick and easy. For this purpose you can use the Electrical Engineering solution from the "Engineering" area of ConceptDraw Solution Park.
Electrical Engineering Solution for ConceptDraw DIAGRAM provides the stencils libraries of ready-to-use predesigned 926 vector symbols, templates and samples that make your electrical drawing quick, easy and effective.
26 libraries of the Electrical Engineering Solution of ConceptDraw DIAGRAM make your electrical diagramming simple, efficient, and effective. You can simply and quickly drop the ready-to-use objects from libraries into your document to create the electrical diagram.

Pic. 2. Electrical Engineering symbols
Electrical diagram software will assist you in drawing your electrical diagrams with minimal effort and makes it very easy for beginners.
Electrical symbols and smart connectors help present your electrical drawings, electrical schematic, wiring diagrams and blue prints.
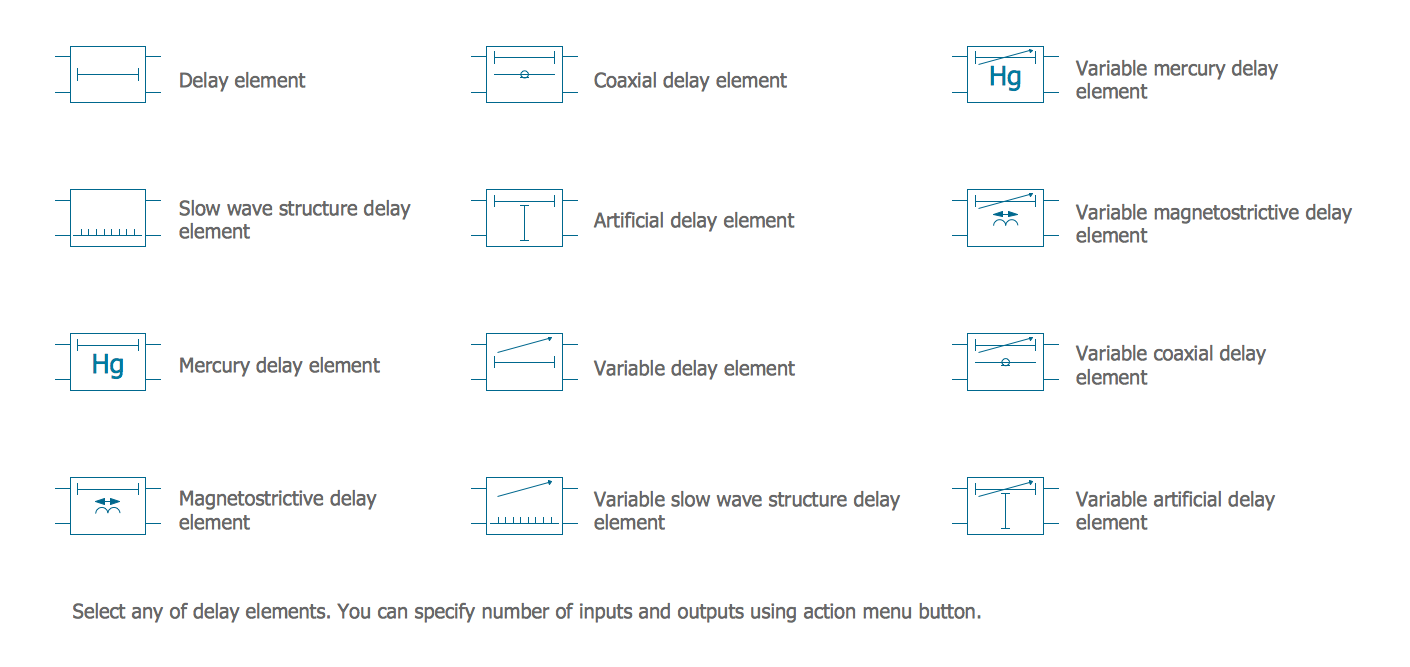
Pic. 3. Electrical Symbols — Delay Elements
Most of the electrical symbols can be changed in their appearance, styles and colors according to users' requirements. Electrical symbols are used to represent various electrical and electronic devices in a schematic diagram of an electrical or electronic circuit.
The following table lists some delay elements electrical symbols in our electrical diagram software.
| Symbol |
Meaning |
| Electrical Symbols — Delay Elements |
 |
Artificial delay element |
 |
Coaxial delay element |
 |
Delay element |
 |
Magnetostrictive delay element |
 |
Mercury delay element |
 |
Slow wave structure delay element |
 |
Variable artificial delay element |
 |
Variable coaxial delay element |
 |
Variable delay element |
 |
Variable magnetostrictive delay element |
 |
Variable mercury delay element |
 |
Variable slow wave structure delay element |
Various delay elements have been studied and the usage of the type delay elements depends on the application in which it is put into use various factors to be considered while choosing the delay elements.
How to Create an Electrical Diagram Using Delay Elements Library
- Open ConceptDraw DIAGRAM new document page.
- Select libraries from Electrical Engineering section.

- Delay elements library contains objects, identified by a blue tile in the library pane. Such objects can be edited by using the Action button menu. To open the menu select an object and click the
 button in the upper right corner of the object.

- Select the Smart Connector tool
 . To connect elements using this tool, drag the connector from one connect dot to another.You can use Layers to place connections on different layers.

Pic. 4. Result — Shunt Capacitor Delay Element
This sample shows the basic circuit of using a shunt capacitor. In this circuit, M2 acts as a capacitor. Transistor M1 controls the charging and discharging current to the M2 from the NOR gate. The M1 gate voltage, Vctrl, controls the (dis)charge current. As a consequence, the NOR gate delay can be controlled.
TEN RELATED HOW TO's:
A Process Flow Diagram (PFD) is a diagram which shows the relationships between the main components in a system. Process Flow Diagrams are widely used by engineers in chemical and process engineering, they allows to indicate the general flow of plant process streams and equipment, helps to design the petroleum refineries, petrochemical and chemical plants, natural gas processing plants, and many other industrial facilities.
ConceptDraw DIAGRAM diagramming and vector drawing software extended with powerful tools of Flowcharts Solution from the Diagrams Area of ConceptDraw Solution Park is effective for drawing: Process Flow Diagram, Flow Process Diagram, Business Process Flow Diagrams.
Picture: Process Flow Diagram
Related Solution:
Chemical and Process Engineering solution contains variety predesigned process flow diagram elements relating to instrumentation, containers, piping and distribution necessary for chemical engineering, and can be used to map out chemical processes or easy creating various Chemical and Process Flow Diagrams in ConceptDraw DIAGRAM.
Picture: Process Flow Diagram Symbols
Related Solution:
ConceptDraw DIAGRAM software supplied with HR Flowcharts Solution can effectively help in labour-intensive process of human resource development.
Picture: Human Resource Development
Related Solution:
A transistor is a semiconductor device used to amplify or switch electronic signals and electrical power. It is composed of semiconductor material usually with at least three terminals for connection to an external circuit. A voltage or current applied to one pair of the transistor's terminals changes the current through another pair of terminals. Because the controlled (output) power can be higher than the controlling (input) power, a transistor can amplify a signal. Today, some transistors are packaged individually, but many more are found embedded in integrated circuits.
26 libraries of the Electrical Engineering Solution of ConceptDraw DIAGRAM make your electrical diagramming simple, efficient, and effective. You can simply and quickly drop the ready-to-use objects from libraries into your document to create the electrical diagram.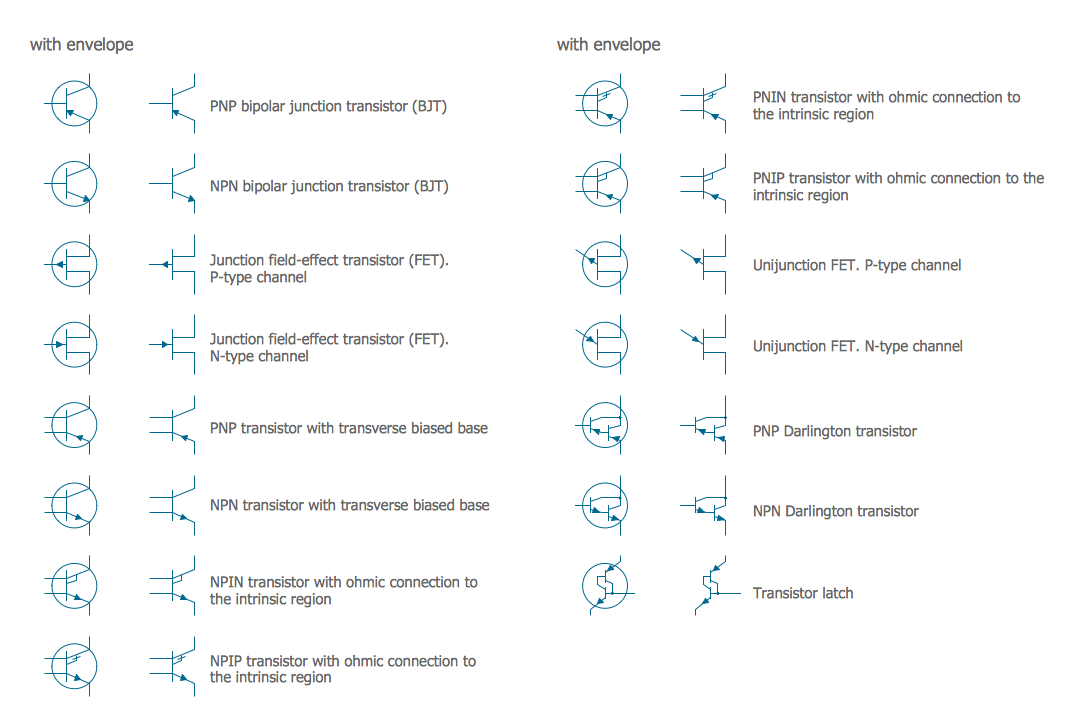
Picture: Electrical Symbols — Transistors
Related Solution:
Rack Diagrams visualize the rack mounting of computer and network equipment as the drawing of frontal view of the rack with equipment installed. They are used for choosing the equipment or racks to buy, and help to organize equipment on the racks virtually, without the real installation.
Network Diagramming Software - ConceptDraw DIAGRAM is perfect for software designers and software developers who need to draw Rack Diagrams._Win_Mac.png)
Picture: Network Diagramming Software for DesignRack Diagrams
Related Solution:
When moving to a new apartment it is always pleasure to develop an interior design project. Nevertheless, another important part that should not be forgotten is the piping plan, because wrong piping system might ruin all the renovation. So, to avoid such problems, a stress analysis is performed.
Plumbing and piping plans should be created for any premises. They are used to trace location of pipes, fixtures and valves in the house. This diagram presents a set of certified piping plan symbols for drawing plumbing and piping floor plans, diagrams and other technical drawings. Applying standard symbols when creating a piping plan is very important for creating a valid piping plan included into the building documentation pack. It is essential for any professional to be able to read and properly interpreted any piping plan.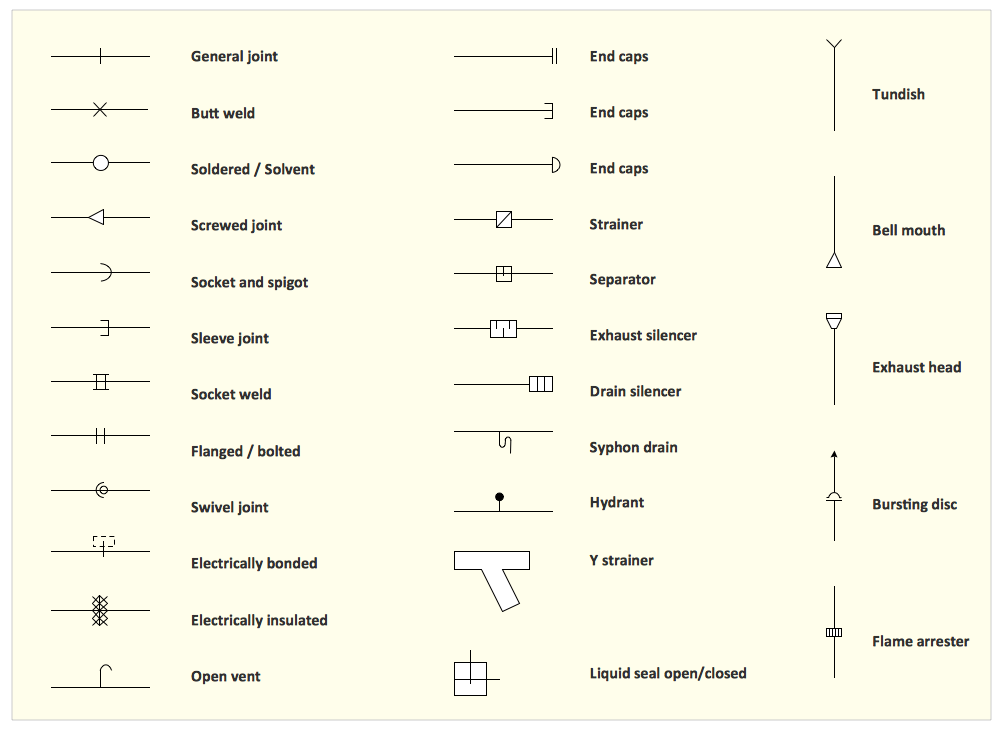
Picture: Interior Design. Piping Plan — Design Elements
Related Solution:
Use Case Diagram Taxi Service UML. This sample was created in ConceptDraw DIAGRAM diagramming and vector drawing software using the UML Use Case Diagram library of the Rapid UML Solution from the Software Development area of ConceptDraw Solution Park.
This sample shows the work of the taxi service and is used by taxi stations, by airports, in the tourism field and delivery service.
Picture: UML Block Diagram
Related Solution:
The engineering diagrams produced with ConceptDraw DIAGRAM are vector graphic documents and are available for reviewing, modifying, and converting to a variety of formats (image, HTML, PDF file, MS PowerPoint Presentation, Adobe Flash or MS Visio XML).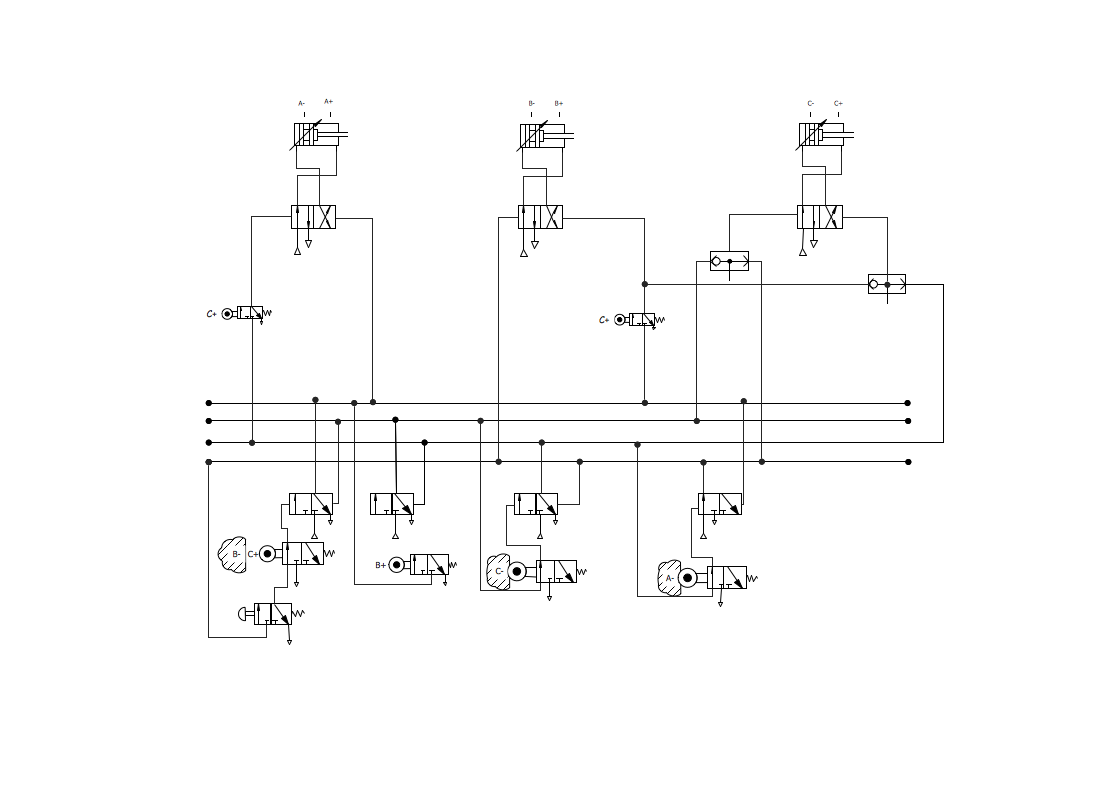
Picture: Making Mechanical Diagram
A network diagram represents the set of computers and network devices and the connections among them. This scheme can be developed for any institution or establishment. To illustrate this concept let’s take for example, a hotel network topology diagram or a school network diagram. These diagrams depict access points, servers, workstations, firewalls and another equipment needed to provide a network.
On this masterpiece drawing one will see a simple scheme a of connecting computers together. Such form of connecting can be applied for a hotel, guest house, bungalow, hut or something else. This diagram shows the images of the real LAN components. So, it represents a physical category of a network construction. It looks similar to a star - so this network configuration is named a star topology. The typical feature of this construction is a center point - usually it is hub, or router. The rays of this star means network connections. Computers, peripherals and other network details are placed on the ends of the star rays.
Picture: Hotel Network Topology Diagram
Related Solution:
If you need to describe some process, diagramming is a perfect tool for almost any imaginable purpose. The set of the most commonly used flow charts symbols is quite wide and includes symbols for operations, processes, data inputs and outputs. You can see the full list of all the symbols used for flowcharting in Flowcharts solution from Diagrams area in ConceptDraw Solution Park.
A flow chart is often used for visual representation of a sequential process flow. The flowchart approach to any process is to divide it into some sequential actions. What makes a flow chart so popular and clear to make out is the set of standard flowchart symbols that has the same reading independently from processes described with their applying. The current drawing represents the vector library containing the pack of standard flowchart symbols. This library is supplied with ConceptDraw Flowcharts solution.
Picture: Flow Chart Symbols
Related Solution:


