Example 1. Making Mechanical Diagram
Use the ready-to-use predesigned objects, templates and samples of the Engineering solution for ConceptDraw DIAGRAM to create your own engineering diagrams of any complexity quick and easy.
The engineering diagrams produced with ConceptDraw DIAGRAM are vector graphic documents and are available for reviewing, modifying, and converting to a variety of formats (image, HTML, PDF file, MS PowerPoint Presentation, Adobe Flash or MS Visio).
TEN RELATED HOW TO's:
Use Case Diagrams technology. IDEF3 Standard is intended for description and further analysis of technological processes of an enterprise. Using IDEF3 standard it is possible to examine and model scenarios of technological processes.
Picture: IDEF3 Standard
When describing any computer network, we imagine a set of devices and nodes, arranged in some way. Talking about network structures, we should distinguish physical and logical network topologies, as physical topology is about devices location and logical topology illustrates data flow. In the same time, they do not have to match, and some devices, such as repeaters, may have a physical star layout, but a bus logical topology.
There are two main types of computer network topologies: Physical topology that show the physical organization of a network - equipment and types of connections. Star network topology involves a set of devices that is connected to a single hub (router). Ring network topology means that, devices connected according this topology have two connections, connecting with nearby devices to make a loop. Bus network topology is the topology presented at the current diagram. It is similar to a ring topology. The difference is that data moves up and down a linear connection, copying itself where network equipment works as bus-stations along the way. This network topology can be used for small network, or when adding an extra device into a network.
Picture: Network Topologies
Related Solution:
The EPC diagram shows various business processes in terms of work flows.
Event-Driven Process chain Diagrams for improvement throughout an organisation.
ConceptDraw DIAGRAM - software that reduces the time needed to create a business process model and is great business process improvement tools.
Picture: The Best Tool for Business Process Modeling
Related Solution:
An integrated circuit (IC) is a chip or microchip that consists of a substrate created from semiconductor material and thousands or millions of tiny electronic components installed on it. ConceptDraw DIAGRAM software with included Digital Electronics solution allows you to choose from an enormous number of vector electrical symbols, integrated circuits, logic gates, connections, flip flop symbols. Collection of the pre-made symbols and also an included set of professionally designed samples are useful to create Integrated circuit schematics of various kinds in minutes.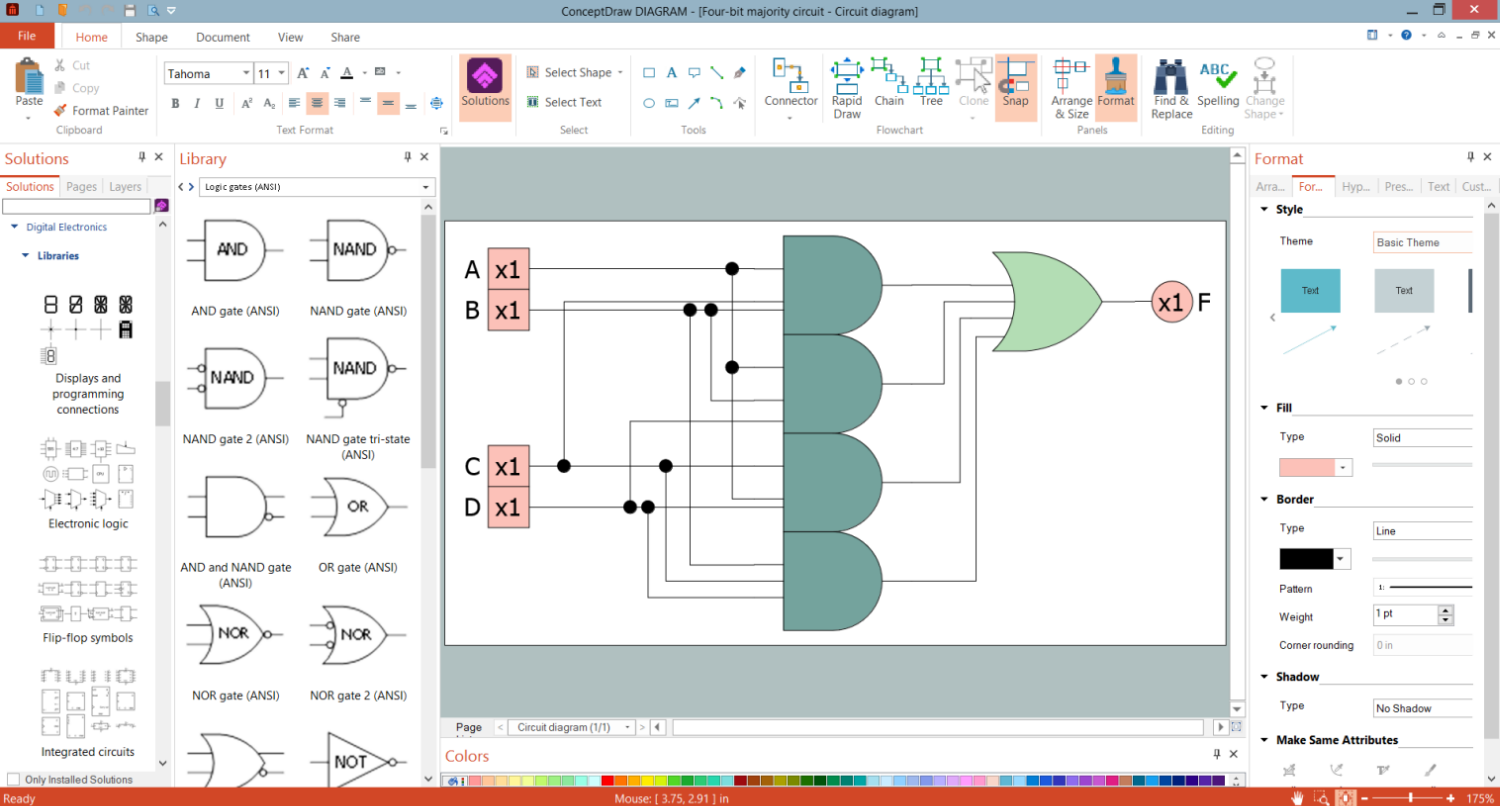
Picture: Integrated Circuit
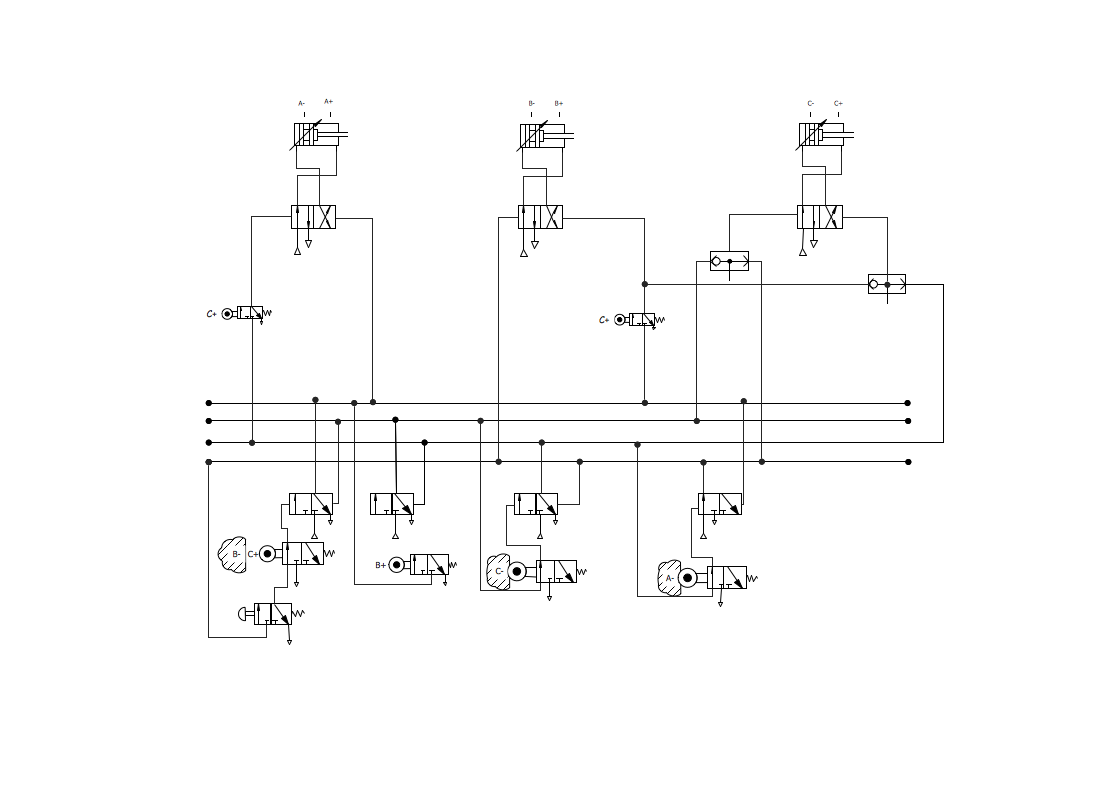
You need design Electrical Schematic and dream to find the useful tools to draw it quick and easy? ConceptDraw DIAGRAM offers the unique Electrical Engineering Solution from the Industrial Engineering Area which will effectively help you!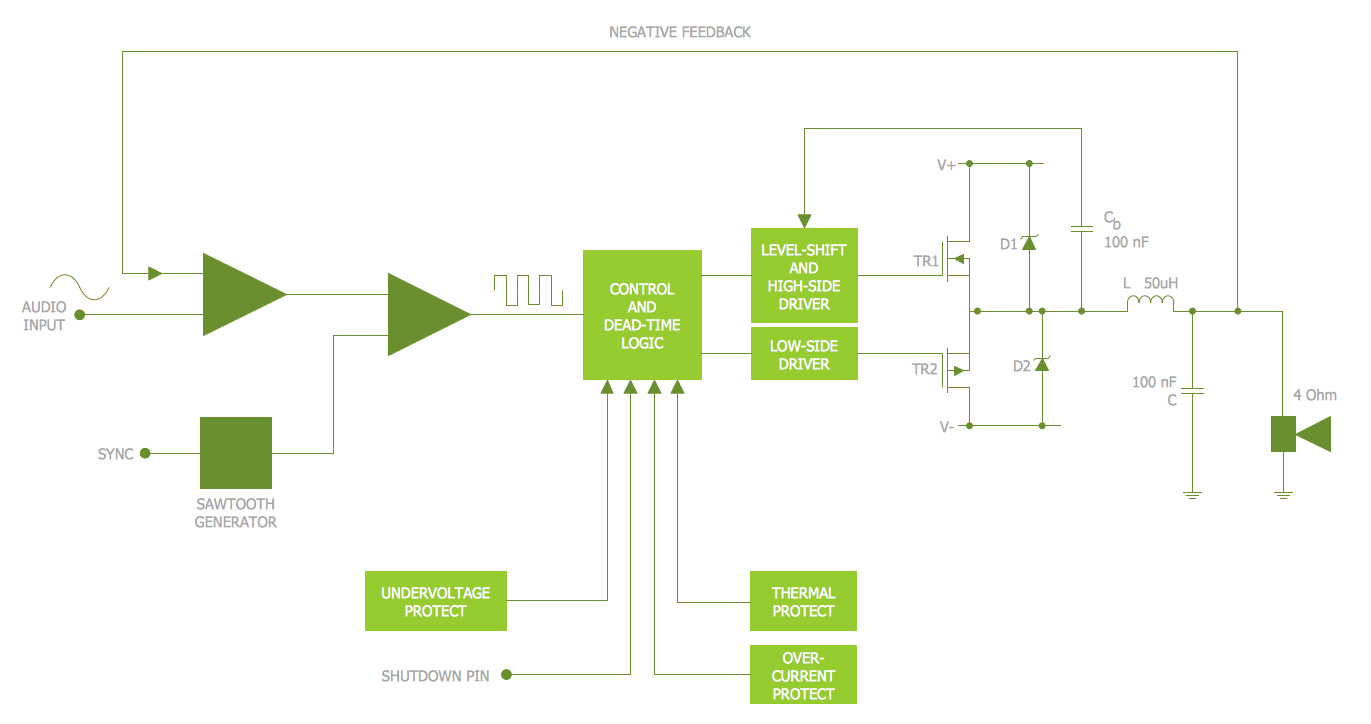
Picture: Electrical Schematic
Related Solution:
UML Sequence Diagram can be created using ConceptDraw DIAGRAM diagramming software contains rich examples and template. ConceptDraw is perfect for software designers and software developers who need to draw UML Sequence Diagrams.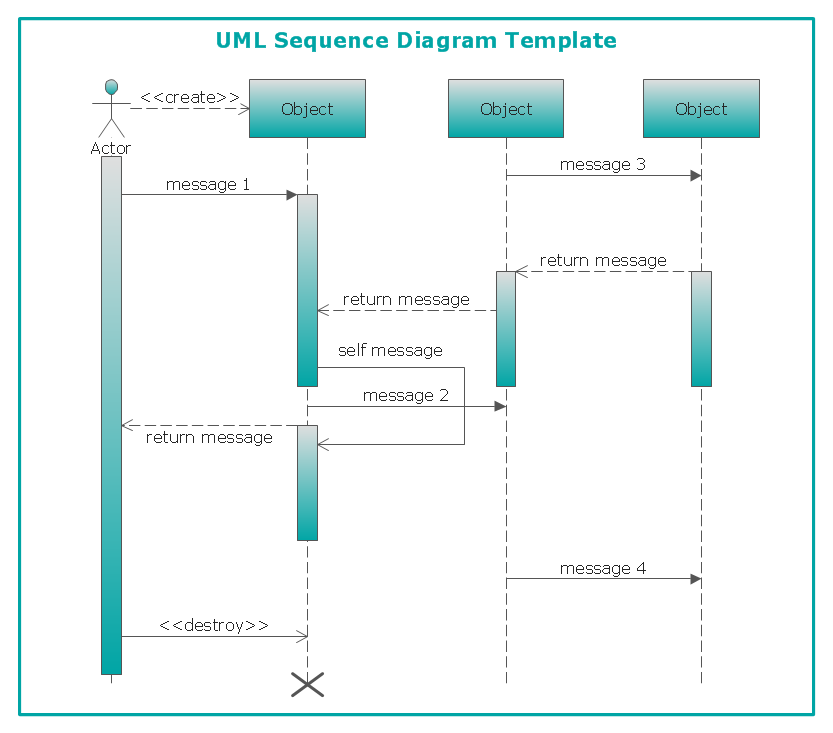
Picture: UML Sequence Diagram
VSM symbols are the best for a production process designing. The entire Value Stream Mapping method uses a graphical representation of the manufacturing process, factors' pros and cons, that all stakeholders can easily understand. Value Stream Mapping is a graphical technique that provides possibilities to improve analysis of a manufacturing process, at the stage of the transferring information or materials that required to deliver a product or service to the customer.
Picture: Value Stream Mapping Symbols
Related Solution:
ConceptDraw MINDMAP is a powerful business and personal productivity software application that provides visual organization and access to information for individuals and organizations.
Picture: ConceptDraw MINDMAP :Brainstorming, Mind Mapping for macOS and Windows
Pictures of Food represented on the food court signboards, show-cases, at the menus form the cafe style and attract clients. Bright, colorful and effective advertising increases the chance of visiting exactly this cafe among many in the food court. When visiting fast food at the food court, a potential client is enough to throw just a glance at the menu-board. ConceptDraw DIAGRAM software offers the Food Court solution from the Food and Beverage area of ConceptDraw Solution Park for easy designing unique pictures of food.
Picture: Pictures of Food
Related Solution:
A Virtual network is a computer network that consists of virtual network links, i.e. between the computing devices there isn't a physical connection.
Well known forms of network virtualization are virtual networks based on the virtual devices (for example the network based on the virtual devices inside a hypervisor), protocol-based virtual networks (VLAN, VPN, VPLS, Virtual Wireless network, etc.) and their combinations.
This example was created in ConceptDraw DIAGRAM using the Computer and Networks Area of ConceptDraw Solution Park and shows the Virtual network.
Picture: Virtual networks. Computer and Network Examples
Related Solution: