In the process of conducting business, sometimes words alone do not have the ability to describe a situation, state, or process with enough accuracy to guarantee successful communication to stakeholders, team members, and other assorted individuals. To convey a faultless understanding to others it is often necessary to include graphics and diagrams to support the meaning conveyed. The combination of words and graphics associated with the text is a powerful cohesive means of communication that removes participant doubt and improves clarity. The end result is to accelerate business. Business today is conducted at an incredible rate. The speed of business has increased for organizations of every size and for all participants.
| List |
ConceptDraw DIAGRAM |
Omnigraffle Professional |
MS Visio Professional |
| Features |
| Last version to sale |
12 |
7 |
2016 |
| OS |
Win/macOS |
macOS/iOS |
Win |
| General Features |
| Multi-page Documents |
+ |
|
+ |
| Presentation mode |
+ |
+ |
+ |
| Sample diagrams supplied with program |
+ |
+ |
+ |
| Smart Connectors |
+ |
+ |
+ |
| Spline tool |
+ |
+ |
|
| Shape Sheet |
+ |
|
+ |
| Dropper tool |
+ |
|
|
| Locking various object properties from changing |
+ |
+ |
| Ability to edit a group (set text, fill, set line properties and etc.) |
+ |
+ |
+ |
| Library navigator window |
+ |
|
+ |
| Find objects in libraries |
+ |
|
+ |
| Set of predefined units of measurement |
+ |
+ |
+ |
| Alpha Channel support (opacity/transparency) |
+ |
+ |
+ |
| Built-in scripting language |
+ |
|
+ |
| Extend application possibilities with plug-ins |
+ |
|
+ |
| Extended hyperlinks |
+ |
+ |
+ |
| Background pages support |
+ |
|
+ |
| Texture fill |
+ |
+ |
|
| Layers |
+ |
+ |
+ |
| Guide Lines |
+ |
+ |
+ |
| Corner Rounding |
+ |
+ |
+ |
| Customizable tools |
| Ability to create objects with userdefined behavior |
+ |
|
+ |
| Userdefined actions with objects |
+ |
+ |
+ |
| Supports Custom (or user-defined) Properties for shapes |
+ |
|
+ |
| Integration and sharing |
| Import Visio 2013 VSDX |
+ |
+ |
+ |
| Export to Visio 2013 VSDX |
+ |
|
+ |
| Import Visio 2013 stencils VSSX |
+ |
|
+ |
| Import PowerPoint documents |
+ |
|
|
| Export to PowerPoint documents |
+ |
|
|
| Export to EPS |
+ |
+ |
|
| Export to PDF |
+ |
+ |
|
| Import PDF |
+ |
|
|
| Supports own XML format |
+ |
|
+ |
| Export to HTML |
+ |
+ |
|
| Export to SVG |
+ |
+ |
+ |
| Integration with mind mapping tool |
+ |
|
|
| Integration with Project Management tool |
+ |
+ |
|
| Libraries |
| OS X interface libraries |
+ |
|
|
| Ribbon interface library |
+ |
|
|
| Building, space, and floor plans |
+ |
+ |
+ |
| Directory services diagrams |
+ |
|
+ |
| Engineering diagrams—electrical, chemical, and more |
+ |
|
+ |
| Logical network diagrams |
+ |
|
+ |
| Network rack diagrams |
+ |
|
+ |
| Software diagramming |
+ |
|
+ |
| Value stream maps |
+ |
|
+ |
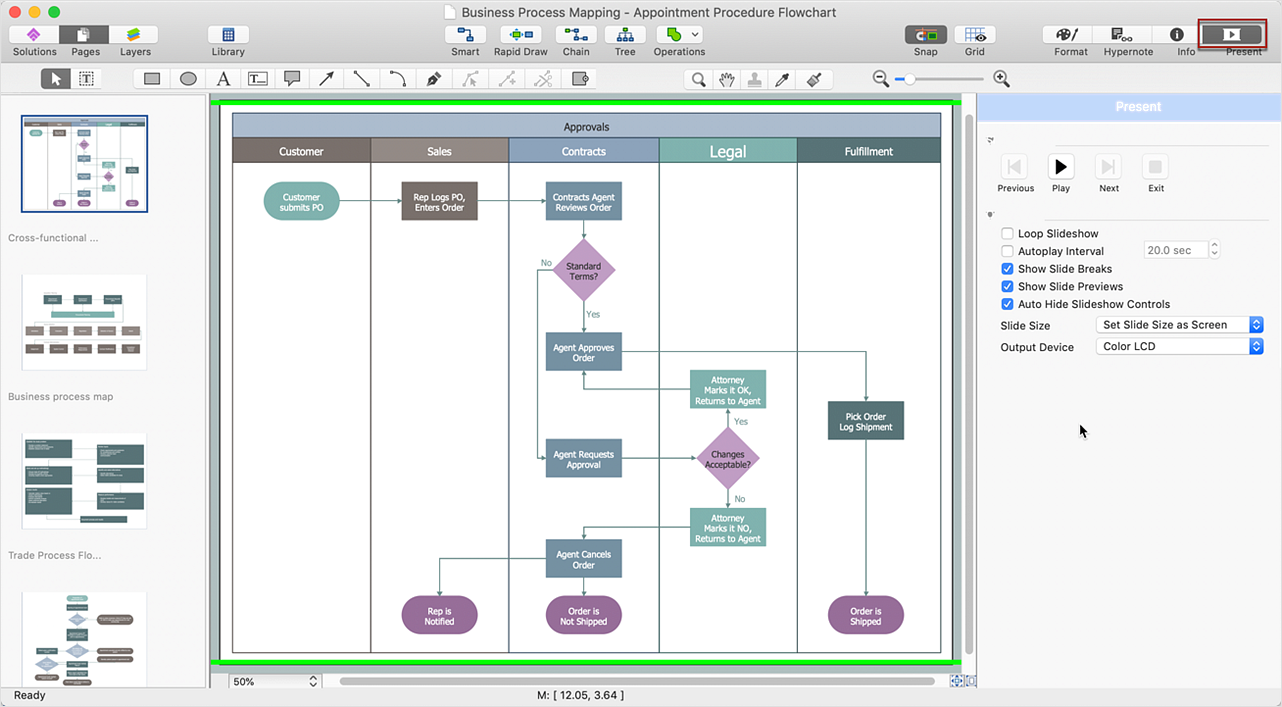
Pic. 2. Dynamic Presentations
With Dynamic presentations, you can display your presentation on a secondary monitor or projector, while your main monitor is left open for you to make edits as you move through the presentation. This allows you the unique ability to collaborate with team members in a meeting setting or quickly respond to feedback from your audience.
Any diagram or drawing you make in ConceptDraw DIAGRAM can be a dynamic presentation — everything from flowcharts and block diagrams to network diagrams and wiring schematics.
All source documents are vector graphic documents. They are available for reviewing, modifying, or converting to a variety of formats (PDF file, MS PowerPoint, MS Visio, and many other graphic formats).
See also Samples:
TEN RELATED HOW TO's:
The affinity diagram is a business tool used to organize ideas and data. It is one of the Seven Management and Planning Tools. But how design the Affinity Diagram quick and easy? ConceptDraw DIAGRAM diagramming and vector drawing software offers the Seven Management and Planning Tools Solution from the Management Area.
Picture: Affinity Diagram
Related Solution:
Why do you need a business process flow diagram? How to use business process diagram software? Explore ✔️ the significance, ✔️ creation process, and ✔️ discover cutting-edge software solutions designed to streamline and optimize your workflows
Picture: Business Process Workflow Diagrams & Software
Related Solution:
The following examples cctv network were created in ConceptDraw DIAGRAM diagramming and vector drawing software using the Audio, Video, Media Solution. Using this easily customizable cctv network template you can represent any existing cctv network.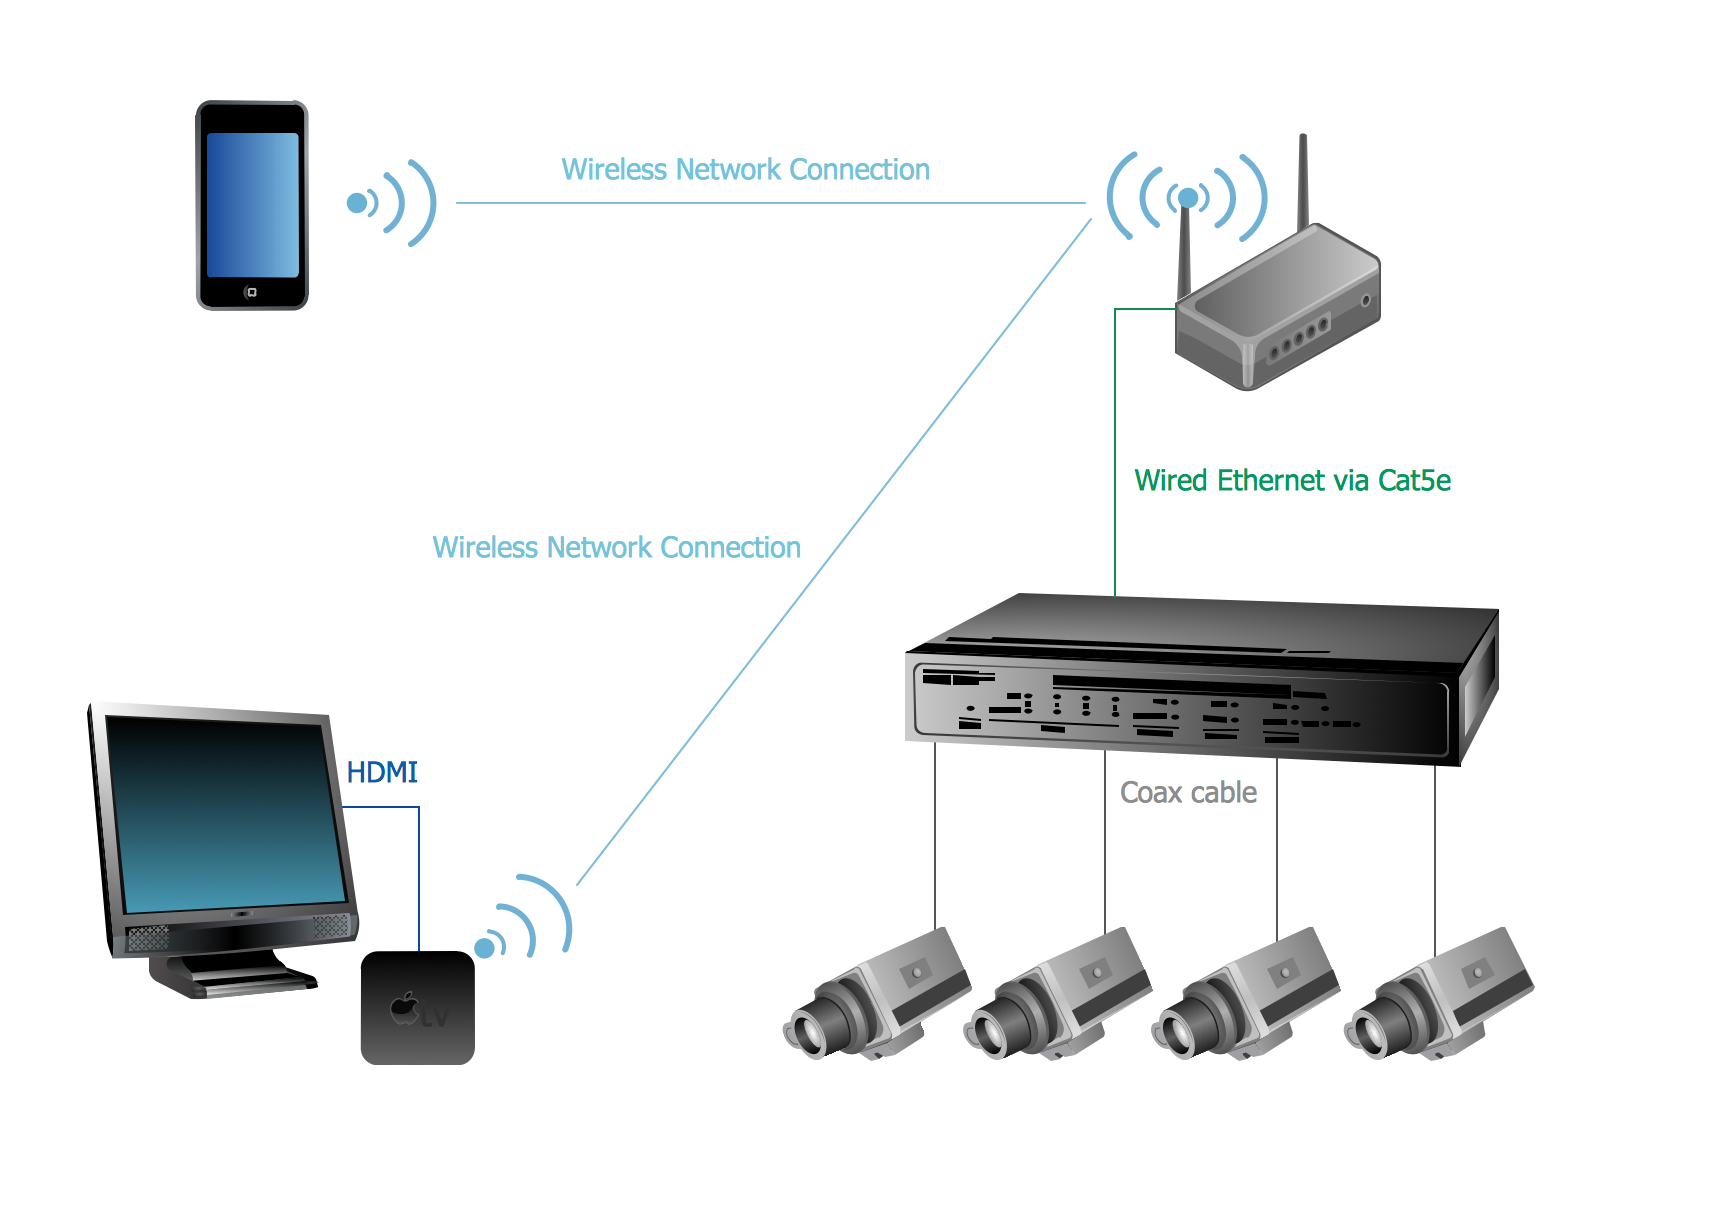
Picture: CCTV Network Example
Related Solutions:
How should diagramming software work? The answer is - Fast and easy. Tree- mode drawing works like that. Just select objects in your drawing and press Tree or Chain button to connect all of them just in one click. Your diagram looks professional and it took only a moment to draw.
Picture: ConceptDraw Arrows10 Technology
A family evening in a restaurant can be just charming, the problem is to find a one. If you spend an extra day to create a good restaurant floor plan, that will surely brings more clients. By the time your restaurant gets more popular, don’t forget about the quality of service.
The restaurant floor plan you see on this page was made with ConceptDraw DIAGRAM in accompanied with Cafe and Restaurant Plans solution. It introduces facilities of the solution and demonstrates the results, you can obtain if you deploy ConceptDraw tools for generating floor plans and interior designs for cafe, restaurants or other catering establishments. A little less than three hundred vector objects, and a set of built-in templates and a set of examples will maintain your creativeness.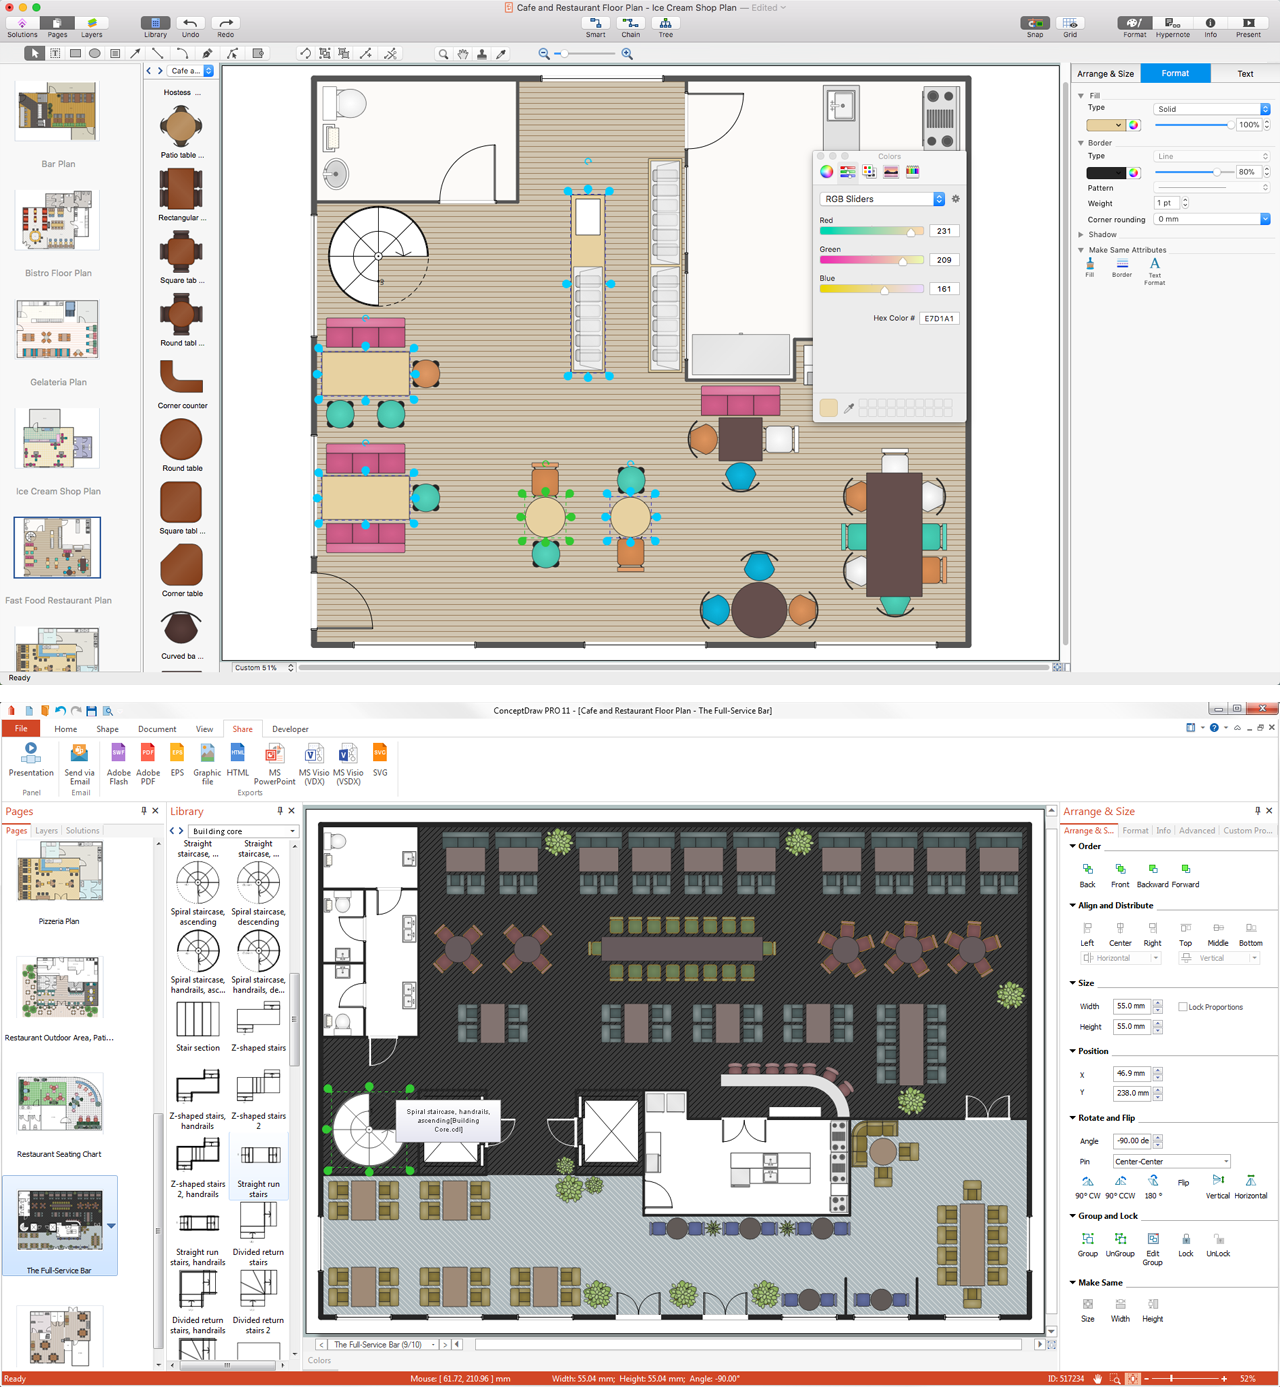
Picture: Restaurant Floor Plans
Related Solution:
Pyramid chart example is included in the Pyramid Diagrams solution from Marketing area of ConceptDraw Solution Park.
Picture: Pyramid Diagram
Related Solutions:
ConceptDraw DIAGRAM diagramming and vector drawing software supplied with Chemical and Process Engineering Solution from the Industrial Engineering Area of ConceptDraw Solution Park is powerful and effective process engineering software.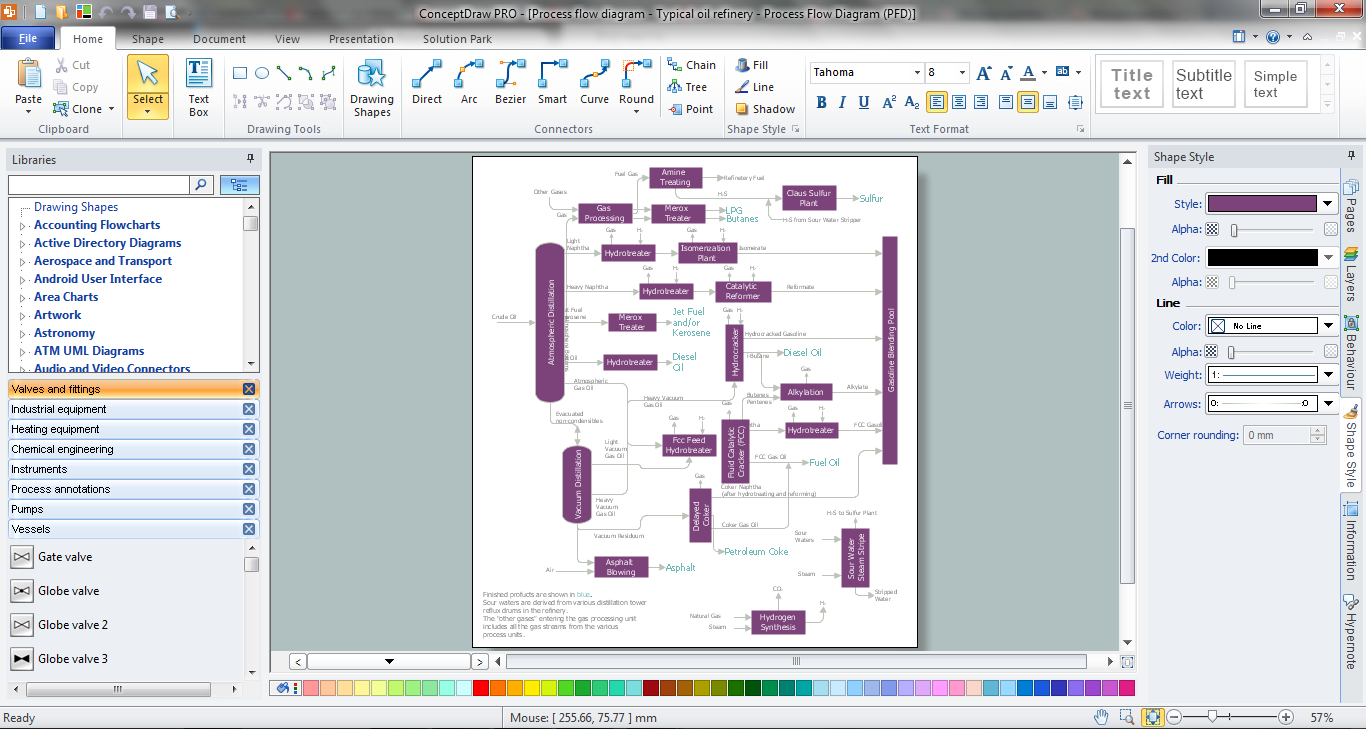
Picture: Process Engineering
Related Solution:
Working with disordered network data can be quite exhausting. Sometimes it's necessary to find a network diagramming software to design Cisco network diagrams that would be easy to use and would be able to export diagrams to various graphic formats. ConceptDraw DIAGRAM is a great diagramming tool that is able to perform all these tasks easily.
This vector library represents a set of 26 objects depicting the manufacturer - standard equipment of Cisco switches and hubs. This is only a small part of the vector graphic objects of Cisco equipment that comprise the Cisco Network Diagrams solution. In full the ConceptDraw Cisco Network Diagrams solution has 15 libraries, containing more then 500 objects to create a Cisco network diagrams. They can be used by IT specialists and corporative IT divisions, system and network administrators to make the visual documentation of Cisco networks topology.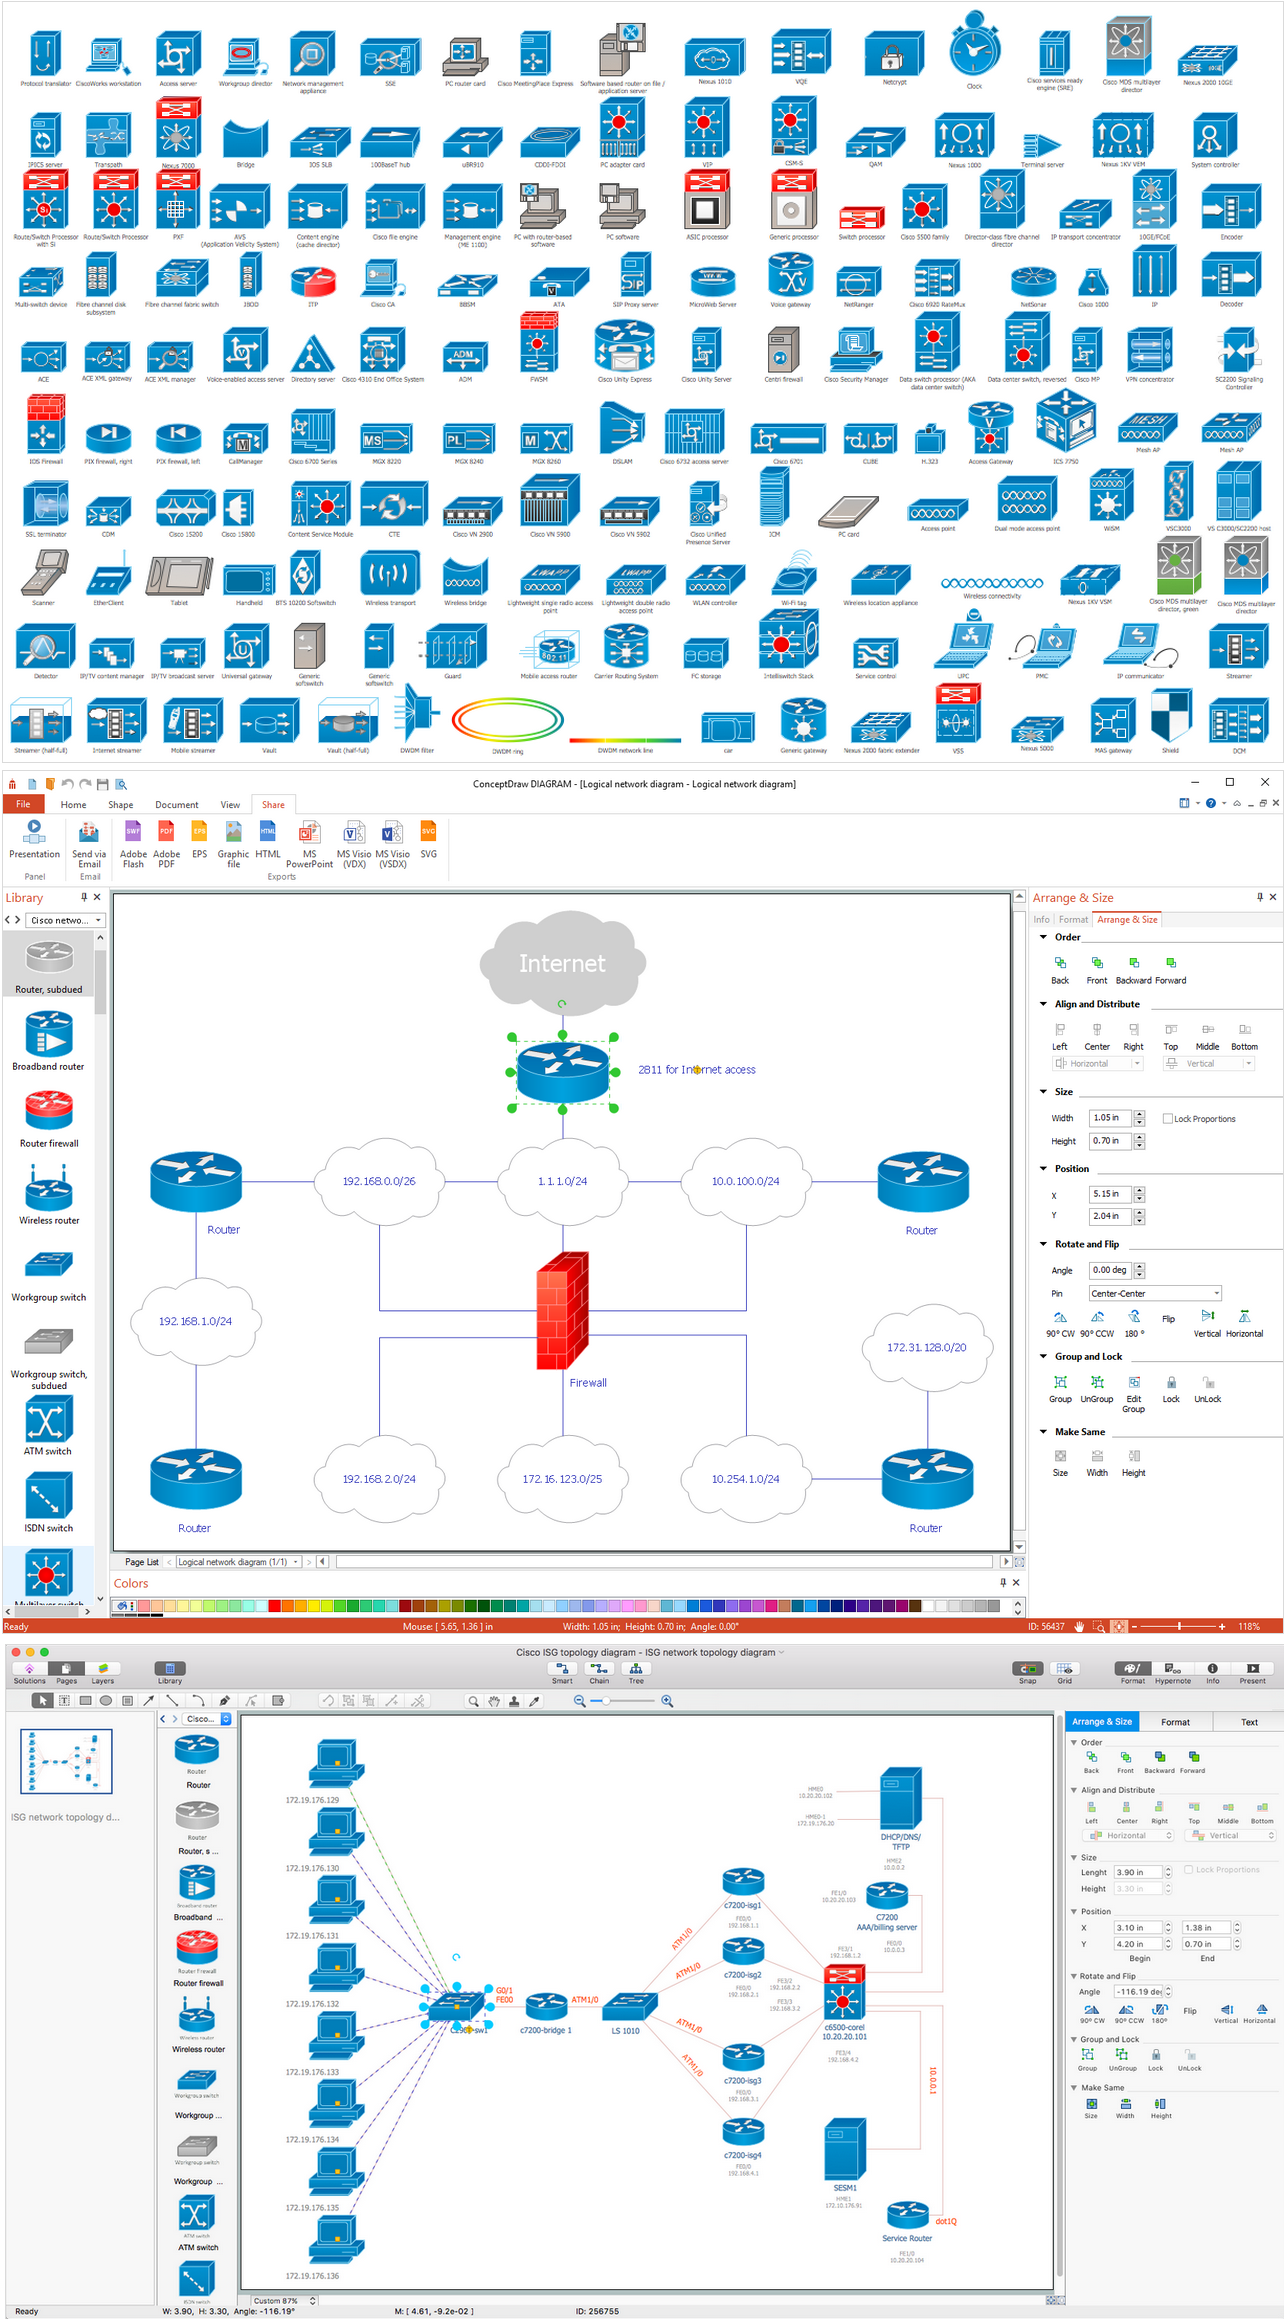
Picture: Network Diagramming Software for Design. Cisco Network Diagrams
Related Solution:
Professional Mind Mapping. ConceptDraw MINDMAP professional software to create documents. Mac and PC compatible. MS Office Exchange Solutions. Skype Collaboration. Presentation Tools.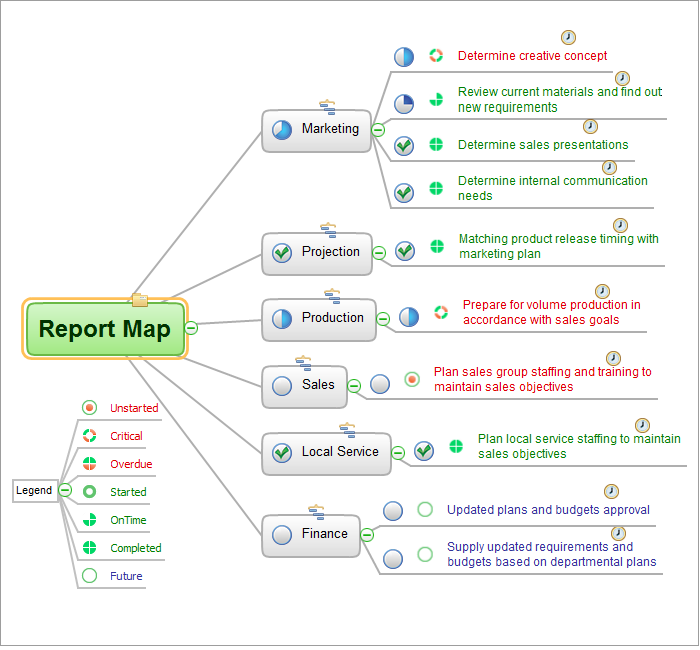
Picture: One formula of professional mind mapping :input data + output data + make great presentation
Related Solution:
The human organism is so constituted that for a full life you need a wide range of nutrients, minerals and vitamins. To get all this, it is necessary to enrich your nutrition by natural and healthy food. The same microelements and nutrients are contained in different foods, so it is very important to create your own healthy diet plan, based on your preferences and containing the balance of nutrients suitable for you.
ConceptDraw DIAGRAM diagramming and vector drawing software extended with Health Food solution from the Food and Beverage area of ConceptDraw Solution Park contains powerful tools for designing healthy diet plan.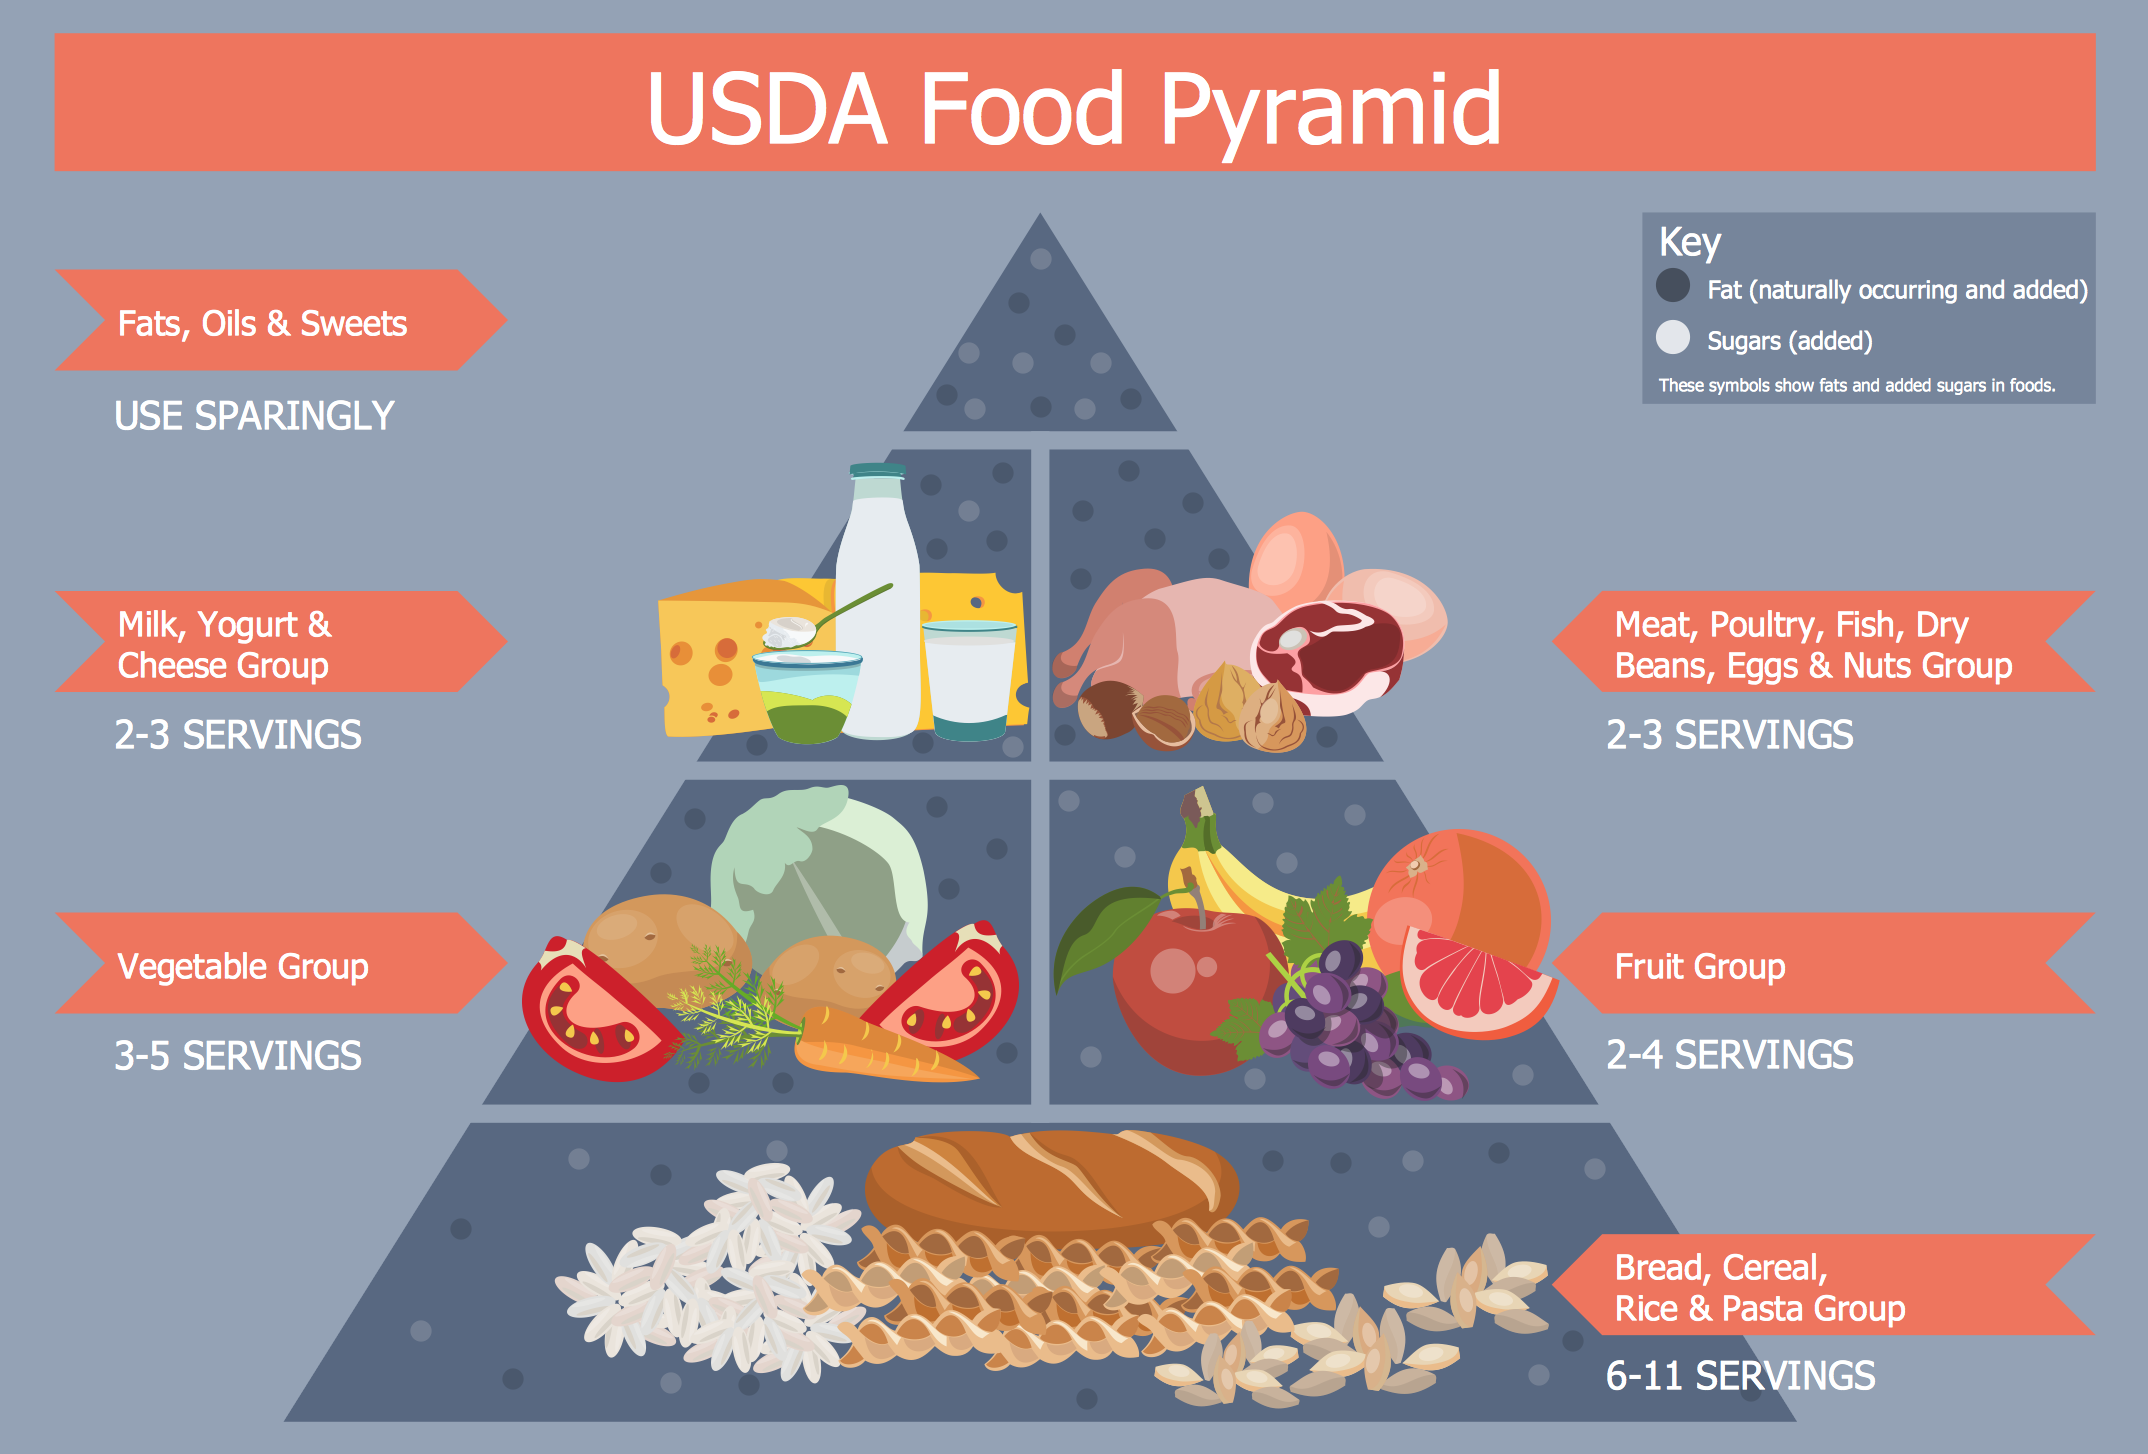
Picture: Healthy Diet Plan
Related Solution: