Made with
ConceptDraw
DIAGRAM 18

IDEF9 Standard

IDEF9 method, as well as other IDEF methods, was developed in the framework of the BBC USA program on information integration for coordinated development (The Air Force Information Integration for Concurrent Engineering (IICE)). IDEF9 method is one of the methods, which constitute the technology of the work with existing information and knowledge. In particular, IDEF9 method (Business Constraint Discovery) is developed for calculation and analysis of conditions and limitations in business-systems. The main motivation for development of such method was the perception of the fact, that conditions and limitations, influenced on the enterprise structure, usually are poorly defined and studied. An organization can normally function (which frequently happens) without knowledge about conditions and limitations, which acts in its system, in other words, without knowledge about requirements of this system.Nevertheless, if there is a task to improve the functioning of the production system, to increase its effectiveness and adapt the enterprise to new market conditions, the knowledge about the enterprise system requirements is critically significant.

Each object of the production system has its own requirements, and their fulfillment affect the execution of the production task in general. Accordingly, if there is a necessity to change the system behavior (to increase the effectiveness or production) it is necessary to know which requirements of the system objects must be satisfied for this. As a result of using IDEF9 method, system requirements are specified and cataloged. Thus, it is always possible to check easily how much system requirements are satisfied and correspondingly to change work conditions for gaining the necessary result. By knowing the system requirements it is also possible to explain why at the moment the system works this way and how to improve its work. IDEF9 method is an indispensable tool of a business-engineer, as with its help is it possible to define how the system will work and which requirements will have to be satisfied for the system work accordingly to the project.

Accordingly to IDEF9 method, requirement is a kind of a connection between system parts, which must obligatory exist at the given conditions set (context). The condition is considered as fulfilled if all conditions of its existence in the given context are fulfilled. Requirement is a connection type, which can be established between system objects, between processes, between objects and processes, between processes and objects properties, etc.

Requirements are described by statements. An example of the requirement statement to objects: “Only heads of departments are authorized to sign waybills.” An example of the requirement statement of the process to objects: “Transportations are only allowed in the presence of a signed waybill” or “Credit giving out is only possible at monthly paying off the percents on the credit.” An example of the requirement statement of the process to object properties: “Maximum carrying capacity of the elevator is 500 kg.”

In that way, the system is represented in the view of a set of objects and processes, which have definite requirements for system functioning. Also into the system description the purpose of the work of this system is usually included. This is necessary for definition of only those requirements of objects and processes, which are important for execution of the considered task.At the system projecting the requirements define which rules, conditions, limitations and necessary connections the project must involve. The production system represents the set of objects, executing one or several functions under the influence of requirements for reaching the preset goal.

Requirements are divided into:

  • Inner (in), which influence inside the system;
  • Outer (on) which influence outside the system or which are managed outside the system;
  • Belonging to the system (of), which belong to the system and are controlled by it;
  • Intersystem (between), which connect systems between each other in the capacity of objects of a big system.

Also the requirements are divided into enabling and limiting in the context of the considered conditions. Surely, limiting requirements are more obvious and become apparent in the form of following problem symptoms: excess costs, low quality, terms increase, etc. Such symptoms are called evidence of existing of the requirements in a system.

The set of opinions, proving the necessity of definition and providing the requirement for system objects is called rationale for the requirement. The consequences of the influence of the requirement on the system are called effects of the requirements. Effects can be direct and indirect, intended and unintended, desirable and undesirable in the framework of the considered context.

It is necessary the sufficient number of evidence of requirements existence, otherwise the requirement will remain undefined. The effective definition of requirements and their management lets quickly identify requirements and react upon the typical industrial problems of requirements, listed below:

  • The cost of the requirement execution exceeds the requirement value;
  • An existing requirement does not correspond to the enterprise purposes anymore;
  • The requirement provokes unforeseen and undesired effects;
  • Objects of the system, responsible for the requirements fulfillment are incapable to provide the requirements fulfillment;
  • The requirement does not have an obvious mechanism of provision.

Also systems overloaded with outdated or inappropriate requirements lose productivity and waste resources on execution of these requirements.

Potential users of IDEF9 method are business owners, organization managers, system projecting and planning specialists and analysts. The knowledge of system requirements may help in Business Process Reengineering (BPR), Total Quality Management (TQM) and in strategic planning..

There is an example of the procedure of definition, confirmation and further improving of the requirement. The given procedure consists of following stages:

  1. Information collection (Collect) – implies the collection of data about the system and getting evidence of the requirement necessity.
  2. Classification (Classify) - definition of system conditions, objects, objects’ properties, processes and connection types.
  3. Hypotheses formation (Hypothesize) – selection of requirements-candidates, based upon received data and evidence.
  4. Requirement realization (Substantiate) – collection of examples for definition of the best requirement-candidate.
  5. Requirement check-up (Challenge) - checking-up of the requirement with the engagement of the interested persons.
  6. Requirement improvement (Refine) – modernizations, checkout, improvement of the requirement and adding details to the requirement characteristics.

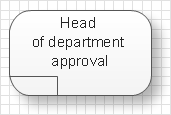
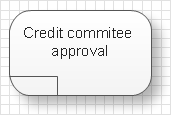
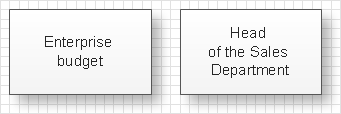
Accordingly to IDEF9 method requirements are displayed in the form of visual schemes. Requirements on the schemes are displayed by way of rounded rectangles, objects and processes in the form of rectangles. Connections between objects of the scheme are represented by way of lines. The connection, indicating at obliging circumstances, is represented in the form of a line with the black little circle at the end. There are also used junctions, which are shown on the scheme in the form of squares with the definition of the junction type: &, O, X.

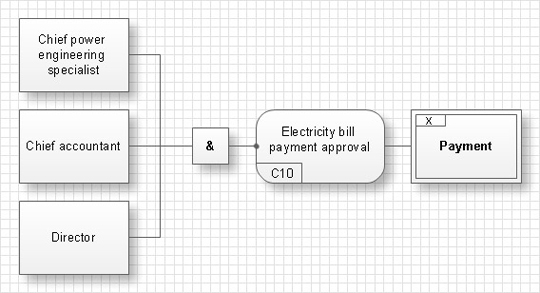
For example there is a following requirement: “An account for payment of consumed electricity must be signed by the head specialist of the power engineering, by the chief accountant and the head of the enterprise.” The corresponding scheme will have the following view:

Here the double-sided rectangle presents the context of a task, the rounded rectangle shows the requirement itself, and rectangles represent objects, which influence on the requirement execution. & junction shows that the requirement needs an influence of all objects, i.e. the account should be signed by each of the three faces.

Analogously it is possible to compose a scheme of the selection of requirements-candidates, a scheme, reflecting requirement effects and a scheme showing which requirements should be executed for reaching the general goal.

An effective management of changes is significantly facilitated by way of definition and documenting of business-requirements. The knowledge about the business-requirements which exist and how they interrelate between each other in the best way is insufficient sometimes. Nevertheless the requirements trigger, manage and bound the behavior of objects of the business-system and affect them so that the final goal is reached with more or less costs of resources and time. IDEF9 method is developed to help with definition and analysis of the requirements.

IDEF9 Standard *

TEN RELATED HOW TO's:
It’s not easy to plan all the details of your landscape at once. Therefore, you can use a bubble diagram to create a draft of the future project. You can develop any bubble diagrams and use them in your landscape design project with ConceptDraw DIAGRAM and it’s predesigned templates. This bubble diagram can be applied while initiating the development of garden and landscape design. The bubble diagrams used for this purpose are different from the classic bubble diagrams. Being used in landscape and garden design, they obtain the quite another understanding. Bubbles in this diagram visualize some captured areas, which define the general spaces of a future garden: lawn, flower garden, pool, built-up area, lighting, etc. The bubble diagram represents the landscape project without any special expenses on its creation. It is better to make such simple sketch before you drill down into detailed project and cost estimates.Bubble diagrams in Landscape Design with ConceptDraw DIAGRAM
Picture: Bubble diagrams in Landscape Design with ConceptDraw DIAGRAM
When studying computer science, it is important to have good training manuals. To understand how the networks and data links work, you will probably need a set of network diagram examples depicting all the possible interconnections between network devices. You can find them on Internet or try to create your own. This example of a network topology diagram was made using ConceptDraw Computer and Network Diagrams solution. It represents a bus topology network diagram. A bus topology means that computers and peripherals in the network are connected to a mutual cable (backbone). This topology is often used for small networks. This diagram was designed using vector libraries of network equipment symbols. They also can be applied while creating various LAN and WAN diagrams.Network Diagram Examples *
Picture: Network Diagram Examples
When we think about programming, we usually imagine sleepless nights spent on writing kilobytes of code. However, from another point of view, Software development with ConceptDraw DIAGRAM makes a programmer's life endlessly easier. This tool is unique to fulfill all your needs in short period of time. Over the recent years object-oriented methodology has become more and more widespread. Thanks to this methodology developers manage to deal with growing complexity of applications. More and more programs are written in such programming languages as C++, Java, Visual Basic and Object Pascal. However, the complexity of the designed systems imposes extended requirements as to design of graphic documentation. ConceptDraw possesses powerful tools for designing of technical documentation for object-oriented projects. The libraries included in the package allow to easily draw class hierarchies, object hierarchies and diagrams of data flows with the use of the most popular notations, including UML and Booch notations. And the library for projecting COM-interfaces will spare developers of ActiveX-servers a headache.Software development with ConceptDraw DIAGRAM  *
Picture: Software development with ConceptDraw DIAGRAM
If you ever wanted to try any diagramming tools except of Visio, but were afraid to lose existing documents, there’s good news for you. One of the most striking features of ConceptDraw DIAGRAM is it’s perfect compatibility with MS Visio, which guarantees that you won’t depend on operating system anymore, because another ConceptDraw DIAGRAM feature is that it’s cross-platform tool. Don’t waste your time looking for other options, you’ve found the solution already! Business professionals often utilize the MS Visio as a common tool for making various issues on business visualization. MS Visio is a strong software with good capacity to maintain complex business solutions. But there is no MS Visio for Apple OS X. This is a large invocation, and one would be pleased to recognize that ConceptDraw DIAGRAM is the ideal alternative to MS Visio. Primarily, because this software works natively on both Windows and Apple OS X platforms. if you have migrated from Windows to Mac, or need to communicate in a cross-platform conditions, you’ll search for MS Visio replacer. ConceptDraw DIAGRAM is the exclusive professional business diagramming application that runs on both Windows and Apple OS X. The opportunity exchange files between PC and Mac, as well as between ConceptDraw DIAGRAM and Visio is the significant advantage that permits you to display and to collaborate business information in effortless and cost-effective way.ConceptDraw DIAGRAM Compatibility with MS Visio *
Picture: ConceptDraw DIAGRAM Compatibility with MS Visio
The Microsoft Windows Azure platform is a highly flexible cloud-based solution with variety of services which supports not only the execution of.NET applications, but also allows developers to use programming languages like Java, PHP, Node.js, or Python. ConceptDraw DIAGRAM diagramming and vector drawing software provides the Azure Architecture Solution from the Computer and Networks area of ConceptDraw Solution Park with a lot of useful tools which make easier: illustration of Windows Azure possibilities and features, describing Windows Azure Architecture, drawing Azure Architecture Diagrams, depicting Azure Cloud System Architecture, describing Azure management, Azure storage, documenting Azure services.Windows Azure *
Picture: Windows Azure
Related Solution:
Working with information can be quite tedious, furthermore, some data can be quite difficult to perceive without any graphic representation. So, to facilitate your work, you can use business diagrams, such as simple flowcharts or Gantt charts for project management and orgcharts for clarifying your company structure. You can use a proper software, like ConceptDraw Pro, draw them on paper, or use whiteboards, but it is more convenient to use a digital tool. This diagram shows a cross-functional flowchart that was made fore telecom service provider. A workflow of a common telecommunication service provider has a rather branched structure. Thus, it is useful to have a flow chart to visualize the sequences and interrelations of the work flow steps. Business process flowchart contains 17 processes and 4 decision points,that are distributed through 2 lines depicting the participants involved. Also there are connectors that show the data flow within processes. This flowchart displays a detailed model of the telecom service trading process, as well as all participants in the process and how they interact with each other.Business diagrams & Org Charts with ConceptDraw DIAGRAM  *
Picture: Business diagrams & Org Charts with ConceptDraw DIAGRAM
This sample shows the Six Markets Model Chart. It was created in ConceptDraw DIAGRAM diagramming and vector drawing software using the Marketing Diagrams Solution from the Marketing area of ConceptDraw Solution Park. The six markets model defines six markets that take the central place in the relationship marketing: internal markets, supplier markets, recruitment markets, referral markets, influence markets and customer markets. The six markets model allows the organization to analyze the stakeholders and key market domains that can be important to it.Six Markets Model Chart *
Picture: Six Markets Model Chart
Related Solution:
Few other areas benefited as much from the development of advanced digital drawing software as interior design. Previously only done by professionals, nowadays it is made available to virtually anyone with the help of software such as ConceptDraw DIAGRAM. You can design whatever you want - a living room, an office, a garage, a school layout - design elements provided by ConceptDraw DIAGRAM fit all of these purposes. All you need to get started is your creativity and the right software tools. This library of vector graphic objects includes images of different school furniture and equipment related to school or training classes interior. These graphical elements are embedded into the ConceptDraw School and Training Plans solution. You can use them when designing interior layout of classroom or training office.Organization of the learning environment is an important element of a students learning. By using ConceptDraw DIAGRAM you can easily visualize and present your ideas related to any classes layout.Interior Design. School Layout — Design Elements *
Picture: Interior Design. School Layout — Design Elements
Related Solution:
The activity of any organization is more or less branchy network of processes. The description of these processes is a hard technical task which requires definite methodology and standards. According to the IDEF0 standard any process can be described in the form of a block (Activity Box) which has inputs and outputs. The process consists in transformation of inputs into outputs under the influence of the management and in the presence of necessary resources. Outputs of the given process later on can be either inputs for the next process or resources, or management means.IDEF0 standard with ConceptDraw DIAGRAM *
Picture: IDEF0 standard with ConceptDraw DIAGRAM
Related Solution:
A flowchart is a simple but very functional tool when it comes to understanding a workflow or to removing unnecessary stages from a process. When drawing flowcharts, keep in mind that there are four common types of flowcharts, like document flowcharts and data flowcharts that show control over a data or document flow over a system. To show controls on a physical level, use system flowcharts. In addition, to show controls in a program, you can draw a program flowchart. This flowchart diagram represents the piece of an article editing process, that involves the author and editor. It was created using the Basic Flowchart notation that consists from the basic flowchart symbols. The start and the end of the process are indicated with "Terminator" symbols. The "Process" symbols show the action steps consisting from making edits and searching for a compromise, when the author does not agree with the suggestions of the editor. The "Process" symbol is the general symbol in process flowcharts. The "Decision" symbol indicates a branching in the process flow. There are two branches indicated by a Decision shape in the current flowchart (Yes/No, Disagree/Agree). This basic flowchart can be used as a repeating unit in the workflow diagram describing the working process of some editorial office.Types of Flowcharts *
Picture: Types of Flowcharts
Related Solution:
ConceptDraw
DIAGRAM 18