Example 1. Education Information - Education Infogram Pi
First of all Education Infographics Solution offers you 11 libraries with large set of carefully thought-out vector objects, clipart, pictograms, backgrounds, etc. Below are represented previews of them all. Click please to enlarge.
Education Infographics Solution offers also the access to the collection of templates and samples rich for the education information in various fields of science.

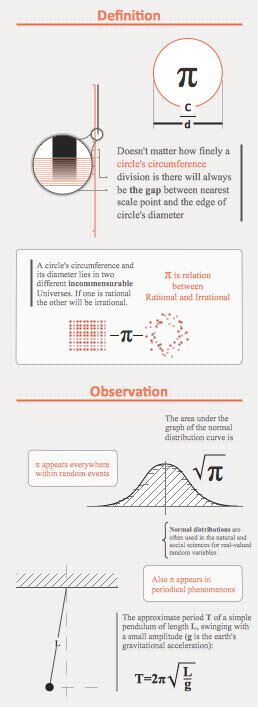
Example 2. Education Information - Length Contraction
The samples you see on this page were created in ConceptDraw DIAGRAM using the tools of Education Infographics Solution. These samples were included in Education Infographics Solution for ConceptDraw Solution Park and are available from ConceptDraw STORE. An experienced user spent 10-15 minutes creating every of them.
Use Education Infographics solution to represent the education information in a visual and attractive form quick, easy and effective.
All source documents are vector graphic documents. They are available for reviewing, modifying, or converting to a variety of formats (PDF file, MS PowerPoint, MS Visio, and many other graphic formats) from the ConceptDraw STORE. The Education Infographics Solution is available for ConceptDraw DIAGRAM users.
TEN RELATED HOW TO's:
What is the accounting cycle? The accounting cycle is a sequence of steps that occur in the accounting period and include the processes of identifying, collecting, analyzing documents, recording transactions, classifying, summarizing, and reporting financial information of an organization.
Picture: What is the Accounting Cycle?
Related Solution:
ConceptDraw DIAGRAM diagramming and vector drawing software extended with Biology solution from the Science and Education area offers a set of useful tools for fast and easy drawing of various biology illustrations and drawings.
Biology solution provides 3 libraries with large quantity of vector biology symbols: Biochemistry of Metabolism Library, Carbohydrate Metabolism Library, Citric Acid Cycle (TCA Cycle) Library.
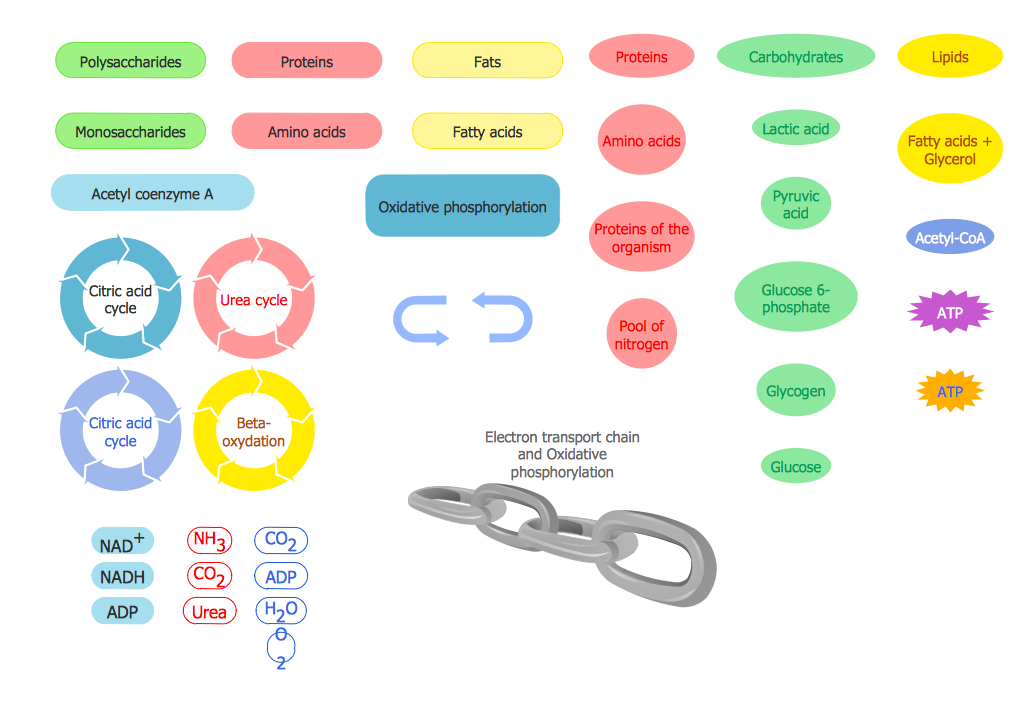
Picture: Biology Symbols
Related Solution:
Tool to draw Metro Map styled inforgraphics. Los Angeles Metro Rail and Liner sample.
This is a one-click tool to add stations to the map. It lets you control the direction in which you create new stations, change lengths, and add text labels and icons. It contains Lines, Stations, and Landmarks objects.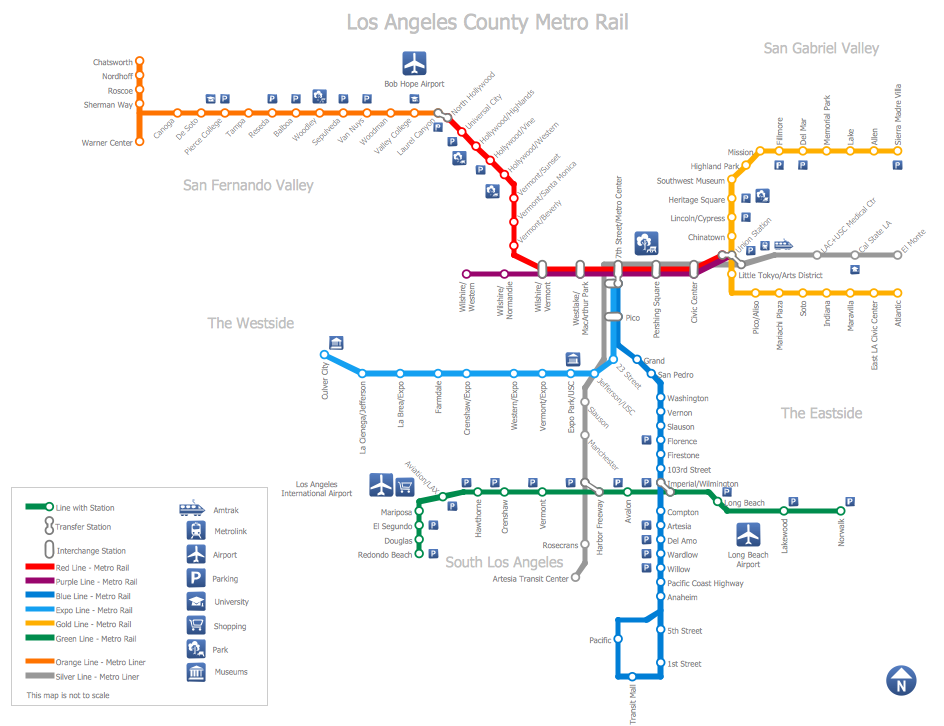
Picture: How to draw Metro Map style infographics? (Los Angeles)
Related Solution:
Use it to make professional looking documents, presentations, and websites illustrated with color scalable vector clipart for geography, weather, and animals.
Picture: How can you illustrate the weather condition
ConceptDraw Business Finance Illustration examples and libraries contain vector clip art for drawing different Business and Finance Illustrations. You may find Advertising example, Project Management example, Business Model example and many more.
Picture: Business and Finance Illustrations Example
Related Solution:
To maintain big and complex mechanical systems, you need an appropriate education and tools. It’s needless to say that mechanical drawing is important part of any industrial project. There are a lot of standard symbols depicting valves, pumps, motors, etc.
This drawing illustrates the content of the Fluid Power Equipment library provided by the ConceptDraw Mechanical Engineering solution. The solution is composed from the 8 libraries, containing about 500 elements related to mechanical engineering visualization. it will be helpful for drawing various schemes, charts and blueprints of pneumatic, and hydraulic equipment or other drawing related mechanical engineering. All drawings can be freely resized without loss of quality due to the vector graphics components of its facilities.
Picture:
Mechanical Drawing Symbols F.A.Q.
How to Use Mechanical Engineering Design Software
Related Solution:
If we divide computer networks by scale, we get several main categories. The smallest network is PAN, as it connects personal devices themselves, and as the number of users grows, a local area network can be recognized, and campus area networks (CAN) connects several local networks located within some area like a university or a corporation. Computers connected to CAN share public educational materials and list of CAN network examples includes such prestigious universities like Stanford and Carnegie Mellon.
This is an example of a computer network diagram created for a campus area network. It was created using using ConceptDraw solution for the Computer and Network diagramming. The specific of this sample campus network is its distribution. It is rather broad to embrace a big campus territory. This diagram can be applied as a template for designing custom area network topology diagram for a particular educational institution.
Picture: Campus Area Networks (CAN). Computer and Network Examples
Related Solution:
What is Cloud Computing? The Cloud computing is a widely used and highly demanded utility in the modern world thanks to its high computing power, performance, scalability and accessibility, and at the same time low cost of services. The ConceptDraw DIAGRAM diagramming and vector drawing software provides an easy and effective Cloud Computing Diagrams solution from the Computers and Network area of ConceptDraw Solution Park for making professional looking Cloud Computing and Cloud Computing Architecture Diagrams.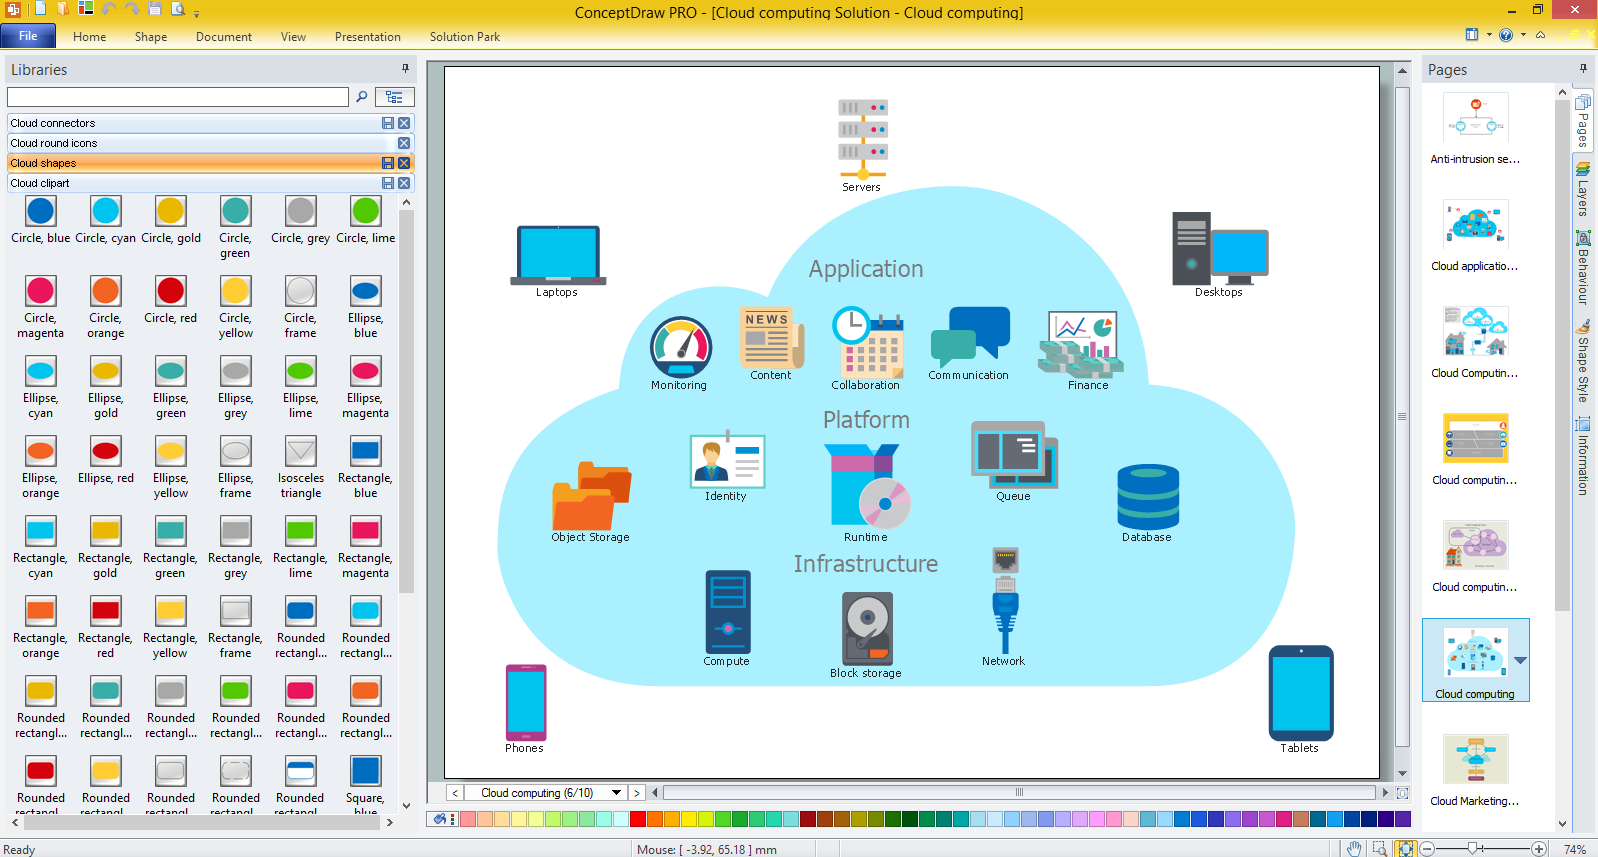
Picture: What is Cloud Computing
Related Solution:
Business graphic applications show a special knowledge representations and include many features for creating schematic pictures. These graphic tools are known as flowchart maker or flowchart maker software.
Picture: Flowchart Maker
Related Solution:
Successful quality management implemented in a company of any size is a critical component of a company organization.
Picture: What is a Quality Management
Related Solution:


 Library")
 Library")
 Library")


