Example 1. Typography Infographic Software
Typography Infographics Solution offers you collection of infographics examples and 9 libraries with wide variety of predesigned vector objects.
All vector objects from these libraries are the most popular and widely used in typography art. They are helpful and timesaving for you – simply drag desired of them from the libraries and arrange in your document.
ConceptDraw DIAGRAM also provides you the palette with numerous colors that will help you make your typography graphic even more beautiful, colorful, bright and certainly successful.

Example 2. Typography Infographic — UK Economy
The following features make ConceptDraw DIAGRAM the best Typography Infographic Software:
- You don't need to be an artist to draw professional looking infographics in a few minutes.
- Large quantity of ready-to-use vector objects makes your drawing typography infographics quick and easy.
- Great number of predesigned templates and samples give you the good start for your own infographics.
- ConceptDraw DIAGRAM provides you the possibility to use the grid, rules and guides. You can easily rotate, group, align, arrange the objects, use different fonts and colors to make your diagram exceptionally looking.
- All ConceptDraw DIAGRAM documents are vector graphic files and are available for reviewing, modifying, and converting to a variety of formats: image, HTML, PDF file, MS PowerPoint Presentation, Adobe Flash, MS Visio.
- Using ConceptDraw STORE you can navigate through ConceptDraw Solution Park, managing downloads and updates. You can access libraries, templates and samples directly from the ConceptDraw STORE.
- If you have any questions, our free of charge support is always ready to come to your aid.
SEVEN RELATED HOW TO's:
Funnel diagram can be also known as a funnel chart being similar to a stacked percent bar chart. This drawing is a type of chart that can be often used in order to represent the stages in some sales process. It can be also used for showing the amount of potential revenue for each of the described stages.
In order to make a funnel diagram, the Funnel Diagrams solution can be used while working in the ConceptDraw DIAGRAM diagramming and drawing software. Having the pre-made design elements as well as the examples of funnel diagrams, the Funnel Diagrams solution allows any ConceptDraw DIAGRAM user to make their own unique as well as professionally-looking drawings.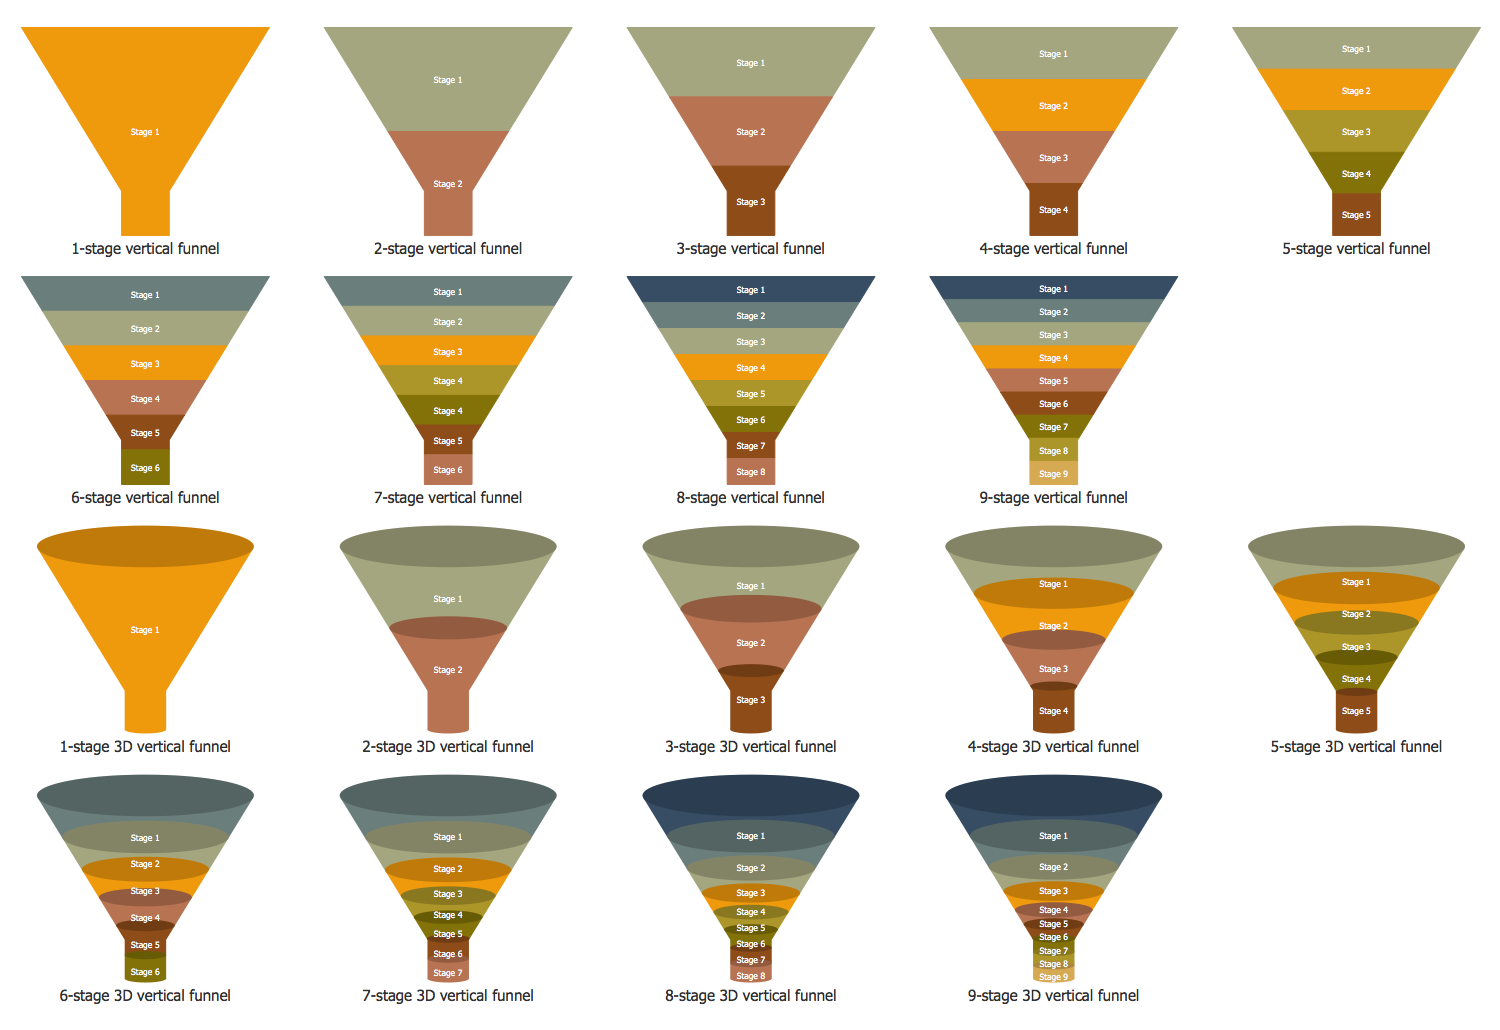
Picture: Funnel Diagram
ConceptDraw DIAGRAM supplied with Typography Infographics Solution from the “Infographics” Area is a powerful typography infographic software that provides a set of useful typography infographics tools.
Use the Typography Infographics Solution for ConceptDraw DIAGRAM typography infographic software to create your own professional looking Typography Infographics of any complexity quick, easy and effective, and then successfully use them in various fields.Picture: Typography Infographic Software
Related Solution:
Electrical plan is a document that is developed during the first stage of the building design. This scheme is composed of conventional images or symbols of components that operate by means of electric energy. To simplify the creation of these schemes you can use house electrical plan software, which will not require a long additional training to understand how to use it. You only need to install the necessary software ant it’s libraries and you’ll have one less problem during the building projection.
Any building contains a number of electrical systems, including switches, fixtures, outlets and other lightening equipment. All these should be depicted in a building electrical plans and included to general building documentation. This home electrical plan displays electrical and telecommunication devices placed to a home floor plan. On the plan, each electrical device is referenced with the proper symbol. Electrical symbols are used for universal recognition of the building plan by different persons who will be working on the construction. Not all possible electric symbols used on a certain plan, so the symbols used in the current home plan are included to a legend. The electrical home plan may be added as a separate document to a complete set of building plans.
Picture: How To use House Electrical Plan Software
Related Solution:
ConceptDraw is a data visualization tool, which can help you to create a map infographics. Anyone can do this, it's that easy!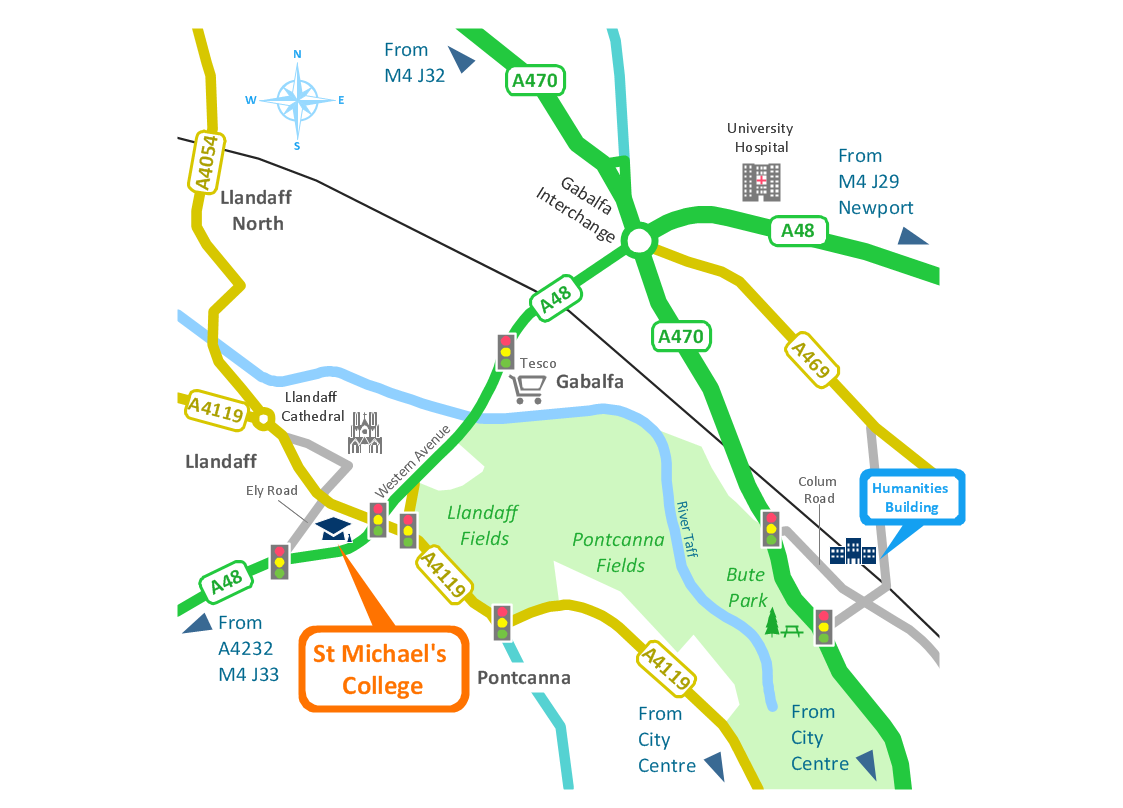
Picture: Map Infographic Tool
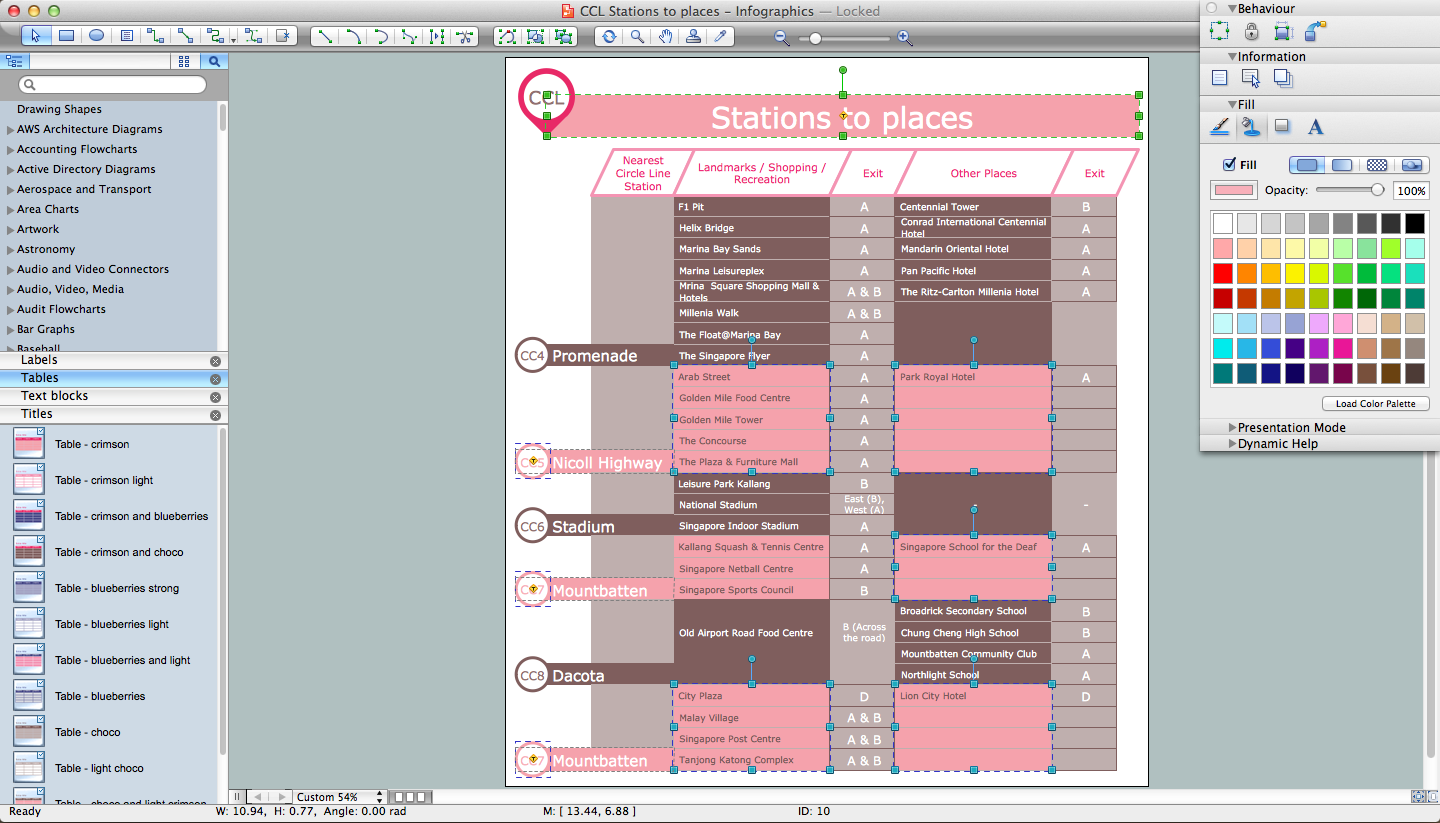
Subway infographic design elements of MetroMap and ConceptDraw software tools.
Picture: Subway infographic design elements - software tools
Related Solution:
Creating diagrams and schemes is a pleasure with proper software. You don’t need any additional skills to create organizational chart quick and effectively with our diagramming tool. Create your ConceptDraw account today and start your diagramming experience.
This is the most regular type of organizational chart - hierarchical. It is created using the ConceptDraw Organizational Charts solution. Its composition can be displayed as a pyramid, with an only person in authority at the top, with sub-levels of management below them. According to hierarchy, an employee communicates only to his immediate head or subordinates. A hierarchical organizational structure may be choice for a businesses that work on multiform markets or any other organization that has a workflow requiring a multilevel structure of middle management.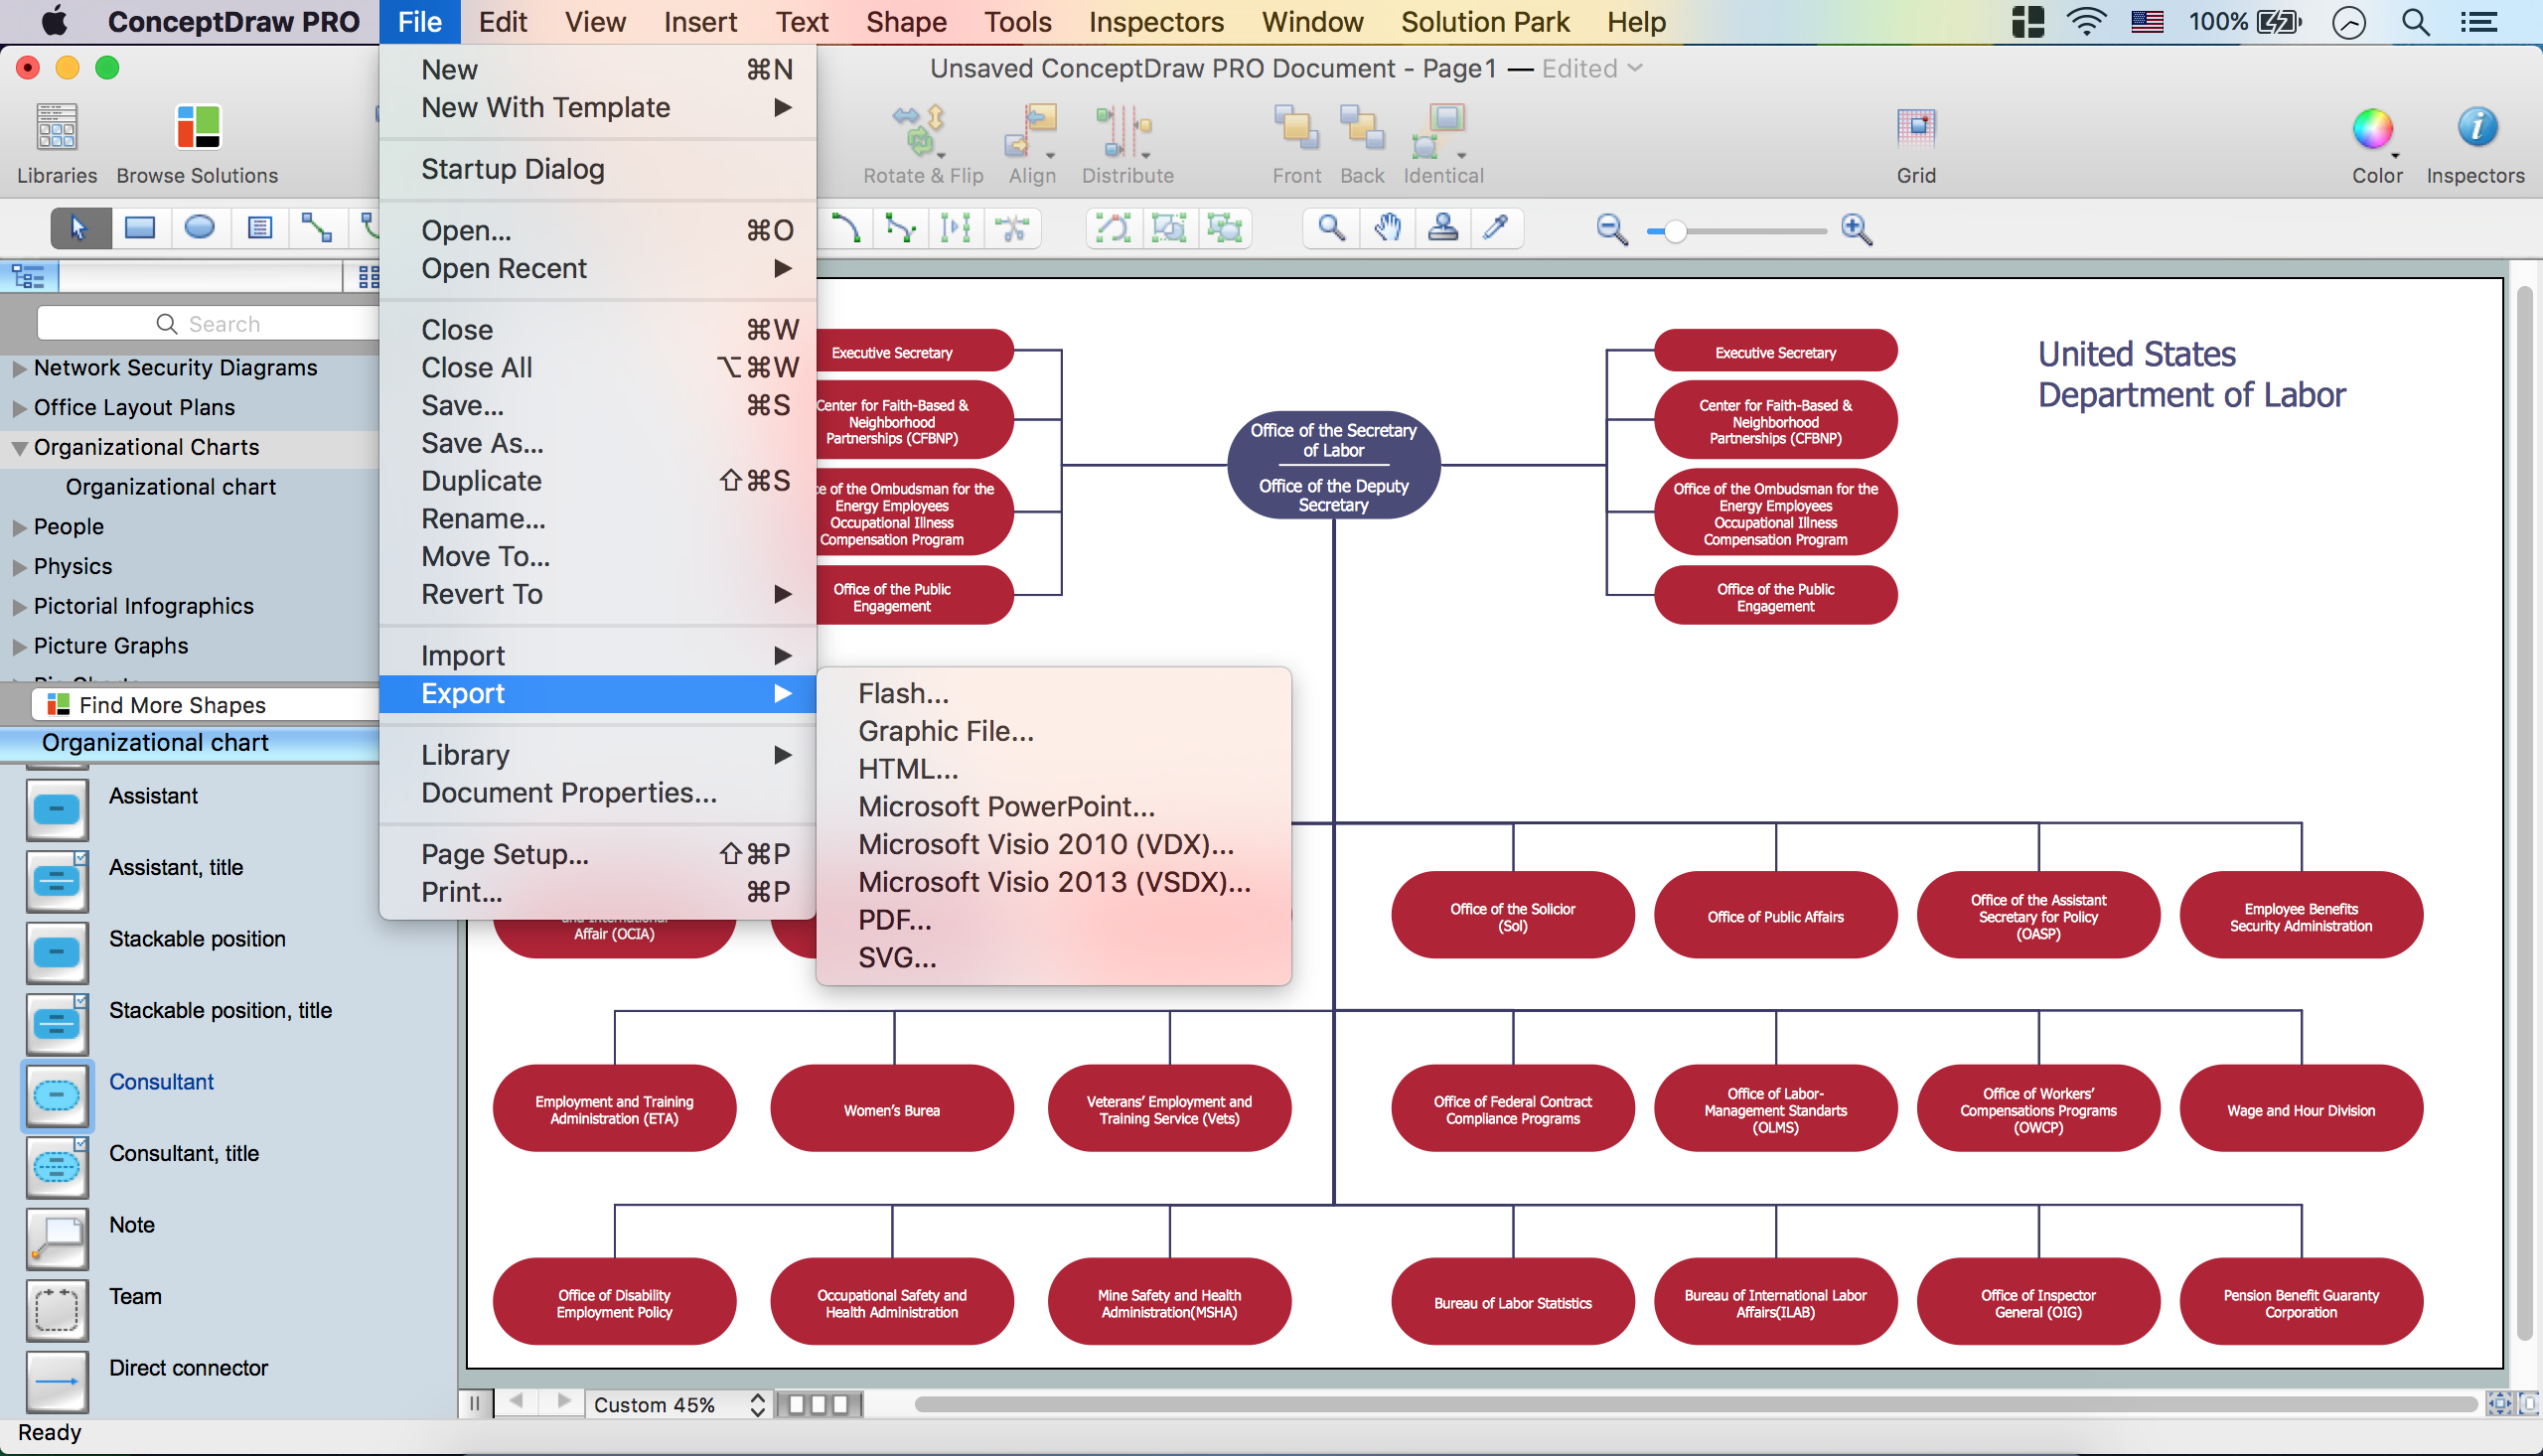
Picture: Create Organizational Chart
Related Solution:
ConceptDraw DIAGRAM extended with Typography Infographics Solution from the “Infographics” Area is a powerful infographic software that offers you variety of infographics examples.
Use of predesigned examples as the base for your own Typography Infographics is a timesaving and useful way. Simply open the desired example, change for your needs and then successfully use it in any field of your activity.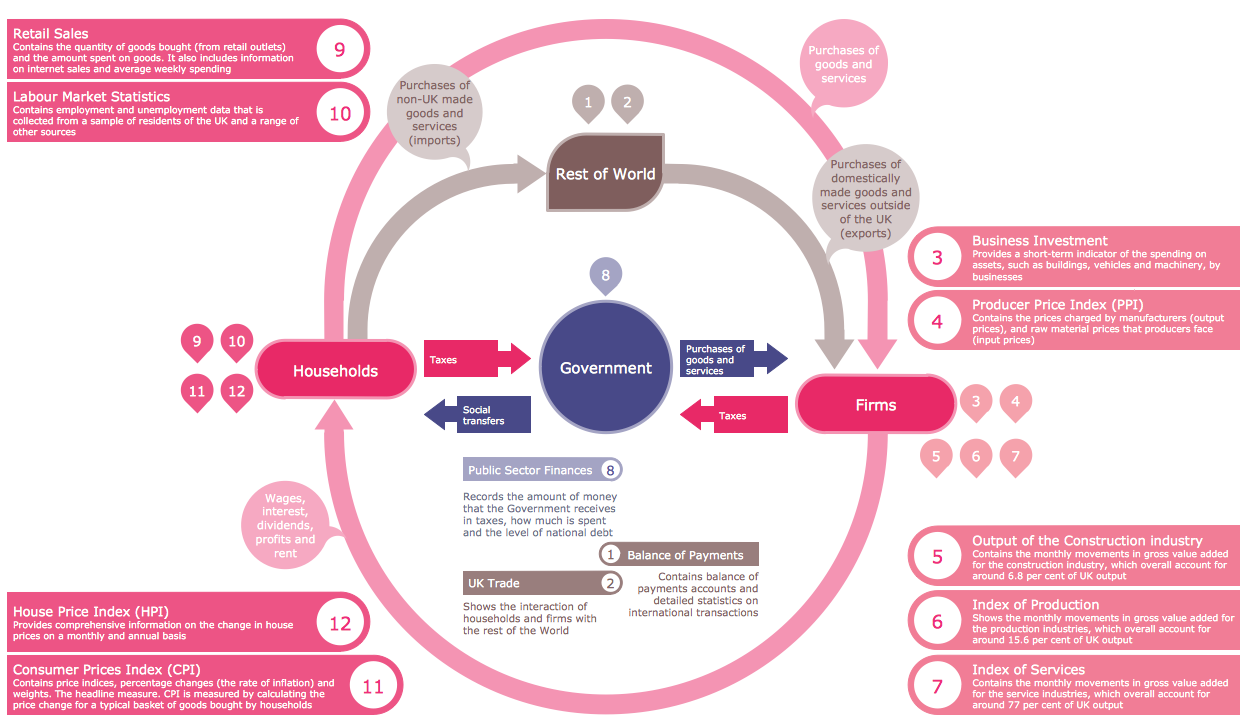
Picture: Typography Infographic Examples
Related Solution:


