How to Create an Infographic
“Infographics are graphic visual representations of information, data or knowledge intended to present complex information quickly and clearly.”
How to Create an Infographic? It’s very easy! All what you need is a powerful infographic software. Never before creation of Infographics wasn’t so easy as now with Typography Infographics Solution from the “Infographics” Area for ConceptDraw Solution Park.

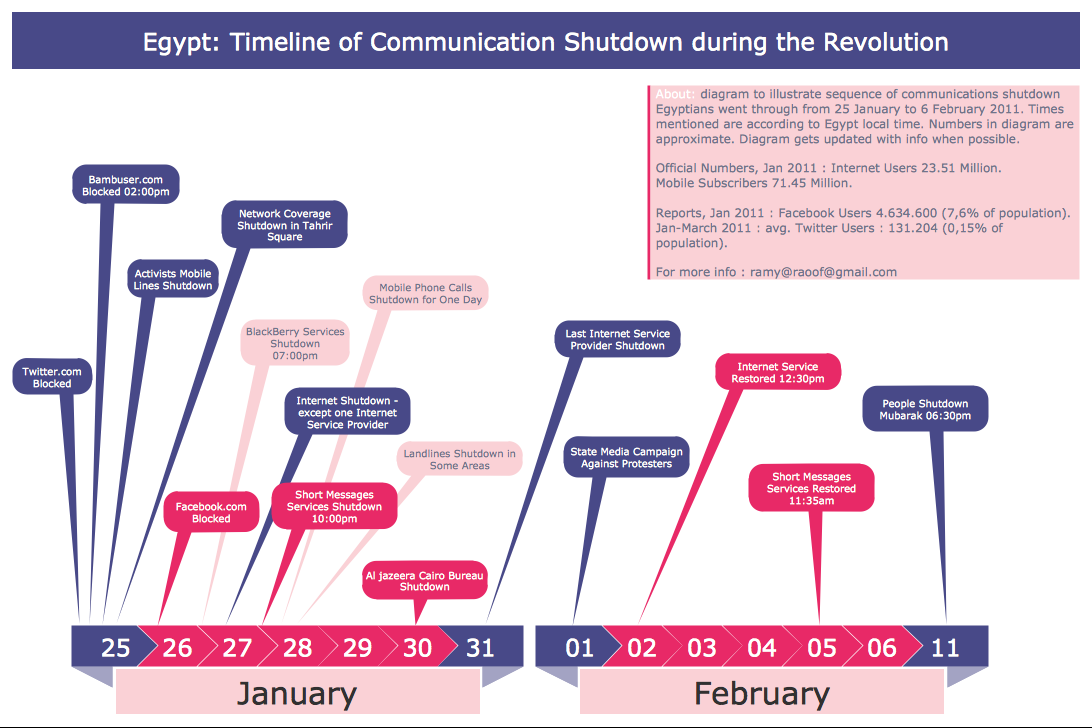
Example 1. How to Create an Infographic
How to Create an Infographic quick and easy? Typography Infographics Solution from the “What is Infographics” Area provides the set of useful tools that will help you create professional looking infographics.

Example 2. Typography Infographics Solution in ConceptDraw STORE
The simplest way is to use the predesigned infographic examples from the Typography Infographics Solution as the base for your own Infographics and change them according to your needs and desires. You can add text, vector objects from the numerous libraries of Typography Infographics Solution, change the font and color design to make your Infographic more beautiful and bright.
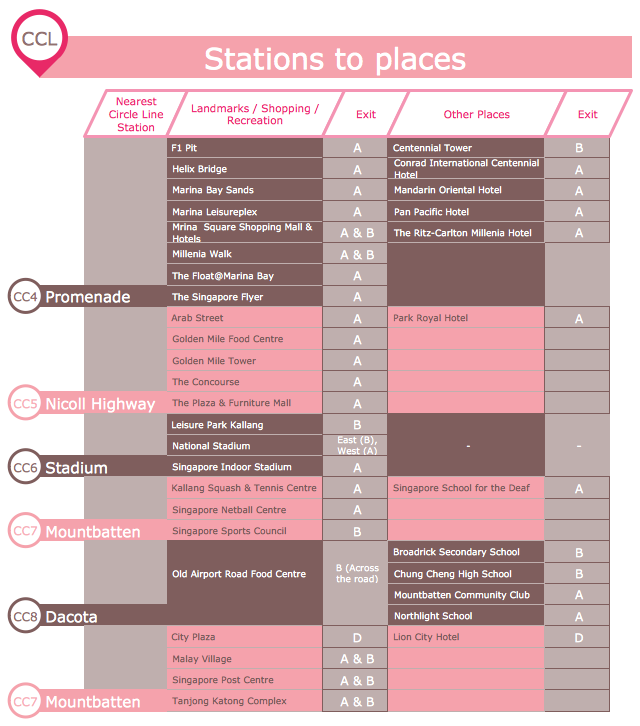
Example 3. Infographics Typography — CCL Stations to Places
This sample was created in ConceptDraw DIAGRAM using the Typography Infographics Solution from the “Infographics” Area and shows the CCL Stations to Places. How is it easy create so complex Infographics using the predesigned vector stencils from the libraries of Typography Infographics Solution. An experienced user spent 20 minutes creating this sample.
Use the Typography Infographics Solution for ConceptDraw DIAGRAM to create your own professional looking and attractive Typography Graphic of any complexity quick, easy and effective.
The Typography Infographics designed with ConceptDraw DIAGRAM are vector graphic documents and are available for reviewing, modifying, converting to a variety of formats (image, HTML, PDF file, MS PowerPoint Presentation, Adobe Flash or MS Visio), printing and send via e-mail in one moment.