Infographic Generator
ConceptDraw DIAGRAM extended with Typography Infographics Solution from the “Infographics” Area is the best Infographic Generator. Make sure in it right now!
Typography Infographics Solution offers you the best numerous collection of predesigned infographics examples and 9 libraries:
- Arrowed Text Blocks
- Bulleted and Numbered Lists
- Callout
- Labels
- Numbers
- Tabbed Text Blocks
- Tables
- Text Blocks
- Titles
with large quantity of ready-to-use vector stencils that will help you design your own Typography Infographics of any complexity in minutes.

Example 1. Typography Infographics — Labels Design Elements
Simply drag the needed objects from the libraries to save your time and create typography graphic quick and easy.
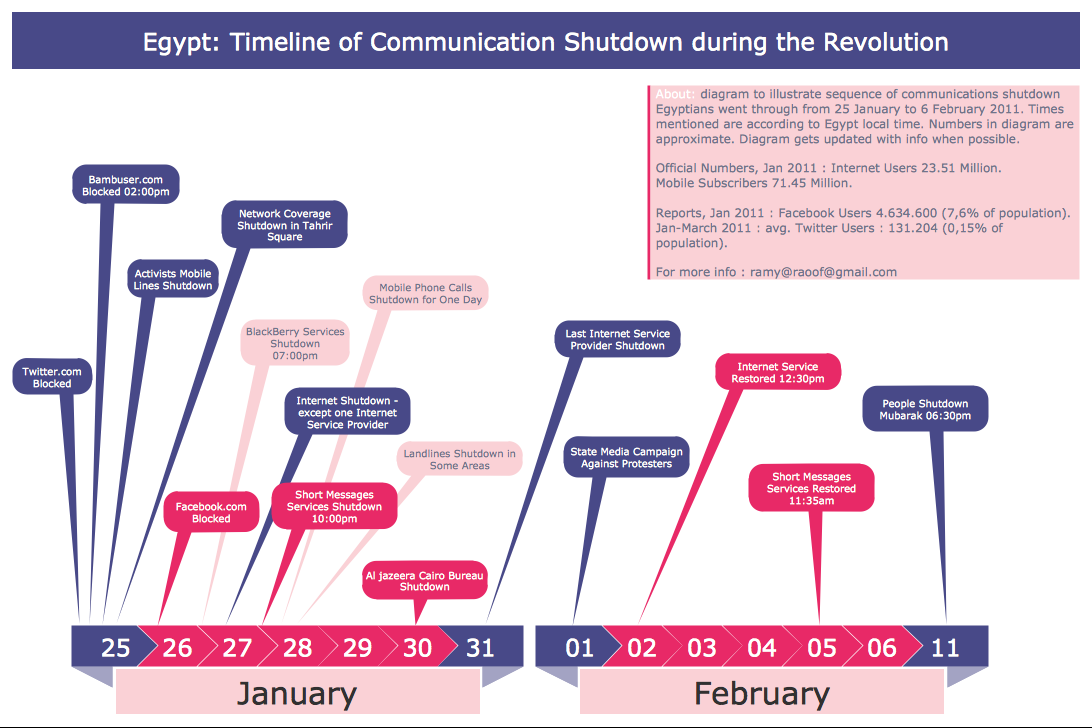
Example 2. Infographic Generator — Egypt Timeline of Communication Shutdown
This sample was created in ConceptDraw DIAGRAM infographic generator using the Typography Infographics Solution from the “Infographics” Area and shows the sequence of Communication Shutdown in Egypt in 2011. Use of callouts is an excellent way for arranging large quantity of information or useful data on the relatively small typography graphic. An experienced user spent 15 minutes creating this sample.
Use the Typography Infographics Solution for ConceptDraw DIAGRAM infographic software to create your own professional looking and attractive Typography Infographics of any complexity quick, easy and effective.
All source documents are vector graphic documents. They are available for reviewing, modifying, or converting to a variety of formats (PDF file, MS PowerPoint, MS Visio, and many other graphic formats) from the ConceptDraw STORE. The Typography Infographics Solution is available for all ConceptDraw DIAGRAM or later users.
TEN RELATED HOW TO's:
The economic calendar is a convenient way to display the economic events, the situation on the financial markets, it is a handy tool to keep track the chronology and dynamics of important events in the economy. But how design an economic calendar? ConceptDraw DIAGRAM extended with Calendars Solution from the Management Area is a useful, convenient and effective software for quick and easy design professional looking and attractive economic calendars.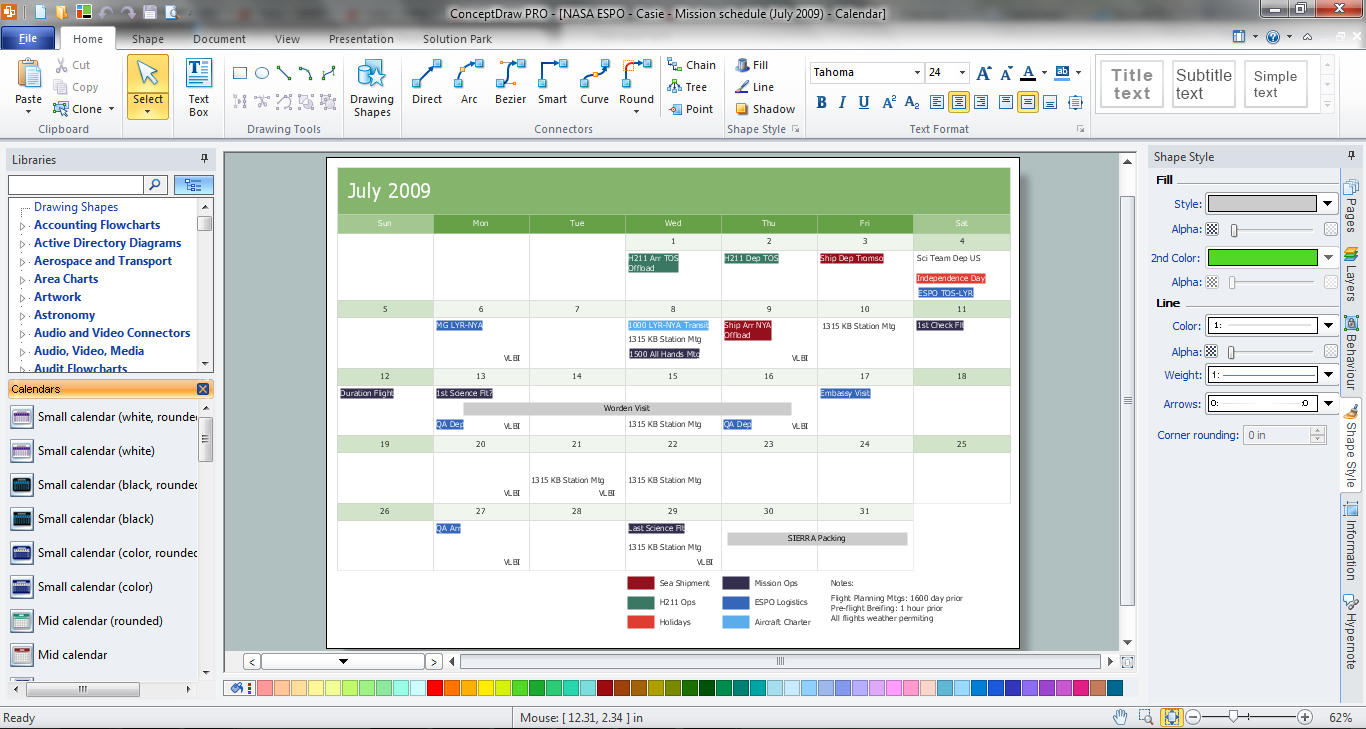
Picture: Economic Calendar
Related Solution:
Learn what a workflow diagram is, how it works, when to use it, and how to create one. See examples, handoffs, approval flows, and workflow diagram best practices.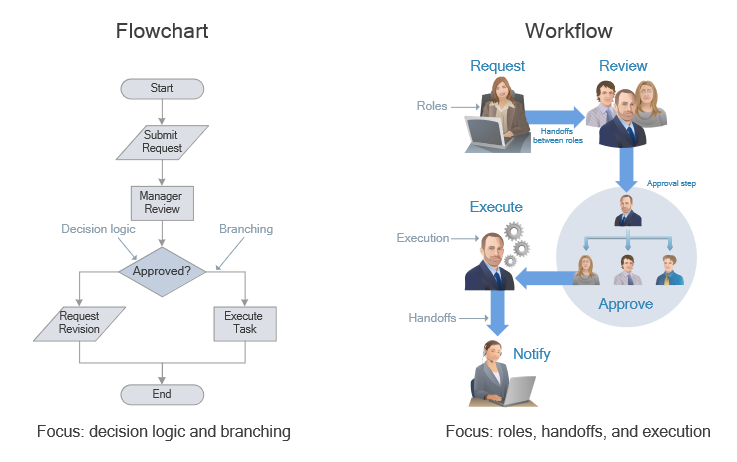
Picture: Workflow Diagram: Definition, Examples, and How to Create
Related Solution:
IT world is extremely rational and logical. So what can be more precise than Software Diagrams to rate the results of work? Visual statistics is the best way to understand the data.
This figure demonstrates the data flow diagram (DFD), which was created to describe the electronic system of custom purchase. This is the process of buying using electronic bar code scanning system. Such systems are used in large stores. The cashier scans the bar code, the system outputs the data on the price of the goods and carries out a purchase process. This DFD utilizes the Gane/Sarson notation. To create it The ConceptDraw DFD solution has been applied.
Picture: Software Diagrams
A software tool that saves your time on making decisions now has the ability to make decisions with remote team via Skype.
Picture: Decision Making Software For Small Business
Related Solution:
This sample shows the Six Markets Model Chart. It was created in ConceptDraw DIAGRAM diagramming and vector drawing software using the Marketing Diagrams Solution from the Marketing area of ConceptDraw Solution Park.
The six markets model defines six markets that take the central place in the relationship marketing: internal markets, supplier markets, recruitment markets, referral markets, influence markets and customer markets. The six markets model allows the organization to analyze the stakeholders and key market domains that can be important to it.
Picture: Six Markets Model Chart
Related Solution:
Flowcharts visualize a process or algorithm of program as step/operation blocks of various shapes connected with arrowed lines showed the process flow direction. They are used to visualize business or technical processes and software algorithms.
Conceptdraw DIAGRAM - feature-rich flowchart software. It will allow you to create professional looking flowcharts.
Picture: Best Flowcharts
Related Solution:
Working with information can be quite tedious, furthermore, some data can be quite difficult to perceive without any graphic representation. So, to facilitate your work, you can use business diagrams, such as simple flowcharts or Gantt charts for project management and orgcharts for clarifying your company structure. You can use a proper software, like ConceptDraw Pro, draw them on paper, or use whiteboards, but it is more convenient to use a digital tool.
This diagram shows a cross-functional flowchart that was made fore telecom service provider. A workflow of a common telecommunication service provider has a rather branched structure. Thus, it is useful to have a flow chart to visualize the sequences and interrelations of the work flow steps. Business process flowchart contains 17 processes and 4 decision points,that are distributed through 2 lines depicting the participants involved. Also there are connectors that show the data flow within processes. This flowchart displays a detailed model of the telecom service trading process, as well as all participants in the process and how they interact with each other.
Picture: Business diagrams & Org Charts with ConceptDraw DIAGRAM
The Soccer (Football) Fields library from the Soccer solution from the Sport area of ConceptDraw Solution Park provides a complete set of predesigned fields: horizontal and vertical located, colored or not, end zone view soccer field.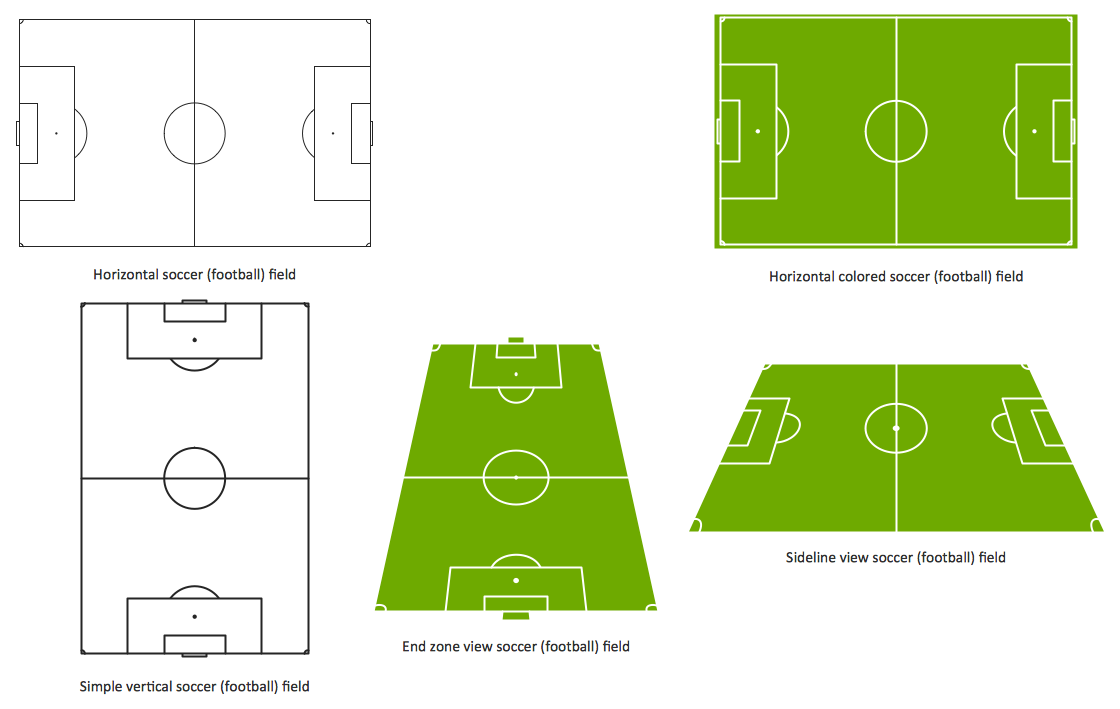
Picture: Design a Soccer (Football) Field
Related Solution:
If you need to describe some process, diagramming is a perfect tool for almost any imaginable purpose. The set of the most commonly used flow charts symbols is quite wide and includes symbols for operations, processes, data inputs and outputs. You can see the full list of all the symbols used for flowcharting in Flowcharts solution from Diagrams area in ConceptDraw Solution Park.
A flow chart is often used for visual representation of a sequential process flow. The flowchart approach to any process is to divide it into some sequential actions. What makes a flow chart so popular and clear to make out is the set of standard flowchart symbols that has the same reading independently from processes described with their applying. The current drawing represents the vector library containing the pack of standard flowchart symbols. This library is supplied with ConceptDraw Flowcharts solution.
Picture: Flow Chart Symbols
Related Solution:
Illustrate the Asia continent and explore its parts, geographical features, resources, and economic development through designing various kinds of colorful Asia maps and using them in presentations, reports, educational materials, websites, business documents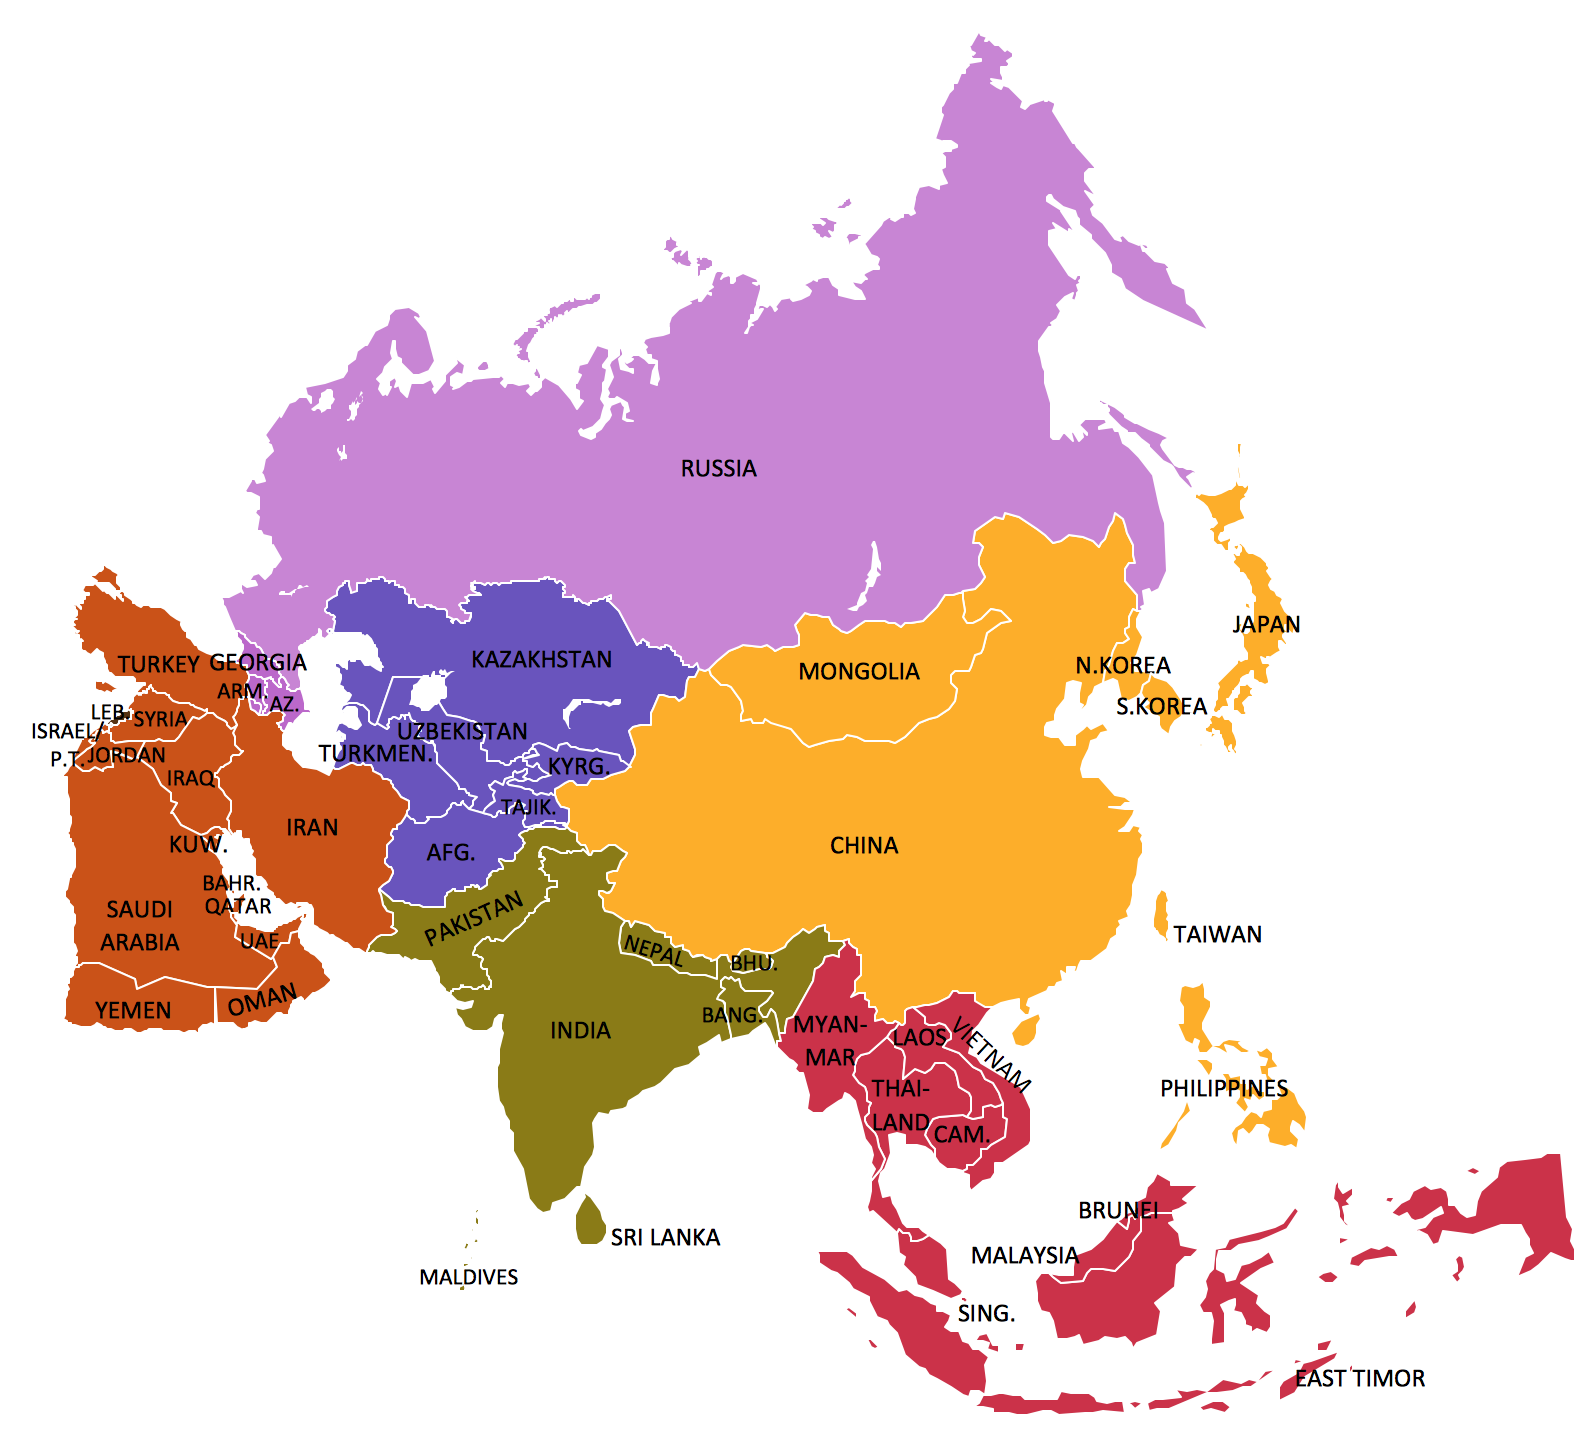
Picture: Geo Map — Asia
Related Solution:
