
Example 1. Pictures of Graphs — 2007 top 10 countries by military expenditure PPP
Picture Graphs Solution provides collection of predesigned templates, samples, examples of the pictures of graphs which you can see in ConceptDraw STORE. They were designed specially for ConceptDraw DIAGRAM users and are available for viewing and editing.

Example 2. Pictures of Graphs - Barrie population
Picture Graphs solution includes also the Picture Graphs library with predesigned vector objects which will help you create fast and easy your own professional looking, visual, colorful pictures of graphs and then successfully use them.

Example 3. Pictures of Graphs — Population growth by continent
The pictures of graphs you see on this page were created in ConceptDraw DIAGRAM using the vector objects from the Pictures Graphs library of Pictures Graphs Solution. These samples demonstrate the solution's capabilities and the professional results you can achieve. An experienced user spent 5 minutes creating every of these samples.
All source documents are vector graphic documents. They are available for reviewing, modifying, or converting to a variety of formats (PDF file, MS PowerPoint, MS Visio, and many other graphic formats) from the ConceptDraw STORE. The Pictures Graphs Solution is available for all ConceptDraw DIAGRAM or later users.
TEN RELATED HOW TO's:
All Gantt charts were made using ConceptDraw PROJECT. ConceptDraw PROJECT works both on Windows and Mac OS X. It allows to schedule a voluntary number of projects in a single Workspace document and lets easily share tasks and resources among them. ConceptDraw PROJECT shares files among Windows and Mac OS X.
Picture: Gantt chart examples
ConceptDraw DIAGRAM diagramming and vector drawing software extended with Area Charts solution is the best for drawing the Area Charts simply and fast.
Picture: Area Charts
Related Solution:
Any business process consists from a number of tasks carrying out the certain business goal. It is useful to diagram business processes to ensure that they are as foolproof, logical and sequential as possible. This business process diagram describes a typical booking process flow by the example of a cab booking process. It can be used as a roadmap for any booking system implementation. Diagramming a business process allows you to look at the entire project and take into account all types of possible scenarios. Business process diagram helps you investigate and clarify the process thoroughly so that you can find out how it can be improved. Business process diagram supports team communications by ensuring that each process element is clear and everyone in the team is on the same page.
Sometimes your company brings you less profit than you expect it to be, and it’s difficult to reveal the causes. Maybe it’s time to learn new technologies, because business diagram are easily developed by means of special software, so you won’t make any extra effort. In return, you will increase your productivity and get more done in a less time.
Picture: Business Diagram Software
Related Solutions:
A pie chart or a circle graph is a circular chart divided into sectors, illustrating numerical proportion. In a pie chart, the arc length of each sector and consequently its central angle and area, is proportional to the quantity it represents.
Pie chart examples and templates created using ConceptDraw DIAGRAM software helps you get closer with pie charts and find pie chart examples suite your needs.
Picture: Pie Chart Examples and Templates
Related Solution:
ConceptDraw DIAGRAM can help you make professional diagrams quickly.
Picture: Best Software to Draw Diagrams
Related Solution:
The ConceptDraw DIAGRAM Planogram Software and Retail Plan Software offers powerful tools of Enterprise Architecture Diagrams Solution for visualization the market analysis and easy making successful Retail Plans and Planograms with useful detailed recommendations about placing products and optimization the shelf space.
Picture: Planogram Software and Retail Plan Software
Related Solution:
This sample was created in ConceptDraw DIAGRAM diagramming and vector drawing software using the Bar Graphs Solution from Graphs and Charts area of ConceptDraw Solution Park. It is Bar Graphs example, Sales Growth example, Column Chart Example - Sales Report.
Picture: Sales Growth. Bar Graphs Example
Related Solution:
Create a Line Chart with ConceptDraw using our tips. Here you can find an explanation of how to create a line chart quickly.
Picture: How to Create a Line Chart
Related Solution:
Visual information is easier to perceive. You can teach even a child to make diagrams with a good flowchart example that would be interesting for it. Flowcharts can be fun, it’s not about business processes or programming algorithms.
This flowchart shows step by step process of manufacturing of Nixtamal The product which is obtained by processing maize with calcium hydroxide. We must assume that the Aztecs were very fond of this product, if the recipe of its production came to our times. This flow chart was designed using ConceptDraw DIAGRAM with its solution for designing flowcharts of various types, sizes and purposes. ConceptDraw Flowcharts solution consists from the library of flowchart symbols, containing the set vector objects. Also there are a lot of diverse templates and samples of flow charts.
Picture: Flowchart Examples and Templates
Related Solution:
The vector stencils library Norway contains contours for ConceptDraw DIAGRAM diagramming and vector drawing software. This library is contained in the Continent Maps solution from Maps area of ConceptDraw Solution Park.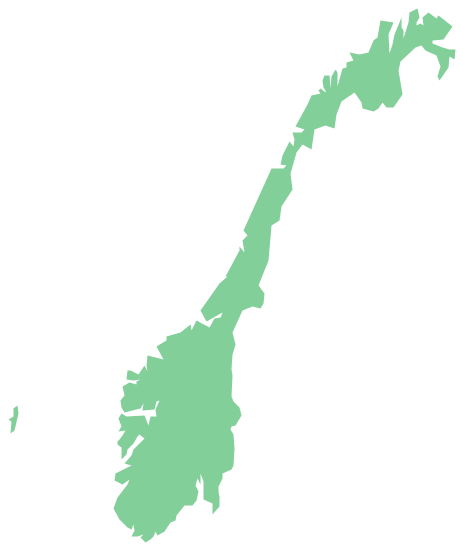
Picture: Geo Map - Europe - Norway
Related Solution:

