
Example 1. Fault Tree Diagram - Accident Analytic Tree
Fault Tree Analysis Diagrams Solution was specially designed to give you the opportunity to create any Fault Tree Diagram in minutes. It provides the extensive drawing tools, library with 14 predesigned vector shapes, ready to fill template and large collection of professionally designed samples.

Example 2. Fault Tree Analysis Diagrams Solution in ConceptDraw STORE
All samples and templates of Fault Tree Analysis Diagrams Solution are available for changing and further successful using from ConceptDraw STORE. You can choose any desired Fault Tree Diagram sample from the offered that meets your requirements and change it for your needs.

Example 3. Code Fault Tree Diagram
The Fault Tree Diagram samples you see on this page were created in ConceptDraw DIAGRAM using the Fault Tree Analysis Diagrams Solution. These samples are detailed Fault Tree Diagrams which successfully demonstrate solution's capabilities and professional results you can achieve. An experienced user spent 15 minutes creating each of them.
Use the Fault Tree Analysis Diagrams Solution for ConceptDraw DIAGRAM software to create your own Fault Tree Analysis Diagrams of any complexity quick, easy and effective.
All source documents are vector graphic documents. They are available for reviewing, modifying, or converting to a variety of formats (PDF file, MS PowerPoint, MS Visio, and many other graphic formats) from the ConceptDraw STORE. The Fault Tree Analysis Diagrams Solution is available for all ConceptDraw DIAGRAM or later users.
TEN RELATED HOW TO's:
Electrical plan is a document that is developed during the first stage of the building design. This scheme is composed of conventional images or symbols of components that operate by means of electric energy. To simplify the creation of these schemes you can use house electrical plan software, which will not require a long additional training to understand how to use it. You only need to install the necessary software ant it’s libraries and you’ll have one less problem during the building projection.
Any building contains a number of electrical systems, including switches, fixtures, outlets and other lightening equipment. All these should be depicted in a building electrical plans and included to general building documentation. This home electrical plan displays electrical and telecommunication devices placed to a home floor plan. On the plan, each electrical device is referenced with the proper symbol. Electrical symbols are used for universal recognition of the building plan by different persons who will be working on the construction. Not all possible electric symbols used on a certain plan, so the symbols used in the current home plan are included to a legend. The electrical home plan may be added as a separate document to a complete set of building plans.
Picture: How To use House Electrical Plan Software
Related Solution:
Any hierarchical structure of any company can be represented as a triangle or a pyramid. You can create a pyramid diagram and pyramid chart of any complexity using special libraries included in ConceptDraw DIAGRAM. Actually, any knowledge or chain of facts can also be depicted as a pyramid.
A wide range of graph and chart are utilized in marketing to maintain documentation and various visual issues, that deal with marketing information and data. The marketing value pyramid can be created to illustrate how the value of company, or product is based on its competitiveness. To design this diagram we used ConceptDraw DIAGRAM drawing tools in conjunction with Pyramid solution for Solution Park.
Picture: Pyramid Diagram and Pyramid Chart
Related Solutions:
If neither of 45 vector shapes of the Cross-Functional Flowcharts solution don't fit your needs, you will want to learn How to create a unique Cross-Functional flowchart.
ConceptDraw Arrows10 Technology - This is more than enough versatility to draw any type of diagram with any degree of complexity.
Drawing software lets you to make horizontal and vertical, audit, opportunity and many more flowcharts.
Picture: How to Create a Cross Functional Flow Chart
ConceptDraw DIAGRAM software extended with Fishbone Diagrams solution from the Management area of ConceptDraw Solution Park is perfect for Cause and Effect Diagram creating. It gives the ability to draw fishbone diagram that identifies many possible causes for an effect or a problem. Causes and Effects are usually grouped into major categories to identify these sources of variation. Causes and Effects in the diagram show relationships among various factor. Fishbone diagram shows factors of Equipment, Process, People, Materials, Environment and Management, all affecting the overall problem.
Picture: Cause and Effect Diagram
Related Solution:
ConceptDraw PROJECT is an effective tool for new and experienced users with a fine balance of usability and powerful functionality.
Picture: ConceptDraw PROJECT Software Overview
How to design landscape? You can draw it by hand on a sheet of paper, but for this you need to know the bases of the perspective, you need to have good artistic abilities and to know how to depict the natural elements. But it is much easier and convenient to use the modern ConceptDraw DIAGRAM diagramming and vector drawing software extended with Landscape & Garden Solution from the Building Plans Area.
Picture: How to Design Landscape
Related Solution:
Architectural drawing allows to show the location of a building or ensemble of buildings on the ground, indicating the cardinal points. For centuries, people had been studying architecture in universities to learn how to draw building plans and now everyone can do it easily just using appropriate software. While developing the building plan, its graphic part, you can display the part of the floor or the entire floor of a building with an indication of the exact location of the drawn premise.
Small-sized apartments does not restrict the advanced interior design opportunities. Here is a detailed and precise floor plan of a pretty small apartment. A furniture objects are added to show possible interior of this home. This plan can be used to help somebody with a floor layout and furniture arrangement. Having this floor plan in a pocket while shopping would be useful to check if there is enough rooms for a new furniture.
Picture: How To Draw Building Plans
Related Solution:
ConceptDraw DIAGRAM diagramming and vector drawing software enhanced with Network Security Diagrams Solution from the Computer and Networks Area of ConceptDraw Solution Park is the best for effective design professional, colorful and attractive Network Security Diagram of any complexity and degree of detailing.
Picture: Network Security Diagram
Related Solution:
Creating diagrams and schemes is a pleasure with proper software. You don’t need any additional skills to create organizational chart quick and effectively with our diagramming tool. Create your ConceptDraw account today and start your diagramming experience.
This is the most regular type of organizational chart - hierarchical. It is created using the ConceptDraw Organizational Charts solution. Its composition can be displayed as a pyramid, with an only person in authority at the top, with sub-levels of management below them. According to hierarchy, an employee communicates only to his immediate head or subordinates. A hierarchical organizational structure may be choice for a businesses that work on multiform markets or any other organization that has a workflow requiring a multilevel structure of middle management.
Picture: Create Organizational Chart
Related Solution:
Network Security Architecture Diagram visually reflects the network's structure and construction, and all actions undertaken for ensuring the network security which can be executed with help of software resources and hardware devices. You dream to find powerful software for easy designing Network Security Architecture Diagram? We recommend to use ConceptDraw DIAGRAM extended with Network Security Diagrams Solution from the Computer and Networks Area of ConceptDraw Solution Park.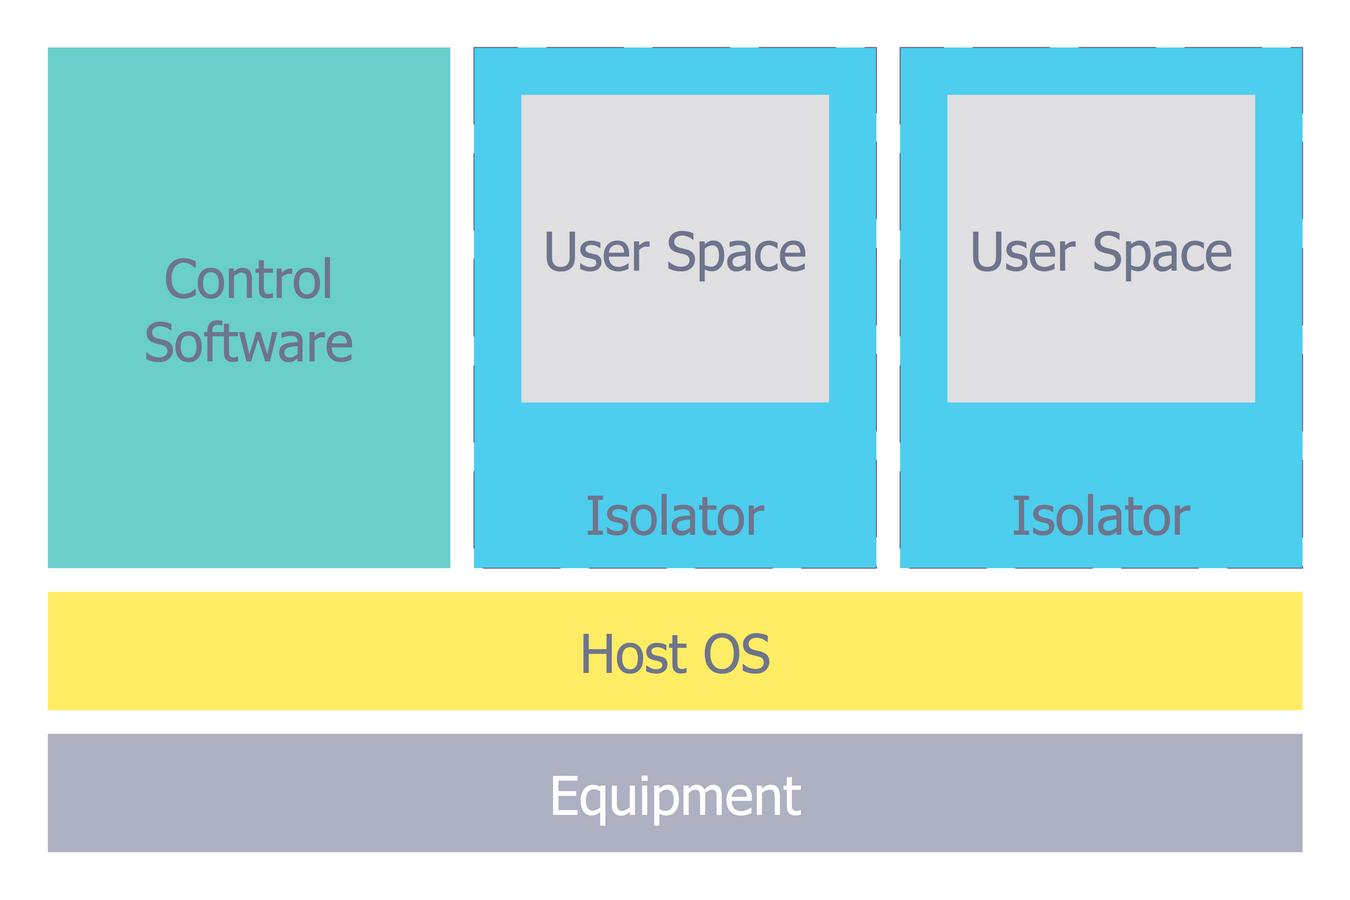
Picture: Network Security Architecture Diagram
Related Solution:

