Using the libraries of the Rapid UML Solution for ConceptDraw DIAGRAM you can create your own visual vector UML diagrams quick and easy.
TEN RELATED HOW TO's:
ConceptDraw DIAGRAM is a powerful diagramming and vector drawing software. Extended with AWS Architecture Diagrams Solution from the Computer and Networks Area, ConceptDraw DIAGRAM now is ideal software for Amazon Web Services diagrams drawing.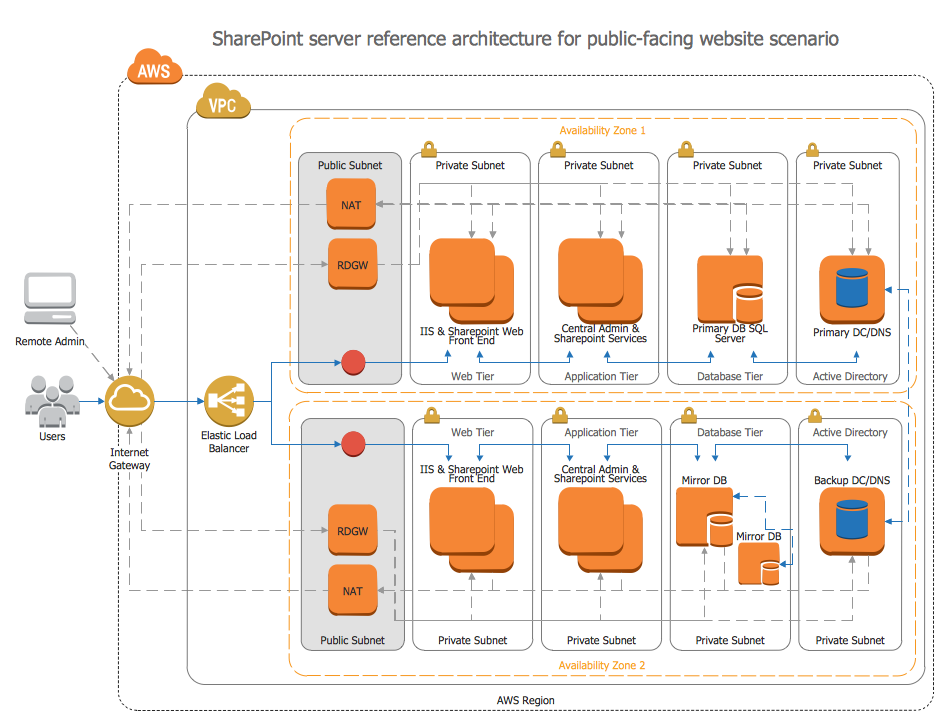
Picture: Amazon Web Services
Related Solution:
You need design the Functional Block Diagram and dream to find the useful tools to draw it easier, quickly and effectively? ConceptDraw DIAGRAM offers the Block Diagrams Solution from the Diagrams Area which will help you!
Picture: Functional Block Diagram
Related Solution:
There are a lot of tutorials that get you familiar with emergency situations. If you want to know how to create emergency plans and fire evacuation schemes then you must be concerned about safety. There is a list of rules that you should follow to set the fire safety equipment properly.
Discover this precise and accurate fire emergency evacuation plan. This sample drawing demonstrate facilities of ConceptDraw DIAGRAM together with its Fire and Emergency Plans solution. The evacuation plan is designed to provide employees and visitors with a map depicting the ways they may use to escape the building in emergency situations. The telephone sets, first aid boxes and extinguisher are also marked on this plan. The evacuation plan should contain a legend for readers. The similar plans are commonly hang on the wall on the building's floors.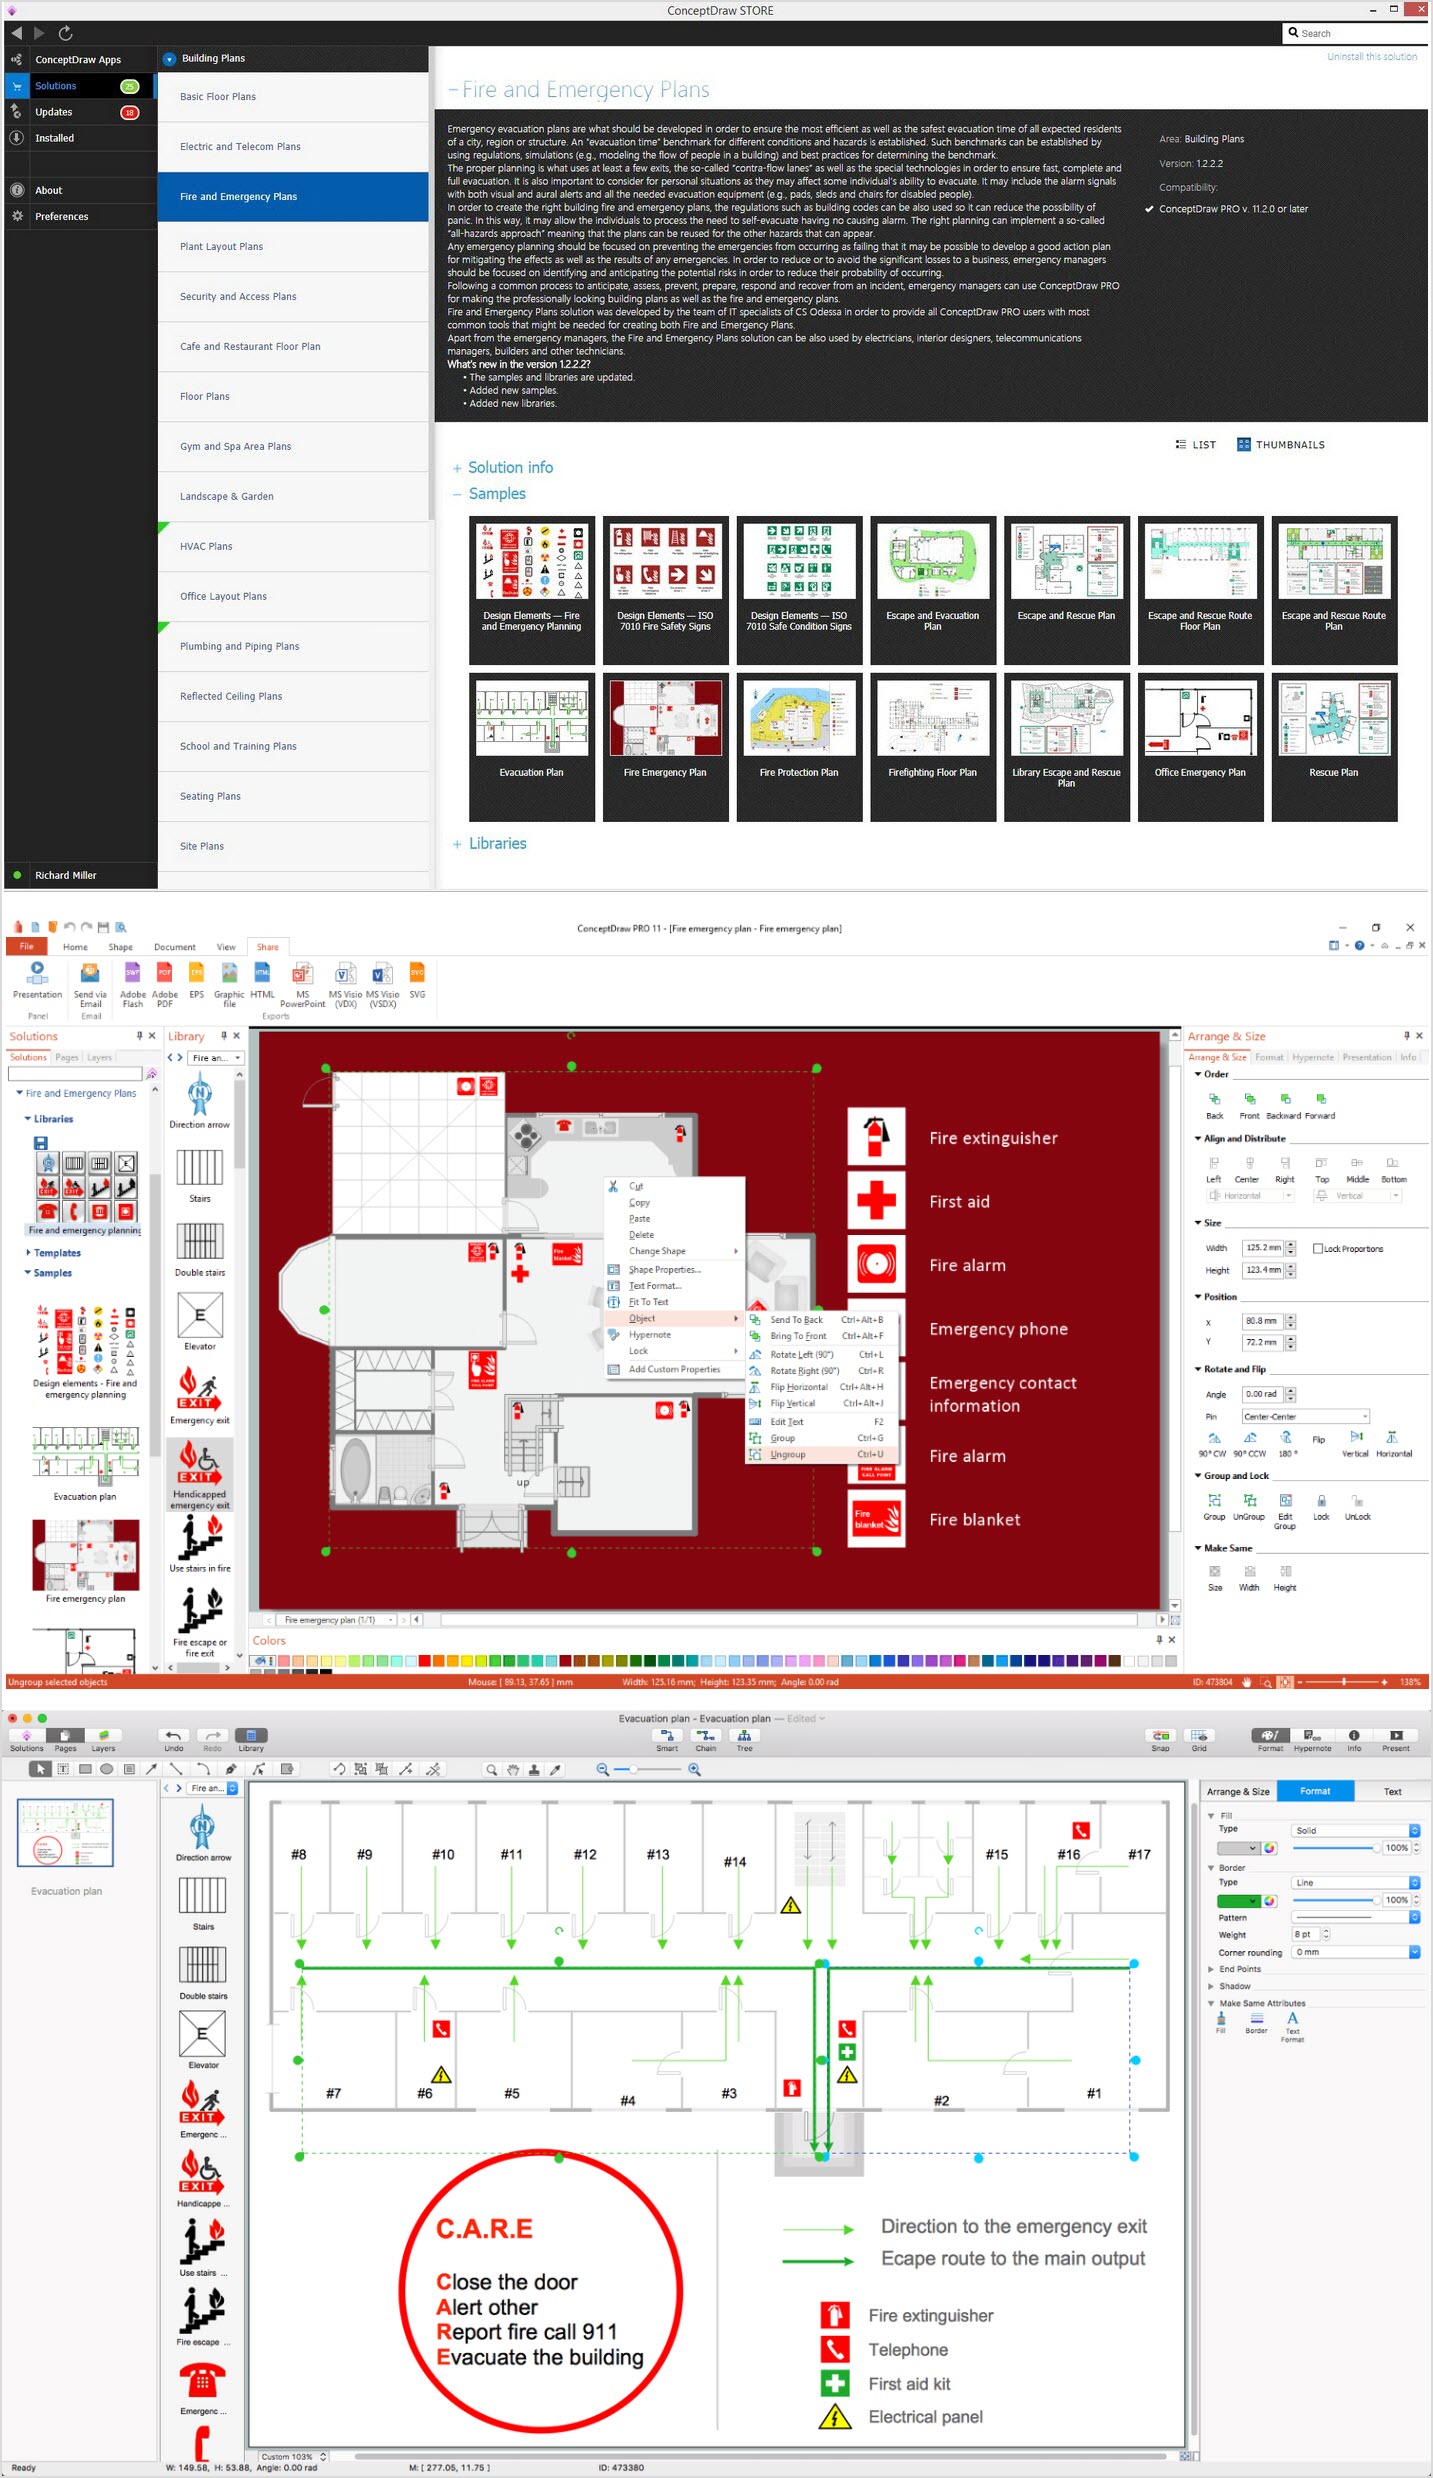
Picture: How To Create Emergency Plans and Fire Evacuation
Related Solution:
There are many ways to track the system in a critical situation. To model a system behavior, uml notation is widely used. Usually, an UML diagram consists of elements such as actor and a case.
This diagram represents the structure of UML notations. Unified Modeling Language (UML) is used in software engineering to depict graphically the software modeling process. UM Language uses graphic notations for developing models of object-oriented systems. These notations displays requirements, sub-systems, logical and physical elements, etc. We created this diagram using ConceptDraw DIAGRAM reinforced with Rapid UML solution. It can be helpful for students on software engineering, when learning UML.
Picture: UML Notation
Related Solution:
The ConceptDraw vector stencils library Cisco IBM contains equipment symbols for drawing the computer network diagrams.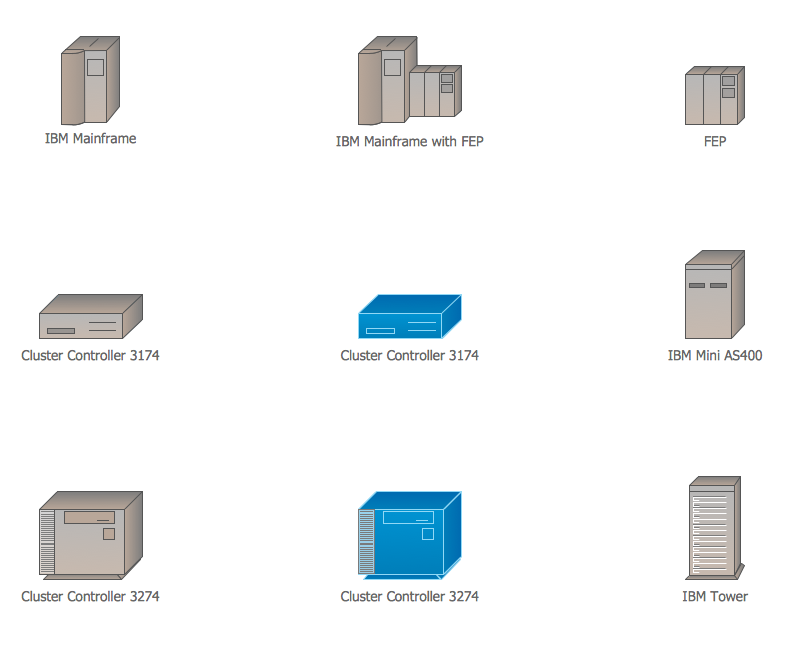
Picture: Cisco IBM. Cisco icons, shapes, stencils and symbols
Related Solution:
It's obvious that any building has a plan, and it is a hard and diligent work to draw one. And it's great that nowadays there are software tools for those purposes. For instance, ConceptDraw Pro contains design elements depicting different parts of sport fields. It's easy to use them and it facilitates your work exponentially.
Planning of athletic facilities, playgrounds and Leisure Centers, needs thoughtful and creative approach. Any layout regarding to sport facilities should satisfy the requirements of both athletes and spectators. Well designed sport fields , playgrounds and recreation spaces attract people to sport activities in the cities and countryside. ConceptDraw Sport Field Plans solution is useful and convenient professional drawing tool. It delivers the kit of vector libraries that can be used for representing sport fields, sportgrounds and recreation spaces: football, hockey, volleyball, cricket, basketball , swimming pool, etc.
Picture: Building Drawing Software for Design Sport Fields
Related Solution:
UML Interaction Overview Diagram schematically shows a control flow with nodes and a sequence of activities that can contain interaction or sequence diagrams.
Picture: Interaction Overview Diagram
An abstract representation is usually the first thing you will need while developing a database. To understand the ways that databases are structured, you should look through entity-relationship diagram examples and see the notations features and attributes. With an entity-relationship model you can describe a database of any complexity.
This Entity-relationship diagram is a tool for software developers. It enables every element of database to be managed, communicated and tested before release. This ERD was created using symbols advocated by Chen's notation. Because of a linguistic origin of the Chen’s notation, the boxes representing entities could be interpreted as nouns, and the relationships between them are in verb form, shown on a diagram as a diamond.
Picture: Entity Relationship Diagram Examples
Related Solution:
Credit Card Processing System UML Diagram. This sample shows the Use Case Diagram of the credit card processing system. You can see how the payment by credit card occurs. This sample can be used by the bank, financial enterprises, for understanding the work of the credit card processing system at the projecting the banking systems.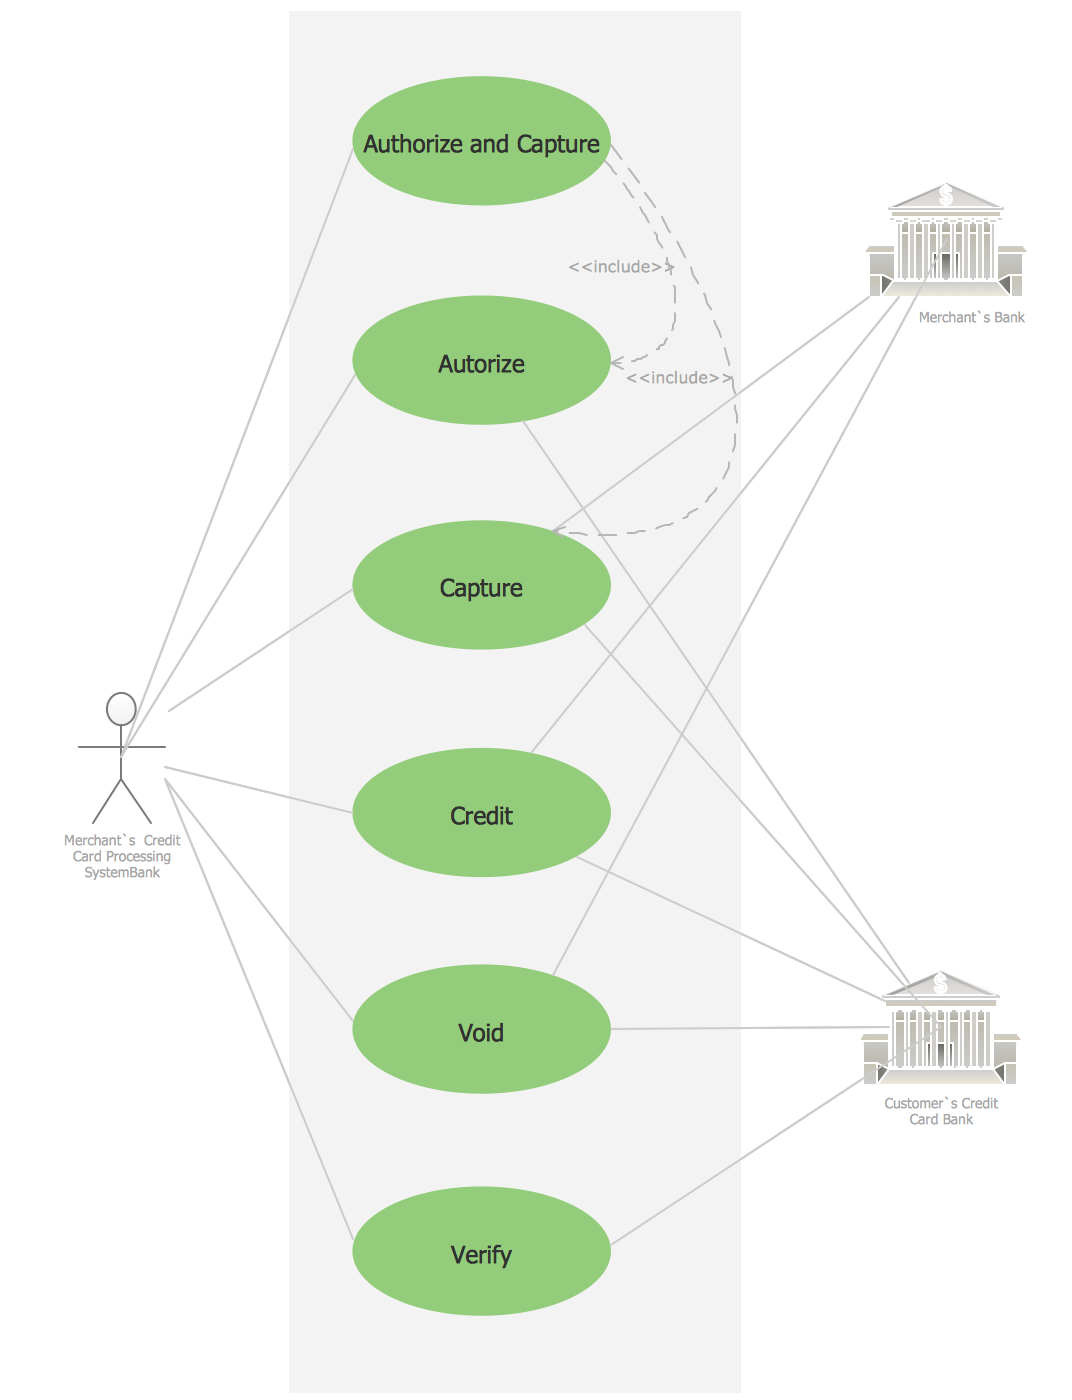
Picture: Credit Card Processing System UML Diagram
Related Solution:
ConceptDraw DIAGRAM is a professional diagramming and vector drawing software. Now, enhanced with SysML Solution from the Software Development Area of ConceptDraw Solution Park, ConceptDraw DIAGRAM became an ideal software for model based systems engineering (MBSE).
Picture: Model Based Systems Engineering
Related Solution:
