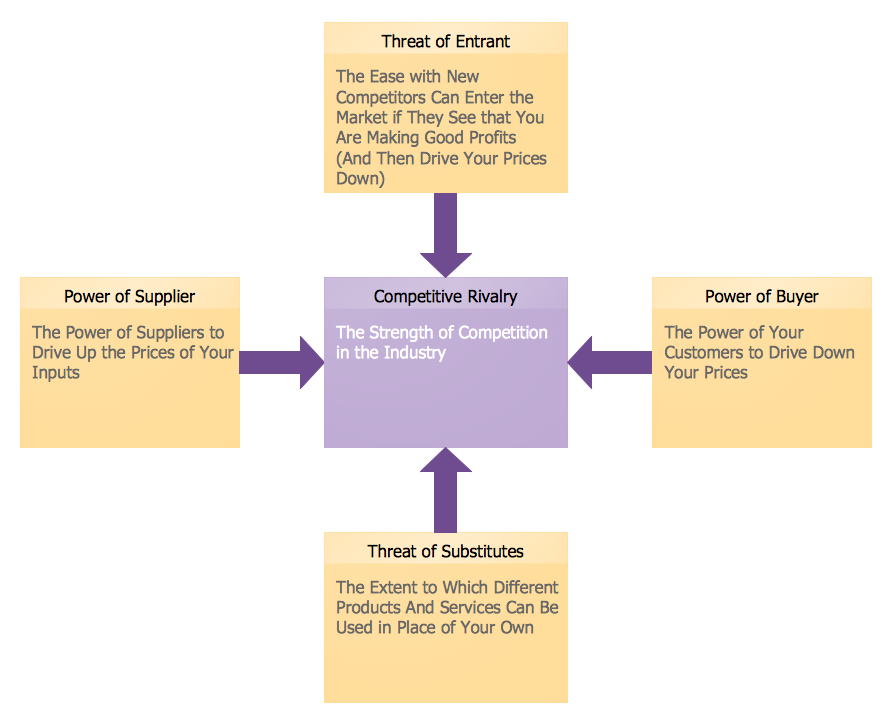
Example 1. Marketing Charts - Five Forces Model Diagram
Marketing Diagrams Solution offers you great number of useful tools for comfortable drawing Marketing Charts. First of all it is the Marketing Diagrams library with its variety of predesigned vector objects, then it is collection of various ready-to-use templates.
Fill the desired template to get the excellent result in mere minutes. You can also use ready samples offered by Marketing Diagrams solution in ConceptDraw STORE as the base or as the source of inspiration for your own Marketing Charts.

Example 2. Marketing Charts - Decision Tree
The following features make ConceptDraw DIAGRAM the best Marketing Charts Design Software:
- You don't need to be an artist to draw professional looking diagrams in a few minutes.
- Large quantity of ready-to-use vector objects makes your drawing charts quick and easy.
- Great number of predesigned templates and samples give you the good start for your own marketing charts.
- ConceptDraw DIAGRAM provides you the possibility to use the grid, rules and guides. You can easily rotate, group, align, arrange the objects, use different fonts and colors to make your diagram exceptionally looking.
- All ConceptDraw DIAGRAM documents are vector graphic files and are available for reviewing, modifying, and converting to a variety of formats: image, HTML, PDF file, MS PowerPoint Presentation, Adobe Flash, MS Visio.
- Using ConceptDraw STORE you can navigate through ConceptDraw Solution Park, managing downloads and updates. You can access libraries, templates and samples directly from the ConceptDraw STORE.
- If you have any questions, our free of charge support is always ready to come to your aid.
TEN RELATED HOW TO's:
Relative value is a value measured in the terms of liquidity, risks, return of one investment or financial instrument relative to another.
Relative values are widely used in:business, economics, investment, management, marketing, statistics, etc.
ConceptDraw DIAGRAM software is the best for drawing professional looking Relative Value Charts. ConceptDraw DIAGRAM provides Divided Bar Diagrams solution from the Graphs and Charts Area of ConceptDraw Solution Park.
Picture: Relative Value Chart Software
Related Solution:
Why do you need a business process flow diagram? How to use business process diagram software? Explore ✔️ the significance, ✔️ creation process, and ✔️ discover cutting-edge software solutions designed to streamline and optimize your workflows
Picture: Business Process Workflow Diagrams & Software
Related Solution:
While creating flowcharts and process flow diagrams, you should use special objects to define different statements, so anyone aware of flowcharts can get your scheme right. There is a short and an extended list of basic flowchart symbols and their meaning. Basic flowchart symbols include terminator objects, rectangles for describing steps of a process, diamonds representing appearing conditions and questions and parallelograms to show incoming data.
This diagram gives a general review of the standard symbols that are used when creating flowcharts and process flow diagrams. The practice of using a set of standard flowchart symbols was admitted in order to make flowcharts and other process flow diagrams created by any person properly understandable by other people. The flowchart symbols depict different kinds of actions and phases in a process. The sequence of the actions, and the relationships between them are shown by special lines and arrows. There are a large number of flowchart symbols. Which of them can be used in the particular diagram depends on its type. For instance, some symbols used in data flow diagrams usually are not used in the process flowcharts. Business process system use exactly these flowchart symbols.
Picture: Flowchart Symbols: Meaning and Examples
Related Solution:
Learn the most common process flowchart symbols used in business process diagrams and workflow charts. Includes symbol meanings, examples, and a practical reference table.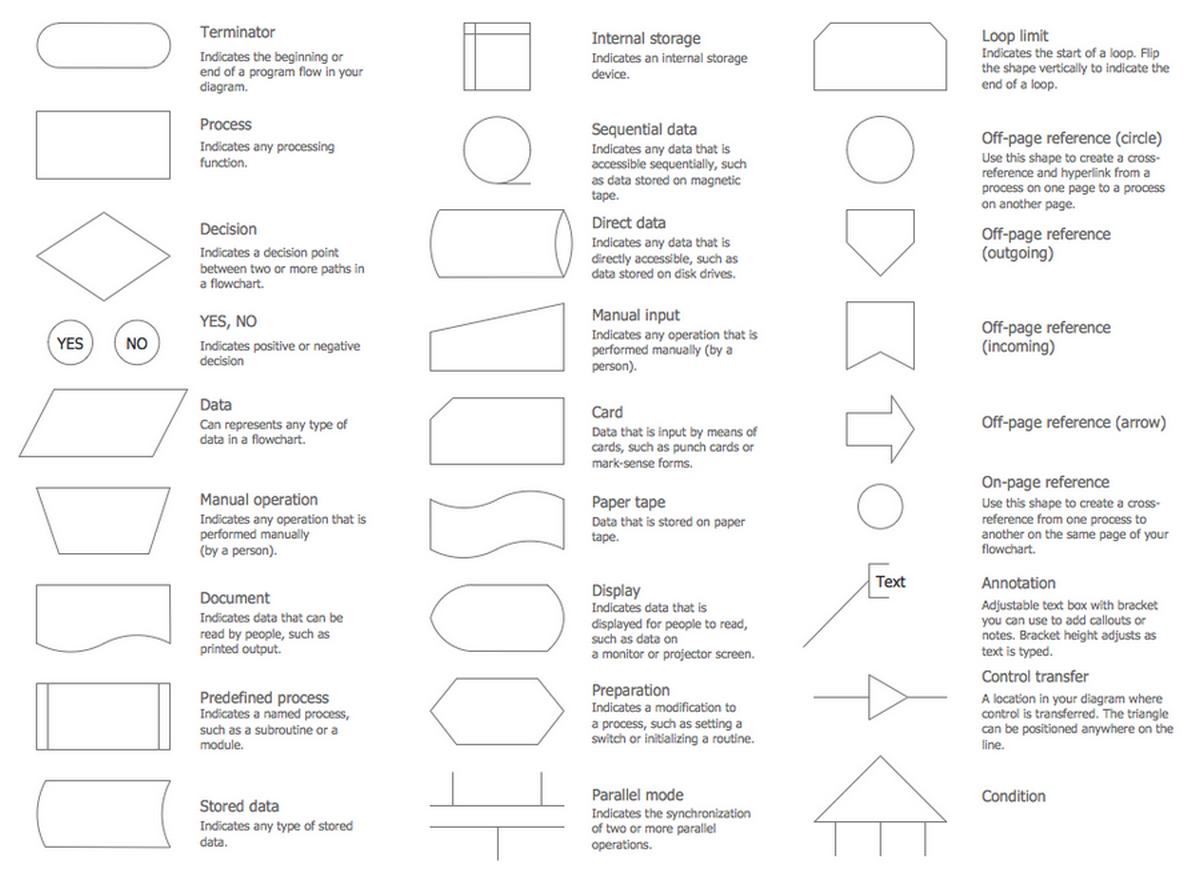
Picture: Process Flowchart Symbols: Meaning, Types and Examples
Related Solution:
ConceptDraw DIAGRAM diagramming and vector drawing software offers the Fault Tree Analysis Diagrams Solution from the Industrial Engineering Area of ConceptDraw Solution Park for quick and easy creating the Fault Tree Diagram of any degree of detailing.
Picture: Fault Tree Diagram
Related Solution:
Cause and Effect Analysis - The Seven Management and Planning Tools is a tool for Cause and Effect Analysis that allows users to analyze the root causes for factors that influenced the problem. This diagram is constructed separately for each highly prioritized factor. The Diagram is then used for further formulation of potential actions.
Picture: Cause and Effect Analysis
It doesn’t matter what kind of business you have, a bar or a gym, there are common concepts for any of them. One of those concepts is accounting, and to facilitate the work with the figures, you can use accounting flowchart symbols and create a clear and representative scheme. You can create flowchart for auditing, tax accounting and even for planning your own budget.
A graphical tool for displaying successive processes is flowchart. This method is mostly suited to represent an accounting process. The sequence of steps in the accounting process usually consists of standard accounting procedures, that can be depicted by using a minimal number of symbols, applied for the basic flowcharting. The advanced opportunity to create professional Accounting Flow charts is provided by ConceptDraw Accounting Flowcharts solution. It includes contains a library of accounting flowchart symbols used when drawing the accounting process flow.
Picture: Accounting Flowchart Symbols
Related Solution:
The excellent possibility to create attractive Cross Functional Flowcharts for step-by-step visualization the operations of a business process flow of any degree of detailing is offered by ConceptDraw’s Cross-Functional Flowcharts solution. The extensive selection of commonly used vector cross functional flowchart symbols allow you to demonstrate the document flow in organization, to represent each team member’s responsibilities and how processes get shared or transferred between different teams and departments.
Picture: Cross Functional Flowchart Symbols
Related Solution:
A waterfall model describes software development process as a sequence of phases that flow downwards. SSADM is one of the implementations of waterfall method. It’s easier to learn about structured systems analysis and design method (SSADM) with ConceptDraw DIAGRAM because this software has appropriate tools for creating data flow diagrams. You can use all the three main techniques of SSADM method with special tools and predesigned templates.
This data flow diagram illustrates the Structured Systems Analysis and Design Method. This method method considers analysis, projecting and documenting of information systems. Data flow models are the most important elements of SSADM and data flow diagrams are usually used for their description. It includes the analysis and description of a system as well as visualization of possible issues.
Picture: Structured Systems Analysis and Design Method. SSADM with ConceptDraw DIAGRAM
Related Solution:
Use Software Diagram Templates from the solutions of Software Development area for ConceptDraw DIAGRAM to create your own professional looking Software Diagrams in minutes.
The Software Diagrams designed with ConceptDraw DIAGRAM are vector graphic documents and are available for reviewing, modifying, converting to a variety of formats (image, HTML, PDF file, MS PowerPoint Presentation, Adobe Flash or MS Visio XML), printing and send via e-mail in one moment.
Picture: Software Diagram Templates


