Example 1. Educational Technology Tools
Education infographics are effective for teachers to explain the new information for the students and pupils. Education Infographics Solution includes variety of ready education infographics for various fields of science which are available for viewing and editing from ConceptDraw STORE. To make an infographic from the blank sheet, use numerous libraries of predesigned objects from the Education Infographics Solution.
These 11 libraries contain 330 various objects. Look at them - they are completely ready for use. Just have to drag them at the document and arrange.

Example 2. Education Infogram - Energy Scales
The education infographics you see on this page were designed in ConceptDraw DIAGRAM with help of design elements from the Education Infographics Solution libraries. An experienced user spent 15 minutes creating every of these samples. You can find them all in ConceptDraw STORE. Apply effective educational technology tools in learning thanks to the ConceptDraw DIAGRAM software!
The education infographics designed with ConceptDraw DIAGRAM are vector graphic documents and are available for reviewing, modifying, converting to a variety of formats (image, HTML, PDF file, MS PowerPoint Presentation, Adobe Flash or MS Visio), printing and send via e-mail in one moment.
TEN RELATED HOW TO's:
A Wireless network is a type of the computer network that uses the wireless connections for connecting network nodes for data transfer. The wireless networks are very useful, inexpensive, popular and widely used. They are easy setup and do not require the cables installation.
Using the solutions of the Computer and Networks Area for ConceptDraw DIAGRAM you can design the wireless network diagrams of any complexity quick and easy.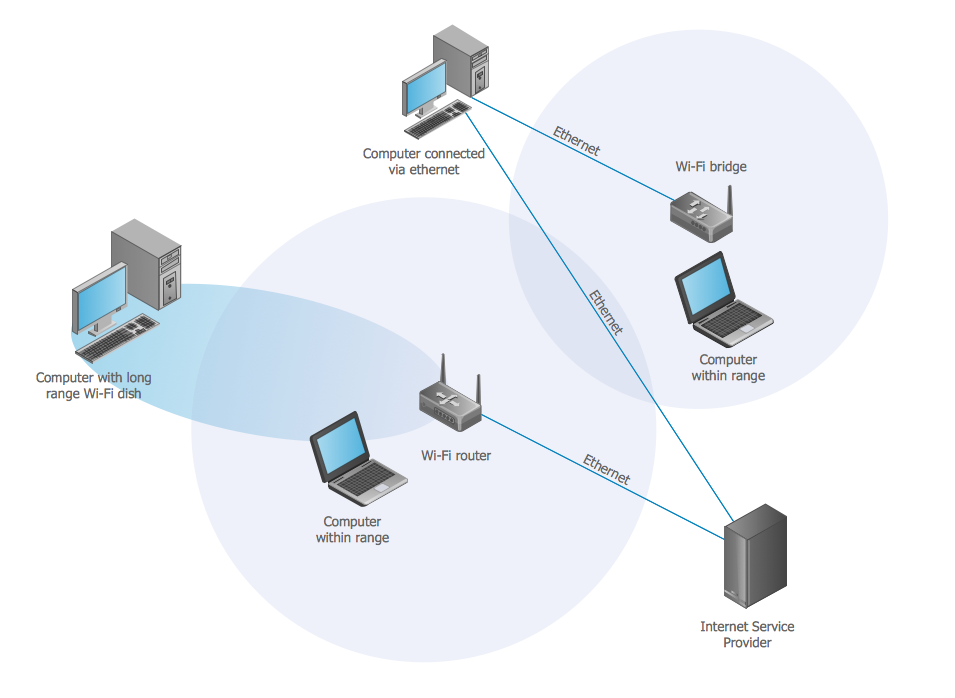
Picture: Wireless network. Computer and Network Examples
Related Solution:
ConceptDraw DIAGRAM is a drawings software for creating Nature scenes. Nature solution from ConceptDraw Solution Park expands this software with a new library that contains 17 vector objects and samples illustration files.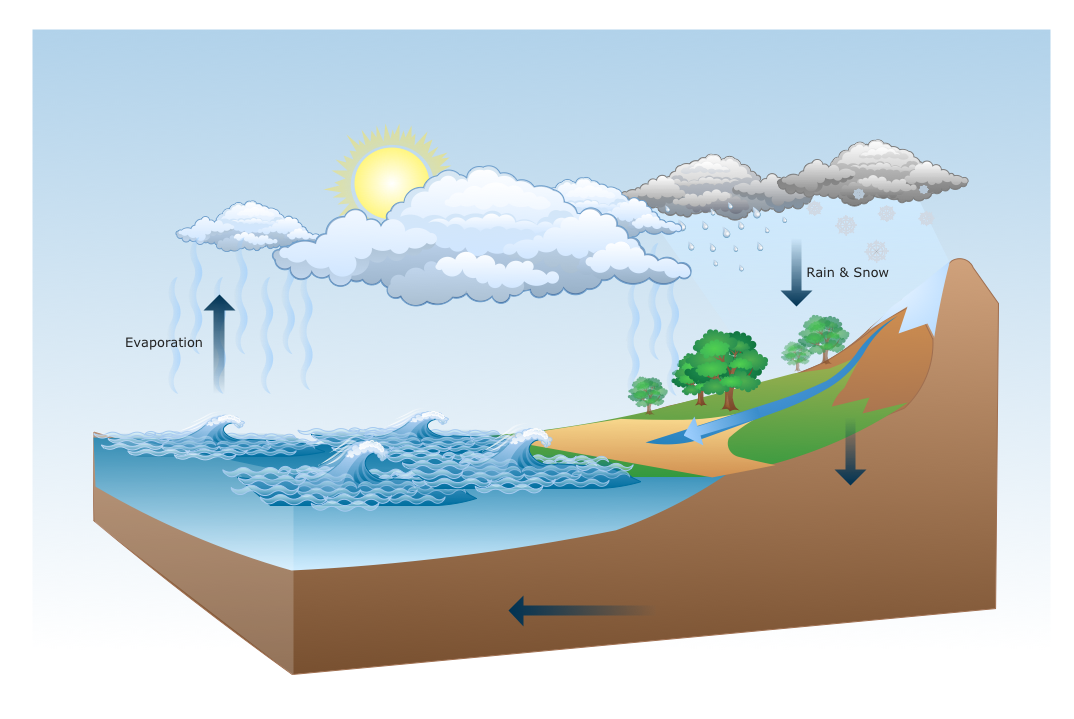
Picture: Drawing a Nature Scene
This sample was created in ConceptDraw DIAGRAM diagramming and vector drawing software using the Workflow Diagrams Solution from the Software Development area of ConceptDraw Solution Park.
This sample shows the Workflow Diagram that clearly illustrates stages a BPM consists of and relations between all parts of business. The Workflow Diagrams are used to represent the transferring of data during the work process, to study and analysis the working processes, and to optimize a workflow.

Picture: Software Work Flow Process in Project Management with Diagram
Related Solution:
Chemistry solution offers 6 libraries with large collection of vector chemistry symbols and meanings, chemistry equation symbols, organic chemistry symbols, and chemical clipart.
Picture: Chemistry Symbols and Meanings
Related Solution:
ConceptDraw DIAGRAM is a powerful diagramming and vector drawing software. Extended with Event-driven Process Chain Diagrams EPC solution from the Business Processes Area, ConceptDraw DIAGRAM became the ideal EPC Engineering software.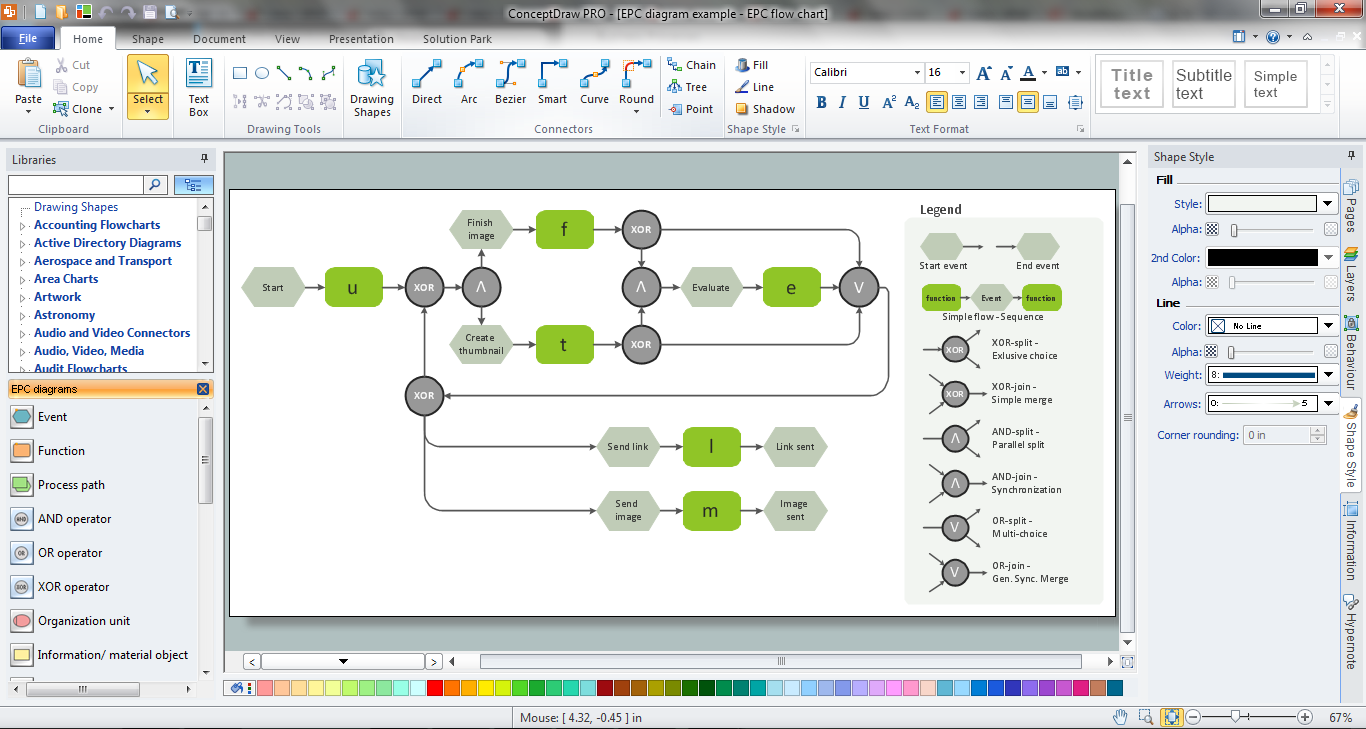
Picture: EPC Engineering
Related Solution:
Mind map template of a strategy map that can help you display a variety of performance measures that can have an impact on your organization.
Picture: SWOT Analysis
Related Solution:
Chemical and Process Engineering solution contains variety predesigned process flow diagram elements relating to instrumentation, containers, piping and distribution necessary for chemical engineering, and can be used to map out chemical processes or easy creating various Chemical and Process Flow Diagrams in ConceptDraw DIAGRAM.
Picture: Process Flow Diagram Symbols
Related Solution:
Interactive Training via presentations is used widely in education. This is a frequently used tool on training, especially for remote training via Skype.
Picture: Interactive Training Tool
Related Solution:
How to Draw ER Diagrams? With Entity-Relationship Diagram (ERD) solution from the Software Development Area for ConceptDraw Solution Park you are able to draw ER diagram with no problem. It includes 45 predesigned icons advocated by popular Chen's and Crow’s Foot notations that can be used when describing an enterprise database.
Picture: How to Draw ER Diagrams
Related Solution:
ConceptDraw gives the ability to draw Flowchart documents. Flowcharts solutionis a powerful tool that extends ConceptDraw application for drawing business flowcharts.
ConceptDraw DIAGRAM vector diagramming and business graphics software enhanced with with templates, green and interactive flowchart makers, samples and stencil libraries from ConceptDraw Solution Park which all focused to help with drawing flowcharts, block diagrams, bar charts, histograms, pie charts, divided bar diagrams, line graphs, area charts, scatter plots, circular arrows diagrams, Venn diagrams, bubble diagrams, concept maps, and others.
Picture: The Best Flowchart Software Available
Related Solution:


 Library")
 Library")
 Library")


