
Sample 1. Northern line extension to Battersea via Nine Elms - Spatial infographics.
Solution Spatial Infographics from ConceptDraw Solution Park extends ConceptDraw DIAGRAM ector diagramming and business graphics software with easy-to-use spatial infographics drawing tools.
This solution contains spatial infographics samples, map templates to be filled in, and libraries of vector stencils for main design elements of spatial infographics.
Use this solution to draw your own geospatial infographics documents with thematic maps, road maps, directional maps and transport maps.
See also Samples:
FIVE RELATED HOW TO's:
Now anyone can build an infographics from their data using ConceptDraw.
Nice and simple, but the features it have are power-packed!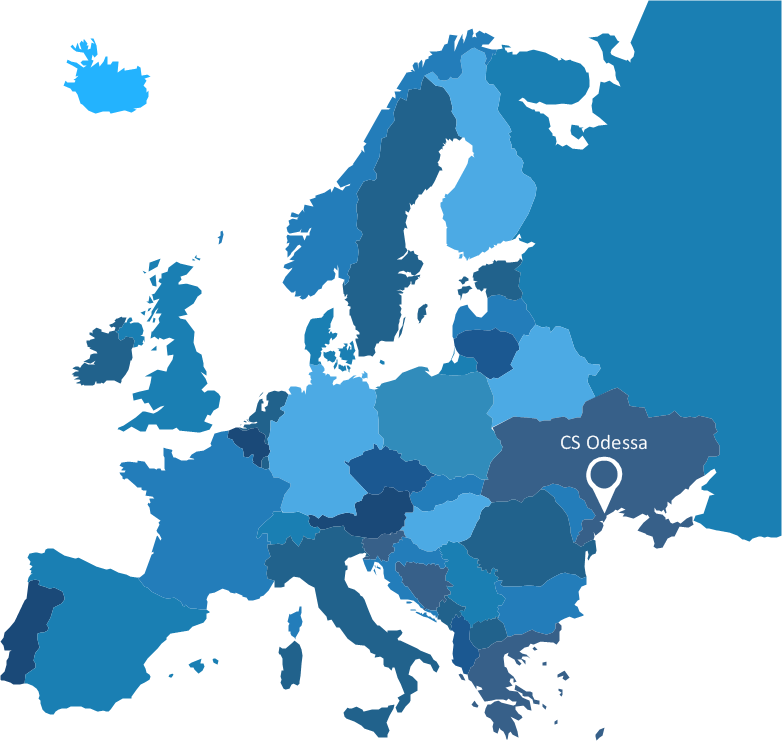
Picture: Visualization Spatial Data Using Thematic Maps Combined with Infographics
A circuit diagram is sometimes also called an elementary diagram, electronic schematic or electrical diagram circuits. It is essential in construction of any electronic equipment. Among many digital drawing tools available, ConceptDraw DIAGRAM is a leading circuits and logic diagram software, affording for easy and quick creation of even the most advanced and complex diagram designs. This makes it a perfect choice for computer science and any kind of electronic engineering.
This drawing includes the graphic symbols that may be in use while creating a logic circuit diagram. The diagrams of such kind are used in the electronics industry. The logic symbol depicts a device that realizes a Boolean type functions. Practically a logic symbol means transistor, diodes, relays, and other mechanical or optical details which provide function of closing or opening "gates". Totally the logic circuits can involve millions of gates. ConceptDraw Electrical Engineering solution gives the opportunity to create a circuit diagrams both simple and difficult.
Picture: Circuits and Logic Diagram Software
Related Solution:
Over the past few centuries, data visualization has evolved so much that we use it every day in all areas of our lives. Many believe that infographic is an effective tool of storytelling, as well as analytics, and that it is able to overcome most of the language and educational barriers. Understanding the mechanisms of human perception will help you to understand how abstract forms and colors used in data visualization can transmit information more efficient than long paragraphs of text.
Picture: Tools to Create Your Own Infographics
ConceptDraw Infographics is a great visual tool for communicating the large amounts of data and graphic visualization and representations of data and information.
Picture: How tо Represent Information Graphically
The ConceptDraw Home Design Software extended with Floor Plans solution from the Building Plans area of ConceptDraw Solution Park offers the powerful tools which will help you in easy developing vivid and professional-looking: Building plans, Home plans, House designs, Floor plans, Home interior designs, Furniture and equipment layouts.
Picture: Home Design Software
Related Solution: