Tools to Create Data Flow Diagram
Data Flow Diagram (DFD) is a way of representing a flow of data through a process or a system, which indicates the outputs and inputs of the process, interactions between the system and external entities, which are sources and destinations of system inputs and outputs. It is a visual way to show the logic and concept behind the system, the flow between different entities in a system, where data come from, where they go, how they are processed and stored in repositories of data named datastores.
Data Flow Diagrams are easy to create and universal in application. They are focused on the flow of information and are applicable to almost every system. DFD is created to illustrate the flow of processes in a particular company or a specific project. It shows the movement of information, sequence of steps or events to transform incoming data flow composed of packets of information into outgoing data flow to complete a specific task. Data Flow Diagrams are widely used in system analysis, software engineering, structured software analysis and design, business administration, database design and management, organizational management, internal and external audit, decision-making, error detection, etc.
Data Flow Diagrams help systems and processes to be effective, and businesses to achieve the intended outputs and objectives. DFD is designed as a conceptual and physical structure of the database and is used as the basis to create a database. The system analysis based on the DFD helps teams and managers better understand the overall system operation, analyze the flow of data from one entity to another, inputs and outputs, detect errors, inefficiencies, potential obstacles and problems, resolve and eliminate them. DFDs help to organize the efficient operation of organizations and systems, provide better decisions, reduce costs, and improve productivity and efficiency.
Data Flow Diagrams are diverse, they can vary in design and complexity. However, in any case, they are useful to provide an engaging visual guide of both simple and complex multi-level methodologies. Breaking down complex procedures is efficient in identifying potential problems and bottlenecks. DFDs are used to document and analyze systems and processes in both virtual and real-life settings. They are helpful in creating technical documentation in software development. In business and project management, DFDs help to model internal and external processes that affect project success and customer satisfaction.
There are two types of Data Flow Diagrams: logical Data Flow Diagram (LFD), which shows the conceptual flow of information through a process, and physical Data Flow Diagram (PFD), which shows how the system plan should be executed and usually includes information about specific tools and hardware needed to implement it. Logical DFD is usually used in the early stages of process or system design and focuses on the source of data, its type, and destination.
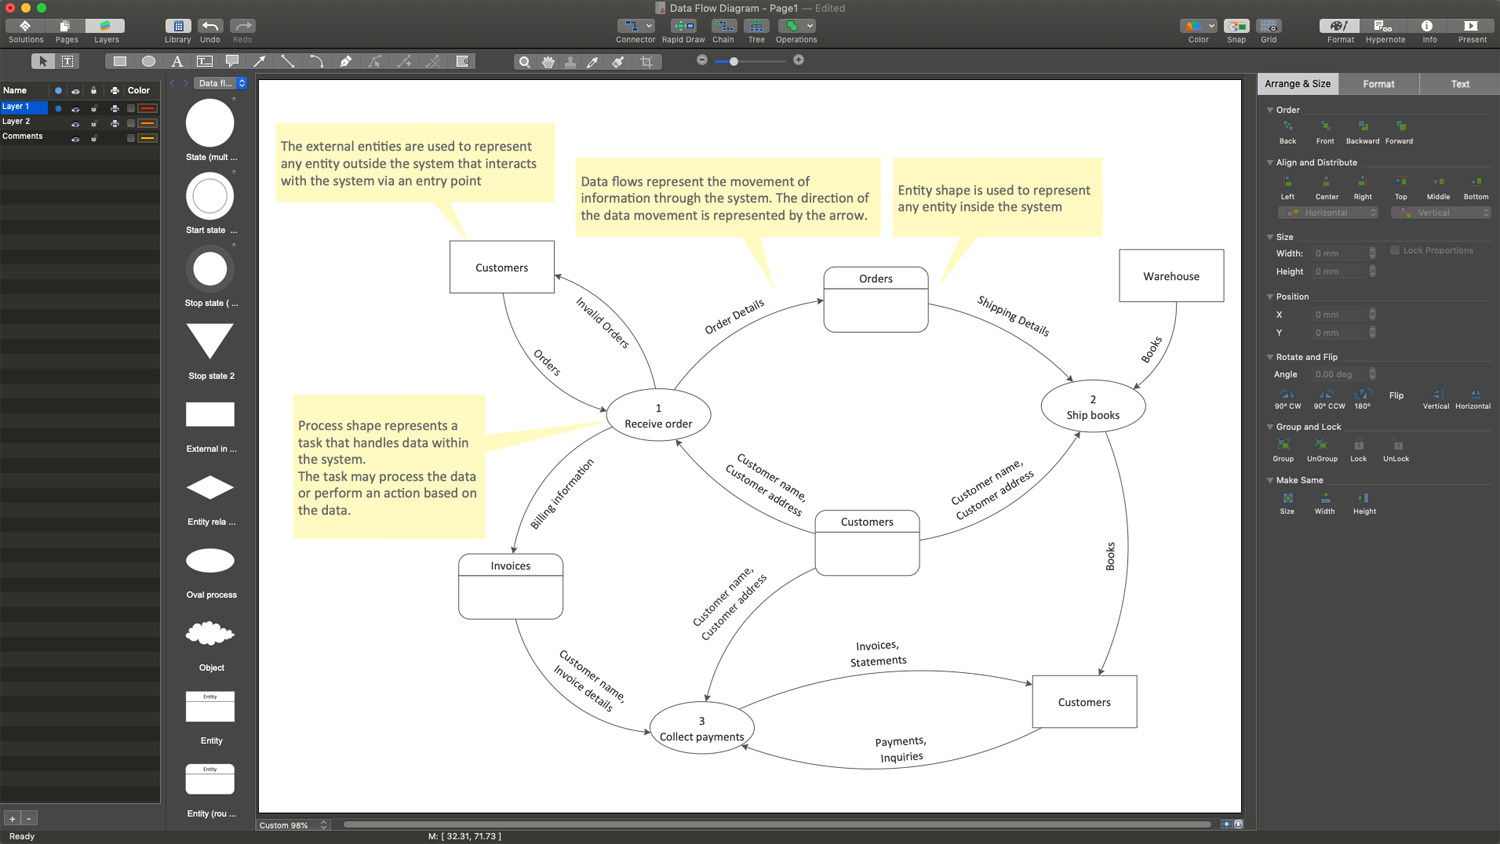
Example 1. Tools to Create Data Flow Diagram in ConceptDraw DIAGRAM
Four main components are usually included in the Data Flow Diagram:
- external entities, which receive or transfer data;
- process that is shown as a series of steps, which transform inputs or information that flows through the system;
- data storage that contains information to be used or processed later;
- data flow, which is the path that data inputs or information go through a system to the output.
As a rule, a Data Flow Diagram (DFD) is organized hierarchically from top to bottom and from left to right, and includes all the vital components of the system. It is composed of levels and their number depends on the process complexity. The more complex a process is, the more levels the diagram includes. DFD shows a general overview of the entire system or process at Level 0, the process node and its links with external entities. The major sub-systems and sub-processes into which the process node is broken down are shown at Level 1. The other components and other sub-processes are shown at Level 2 and lower.

Example 2. DFD — Interaction between IDMA and Preprocessor
Two types of notations are used in common for Data Flow Diagrams: Yourdon & Coad and Gane & Sarson. These notations define different standardized symbols for components and functions, inputs, outputs, entities, processes, sub-processes, data stores, and data flow direction. The standardized notation symbols are rectangles, circles, short-text labels, arrows, etc. Gane and Sarson DFDs are more common for the visualization of information systems, while Yourdon and Coad DFDs are usually used for system analysis and design.
ConceptDraw DIAGRAM software extended with Data Flow Diagrams (DFD) solution provides powerful drawing tools to create Data Flow Diagram of any complexity. Use the pre-made design components for Yourdon & Coad or Gane & Sarson notation, quick-start templates and samples for quick and easy drawing. Provide the required clarity to the system or process, show the logic and functions, and explain complex concepts and business operations in a visual way using the DFD format. DFD helps to hold people's attention longer and improves the comprehension and perception of the information. It assists in refining, tracking, and streamlining business operations, boosts team effectiveness and improves productivity.

Example 3. Data Flow Diagrams Solution- Libraries Design Elements
The Data Flow Diagram examples you see on this page were created in ConceptDraw DIAGRAM using the objects from the libraries of Data Flow Diagrams solution. These samples demonstrate the solution's capabilities and the professional results you can achieve. An experienced user spent 15 minutes creating each of these samples.
Use the Data Flow Diagrams solution for designing your own Data Flow Diagrams quick, simply, and effectively.
All source documents are vector graphic documents. They are available for reviewing, modifying, or converting to a variety of formats (PDF file, MS PowerPoint, MS Visio, and many graphic formats) from the ConceptDraw STORE. The Data Flow Diagrams Solution is available for all ConceptDraw DIAGRAM users.


