Products
Solutions
Samples
Contact Us
Buy
Helpdesk
✕
Sign In
Sign In
My ConceptDraw
Profile
Cart 
Activate
My Activated Licenses
Upgrade Information
Download Product
Open Support Ticket
Sign Out
This site uses cookies. By continuing to browse the ConceptDraw site you are agreeing to our Use of Site Cookies.
Helpdesk  >  ConceptDraw DIAGRAM  >    Business-specific Drawings

How to Create a Data Flow Diagram

Data Flow Diagrams (DFD) helps identifying business processes. At its simplest, a data flow diagram shows how data flows through a system. It displays where the data comes from and go to as well as where it will be stored. Data Flow Diagram (DFD) can be used to visualize data flows in information systems. DFD consists of four major components: entities, processes, data stores, and data flows. The set of standard symbols is used to depict how these components interact in a system. ConceptDraw DIAGRAM allows you to draw a simple and clear Data Flow Diagram using special libraries, provided by Data Flow Diagrams Solution.
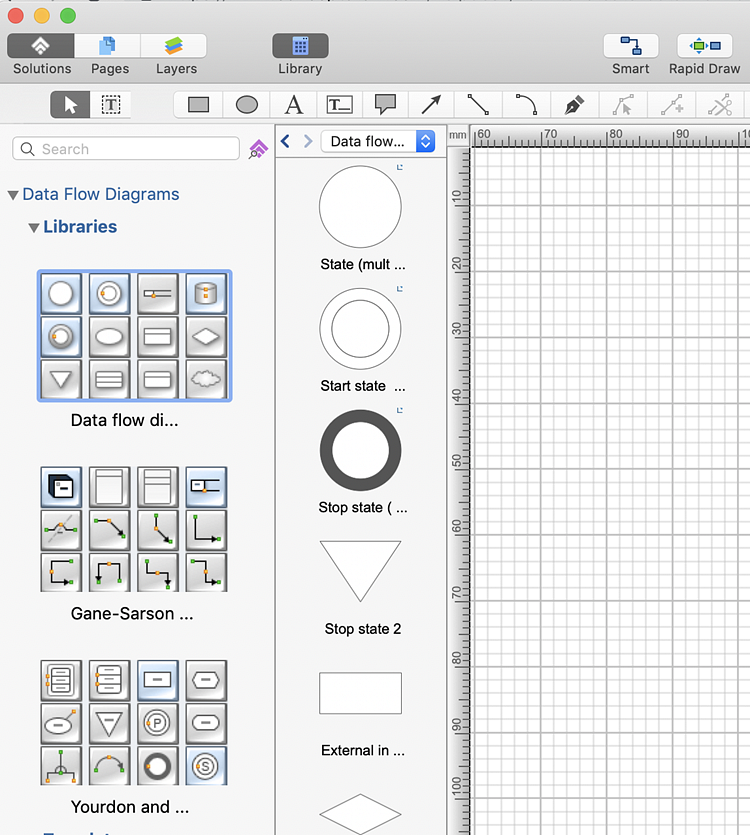
  1. Open a ConceptDraw DIAGRAM new document and select the Data Flow Diagram library.
  2. conceptdraw-data-flow-solution
  3. Drag and drop the following DFD elements from the library to your document:
    data-flow-diagram-process
    Processes and functions
    data-flow-diagram-external entity
    External entities
    data-flow-data-store
    Data depositories

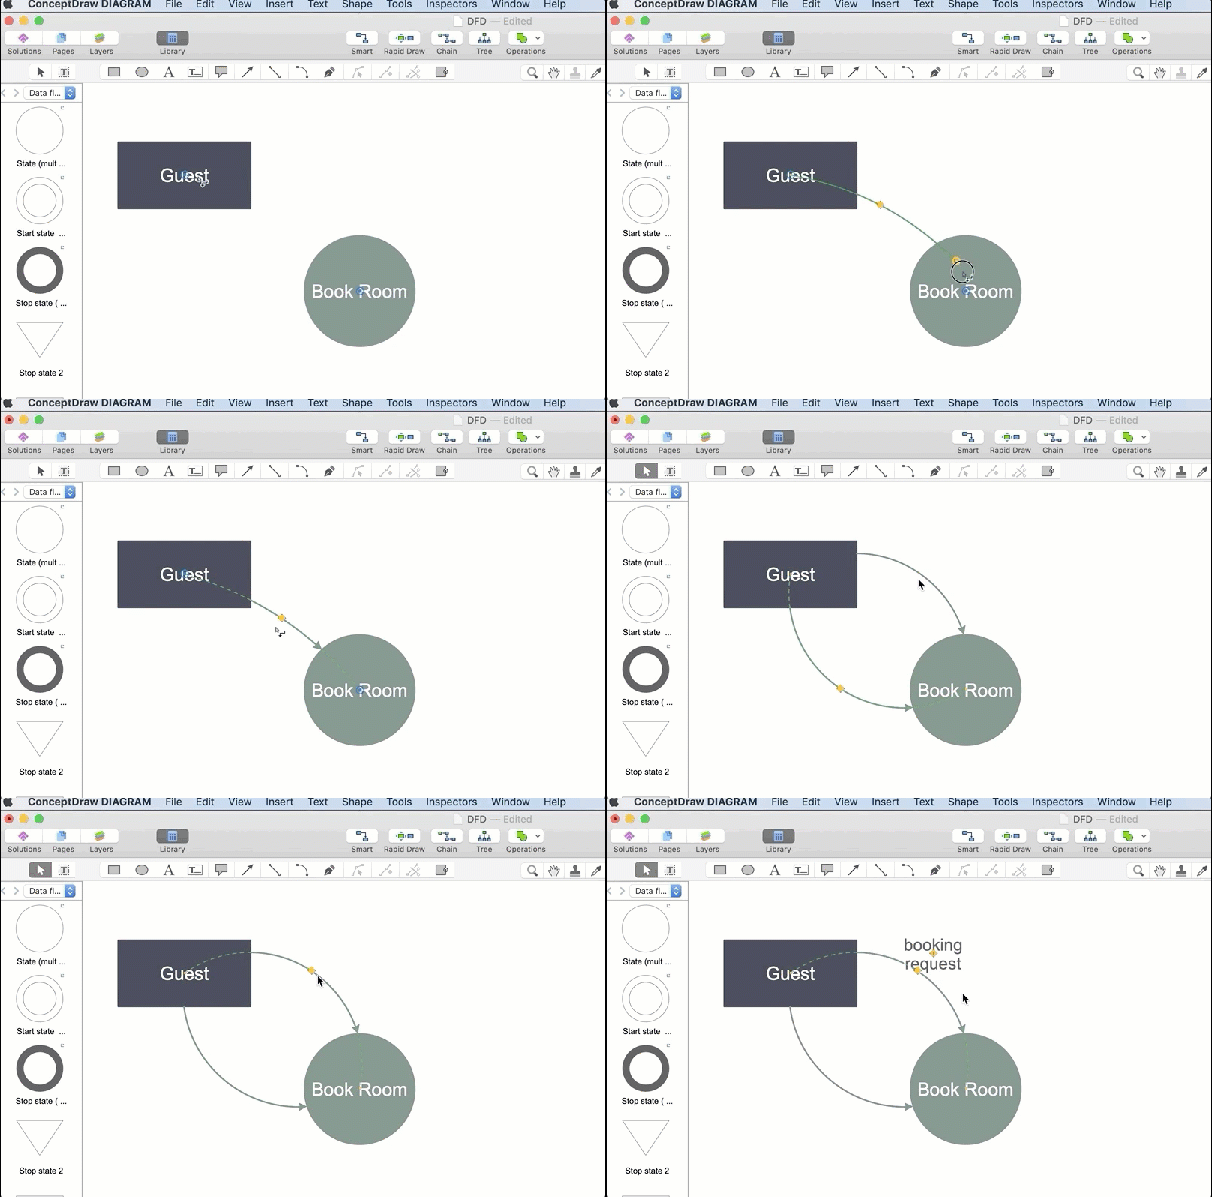
  4. Use connectors on Mac or PC to show the direction of data flow. In our case, we use the Arc connector. To add a text to connector select it and start typing.
  5. conceptdraw-data-flow-solution
  6. Use the Format panel to edit objects, text and even connectors.
  7. conceptdraw-data-flow-solution

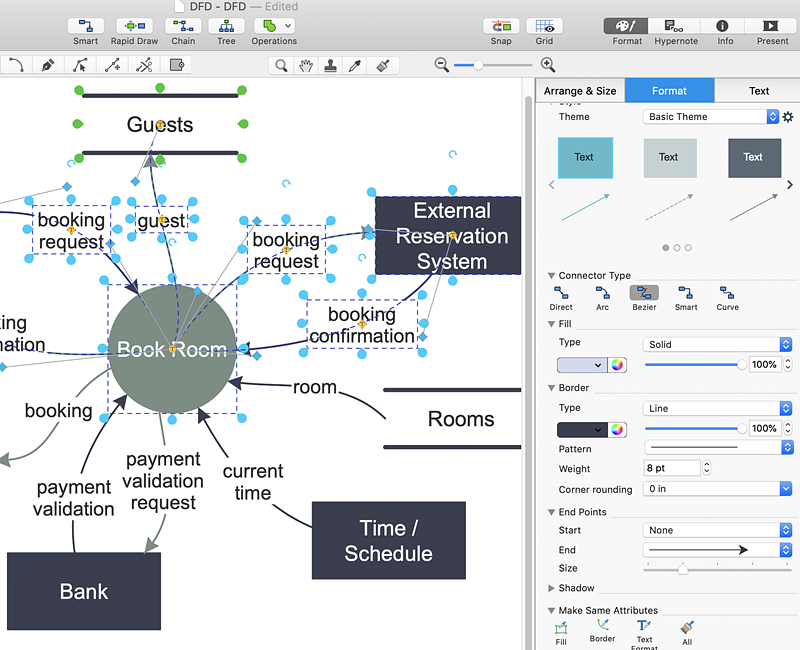
Result: Data Flow diagram (DFD) represents a data flow in the information system and used for analysis of data processing during the structural projection.

How to Create a Data Flow Diagram

How it works:

  • Set of ready-to-use templates supplied with ConceptDraw DIAGRAM
  • Collection of professional samples supports each template
  • Professional drawing tools

Useful Solutions and Products:

Entity-Relationship Diagram
  • Easily draw different pie charts charts
  • Visualize business information
  • Capture a different phases of the project, using diagrams

Rapid UML
  • UML diagrams samples and templates
  • Library of vector stencils

ConceptDraw DIAGRAM
  • Diagraming and Charts
  • Business Process diagrams
  • Business Process Modeling Notation (BPMN 2.0)
  • Business Model Presentation
  • Over 10 000 vector stencils
  • Export to vector graphics files
  • Export to Adobe Acrobat® PDF
  • Export to MS PowerPoint®
  • Export to MS Visio® VSDX, VDX

Products

  • ConceptDraw OFFICE v11
  • ConceptDraw DIAGRAM v18
  • ConceptDraw MINDMAP v16
  • ConceptDraw PROJECT v15
  • ConceptDraw STORE
  • ConceptDraw BOOKS

Solutions

  • Free
  • Premium

Samples

Support

  • Technical Support
  • Upgrade Request
  • Visio File Conversion
  • System Requirements
  • Helpdesk
  • Students & Educators
  • Enterprise
  • Customer Service

Solutions

  • Free
  • Premium

Samples

Video Room

  • Products
  • Solutions

Ready To Buy

  • Buy Online
  • Reseller Partners
  • Manage Your Account
  • Download Your Software
  • CS Odessa

    • About Us
    • Contact Us
    • CS Odessa Identity
    • News
  • CS Odessa
    Plan. Do. Communicate.

    About Us | Contact Us | Feedback | EULA | Privacy | TOU | TOS
    © 1993 — 2025 CS Odessa Corp.