- Electric and Telecom Plans Free
- Fire and Emergency Plans Free
- Floor Plans Free
- Plant Layout Plans Free
- School and Training Plans Free
- Seating Plans Free
- Security and Access Plans Free
- Site Plans Free
- Sport Field Plans Free
- Business Process Diagrams Free
- Business Process Mapping Free
- Classic Business Process Modeling Free
- Cross-Functional Flowcharts Free
- Event-driven Process Chain Diagrams Free
- IDEF Business Process Diagrams Free
- Logistics Flow Charts Free
- Workflow Diagrams Free
- ConceptDraw Dashboard for Facebook Free
- Mind Map Exchange Free
- MindTweet Free
- Note Exchange Free
- Project Exchange Free
- Social Media Response Free
- Active Directory Diagrams Free
- AWS Architecture Diagrams Free
- Azure Architecture Free
- Cisco Network Diagrams Free
- Cisco Networking Free
- Cloud Computing Diagrams Free
- Computer Network Diagrams Free
- Google Cloud Platform Free
- Interactive Voice Response Diagrams Free
- Network Layout Floor Plans Free
- Network Security Diagrams Free
- Rack Diagrams Free
- Telecommunication Network Diagrams Free
- Vehicular Networking Free
- Wireless Networks Free
- Comparison Dashboard Free
- Composition Dashboard Free
- Correlation Dashboard Free
- Frequency Distribution Dashboard Free
- Meter Dashboard Free
- Spatial Dashboard Free
- Status Dashboard Free
- Time Series Dashboard Free
- Basic Circle-Spoke Diagrams Free
- Basic Circular Arrows Diagrams Free
- Basic Venn Diagrams Free
- Block Diagrams Free
- Concept Maps Free
- Family Tree Free
- Flowcharts Free
- Basic Area Charts Free
- Basic Bar Graphs Free
- Basic Divided Bar Diagrams Free
- Basic Histograms Free
- Basic Line Graphs Free
- Basic Picture Graphs Free
- Basic Pie Charts Free
- Basic Scatter Diagrams Free
- Aerospace and Transport Free
- Artwork Free
- Audio, Video, Media Free
- Business and Finance Free
- Computers and Communications Free
- Holiday Free
- Manufacturing and Maintenance Free
- Nature Free
- People Free
- Presentation Clipart Free
- Safety and Security Free
- Analog Electronics Free
- Audio and Video Connectors Free
- Basic Circuit Diagrams Free
- Chemical and Process Engineering Free
- Digital Electronics Free
- Electrical Engineering Free
- Electron Tube Circuits Free
- Electronic Block Diagrams Free
- Fault Tree Analysis Diagrams Free
- GHS Hazard Pictograms Free
- Home Automation and Wiring Free
- Mechanical Engineering Free
- One-line Diagrams Free
- Power Сircuits Free
- Specification and Description Language (SDL) Free
- Telecom and AV Circuits Free
- Transport Hazard Pictograms Free
- Data-driven Infographics Free
- Pictorial Infographics Free
- Spatial Infographics Free
- Typography Infographics Free
- Calendars Free
- Decision Making Free
- Enterprise Architecture Diagrams Free
- Fishbone Diagrams Free
- Organizational Charts Free
- Plan-Do-Check-Act (PDCA) Free
- Seven Management and Planning Tools Free
- SWOT and TOWS Matrix Diagrams Free
- Timeline Diagrams Free
- Australia Map Free
- Continent Maps Free
- Directional Maps Free
- Germany Map Free
- Metro Map Free
- UK Map Free
- USA Maps Free
- Customer Journey Mapping Free
- Marketing Diagrams Free
- Matrices Free
- Pyramid Diagrams Free
- Sales Dashboard Free
- Sales Flowcharts Free
- Target and Circular Diagrams Free
- Cash Flow Reports Free
- Current Activities Reports Free
- Custom Excel Report Free
- Knowledge Reports Free
- MINDMAP Reports Free
- Overview Reports Free
- PM Agile Free
- PM Dashboards Free
- PM Docs Free
- PM Easy Free
- PM Meetings Free
- PM Planning Free
- PM Presentations Free
- PM Response Free
- Resource Usage Reports Free
- Visual Reports Free
- House of Quality Free
- Quality Mind Map Free
- Total Quality Management TQM Diagrams Free
- Value Stream Mapping Free
- Astronomy Free
- Biology Free
- Chemistry Free
- Language Learning Free
- Mathematics Free
- Physics Free
- Piano Sheet Music Free
- Android User Interface Free
- Class Hierarchy Tree Free
- Data Flow Diagrams (DFD) Free
- DOM Tree Free
- Entity-Relationship Diagram (ERD) Free
- EXPRESS-G data Modeling Diagram Free
- IDEF0 Diagrams Free
- iPhone User Interface Free
- Jackson Structured Programming (JSP) Diagrams Free
- macOS User Interface Free
- Object-Role Modeling (ORM) Diagrams Free
- Rapid UML Free
- SYSML Free
- Website Wireframe Free
- Windows 10 User Interface Free
ConceptDraw Dashboard for Facebook
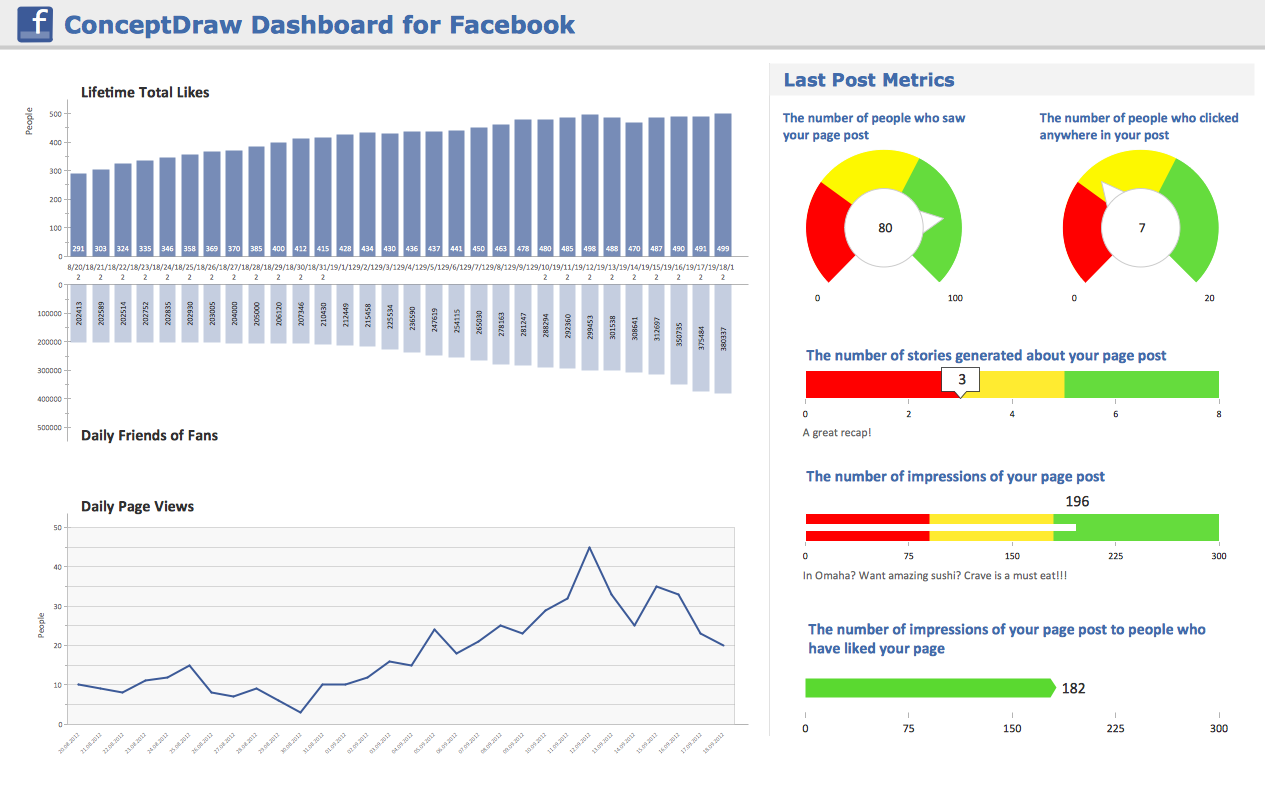
This solution extends ConceptDraw DIAGRAM software with a visual dynamically updated dashboard, which visualizes lifetime total likes, daily friends of fans, and daily page views, information you can receive from Facebook Insights.
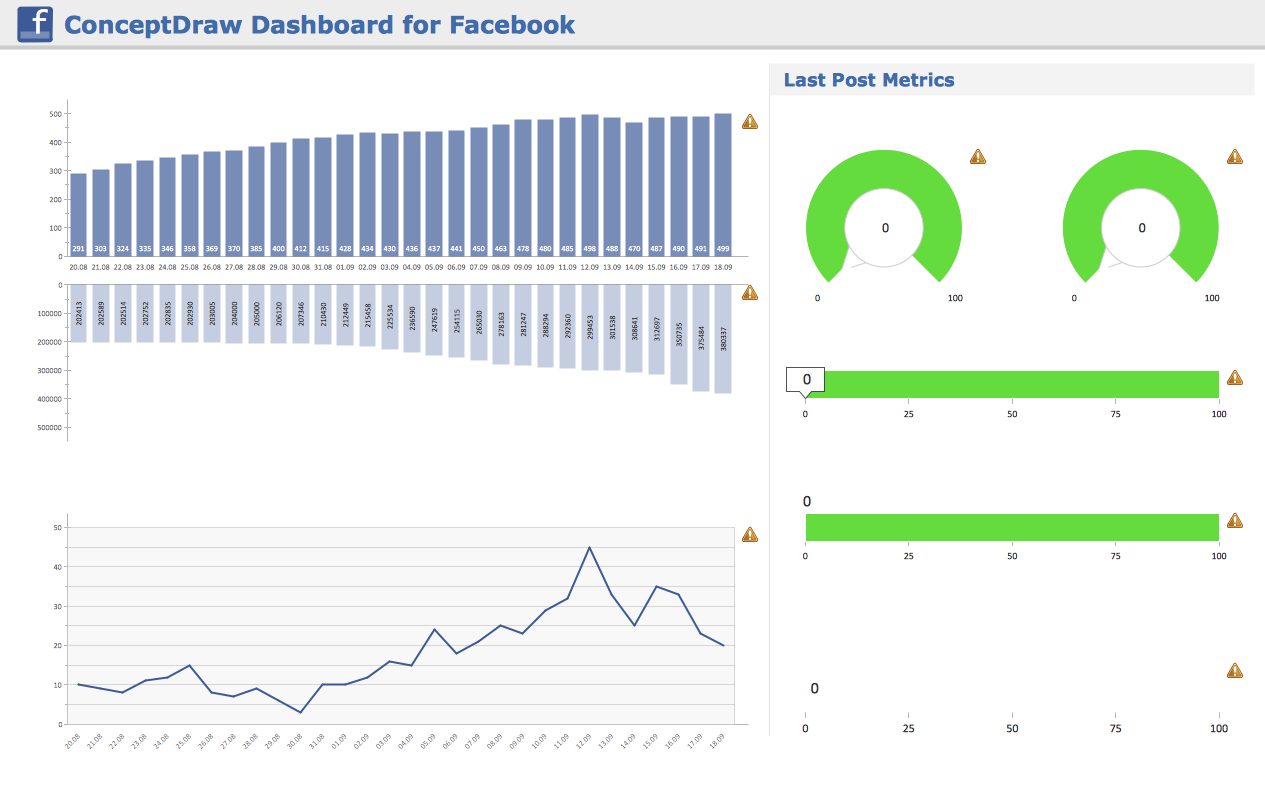
This is a template for ConceptDraw DIAGRAM software. You can connect it to your data source. And each time your data source changes, the dashboard will automatically change its appearance.
The solution uses ConceptDraw Live Objects technology. The result is a dynamically updated vector graphic document.
-
Install this solution Free -
What I need to get started -
Solution Requirements - This solution requires the following products to be installed:
ConceptDraw DIAGRAM v18 - This solution requires the following products to be installed:
-
Compatibility - Sonoma (14), Sonoma (15)
MS Windows 10, 11 - Sonoma (14), Sonoma (15)
-
Support for this Solution -
Helpdesk
Examples
The sample you see on this page was obtained by connecting a sample data source to the template you see below, to demonstrate some of the solution's capabilities and the results you can achieve.
Both documents are vector graphic documents, created in ConceptDraw DIAGRAM using ConceptDraw Live Objects technology. They are available for reviewing and modifying from the ConceptDraw Solution Park. The ConceptDraw Dashboard for Facebook solution is available for all ConceptDraw DIAGRAM users.
Example 1: Facebook Dashboard
This dashboard was created in ConceptDraw DIAGRAM by an experienced specialist. He used ConceptDraw Live Objects technology, so all the charts on this page change when the data source changes.
This document contains a dashboard connected to sample data. Change the sample data source to see how the indicators change their appearance.

Template 1: Facebook Dashboard
This is a template you receive upon installing the ConceptDraw Dashboard for Facebook solution. You need to connect each chart to a data source to make the dashboard live.
You can use our sample data source as an example. Please format your data the same way to get the best results.

What I Need to Get Started
ConceptDraw DIAGRAM and the “ConceptDraw Dashboard for Facebook” solution found in the Collaboration Area of ConceptDraw Solution Park are all you need to get started. Make sure both are installed on your computer.
How to install
Download and install ConceptDraw STORE and ConceptDraw DIAGRAM. Next install the “ConceptDraw Dashboard for Facebook” solution using the STORE.

Start using

About
Facebook is an important marketing component for many companies. Understanding theits effectiveness and impact is important to move your organization ahead in the marketplace. CS Odessa recognizes this and has developed a dynamic dashboard that can be used by stakeholders and employees in the organization who do not have login rights to your brand’s Page. The ConceptDraw Dashboard for Facebook Solution is a visual dashboard of your Facebook Page’s success that visualizes lifetime total Likes, daily friends of fans, and daily page views, based on the information exported from your Page’s Insights. The ConceptDraw Dashboard for Facebook Solution can even be setup to update dynamically, always giving the most current information and keeping you on top of emerging trends in your industry.
The ConceptDraw Dashboard for Facebook supports data from text files (*.txt), comma-separated values files (*.csv), and MS Excel spreadsheet files (*.xls). Once you have connected a source file to the ConceptDraw document containing the solution’s dashboards, the visual indicators will automatically be updated based on your selection of refresh time and source file changes.
Feedback and Reviews
Business Activation Strategist, Kelly Alcorn says: “When you need to inform others in the organization on how your Facebook campaigns are performing, ConceptDraw Dashboard for Facebook is a great solution to keep all stakeholders up to date on what is going on from a social media perspective.”
Facebook FAQ for Social Media Specialists
Which tool has the potential to show your Facebook Page’s up-to-the-minute trends to stakeholders and employees, without them having to login?
Your brand’s Facebook Page is packed with information for your customers. There is an ever increasing number of well-crafted status updates, photos, and links – Facebook is the quintessential customer facing content-sharing platform. To understand how the content you post is actually benefiting your business you need to analyze your page with Facebook Insights (Facebook's online business page analytics tool).
ConceptDraw Office now has a dashboard for visualizing your Page’s Insights. Why would you want to use the ConceptDraw Dashboard for Facebook? ConceptDraw Dashboard for Facebook shines when you want to demonstrate trends to an audience who does not have login access to your Page. Data that is downloaded from Facebook can be quickly displayed using the ConceptDraw Dashboard. The dashboard can be used as a dynamic display of the data, or it is possible to export it as a PowerPoint slide, an Adobe pdf document, HTML, or any one of several other graphic formats that can be used in any way you can imagine.
Which Key Performance Indicators (KPI) from Facebook do you need to view either in static or dynamic fashion, to make an assessment on social media impact for your organization?
After exporting your site data from Facebook and generating a dashboard using ConceptDraw Dashboard for Facebook it is a snap to view relevant KPI. Three of the prominent indicators are Lifetime Total Likes, Daily Friends of Fans, and Daily Page Consumption. These indicators gain you insight into how your content is performing on Facebook. Lifetime Total Likes tells you exactly how many people like your page; Daily Friends of Fans tells you how many friends of those who ‘liked’ can be reached -- your true total reach. Then, the Daily Page Consumption tells you the number of people (out of the possible number of people who could have been reached) that were actually reached.
How do I understand the potential for promotion of my organization, on Facebook?
The “Lifetime Total Likes” and “Daily Friends of Fans” charts are important in this regard, as they represent trends in how people are either increasingly or decreasingly clicking on and consuming the content you're publishing to your Facebook page.
What you really need to do to make this all worthwhile, is to look at the data and correlate it with what you're posting on Facebook. For example, analyze why there are instances of your line decreasing (this indicates a drop in engagement) on one day, and why is there a spike on other days (which indicates an increase in engagement)?
We don't have much to be concerned about if the reach number is steadily increasing, but if that chart was inconsistently jumping up and down, showing a decrease, or showing no change, then we would probably want to test new Facebook campaigns and try posting different types of content, to figure out how we could positively impact our reach growth. Ultimately, the more expansive the reach you have, the more opportunities you'll have to convert Facebook fans into leads and customers for your business.
This leads us to the "Daily Post Consumption" chart – the actual number of people who were reached and are consuming our content. By taking the time to relate individual posts with the clicks, you can analyze which types of content perform well on your page.
What is ”ConceptDraw Dashboard for Facebook”, and why do I need it?
“ConceptDraw Dashboard for Facebook” solution for ConceptDraw DIAGRAM allows you to visualize statistics you get from Facebook Insights on a dynamically updated dashboard. You can visually track lifetime total likes, daily friends of fans, and daily page views to see how effective your SMM is.
You can use a dashboard as your personal daily tool or for reporting to a client, for team motivation or for presentation needs. One quick look at your visual dashboard replaces minutes and hours looking through numbers, and gives you a fresh outlook. One quick look to learn how things are going – isn’t that a sufficient reason to use a dashboard?