How to Use ConceptDraw Dashboard
for Facebook on PC
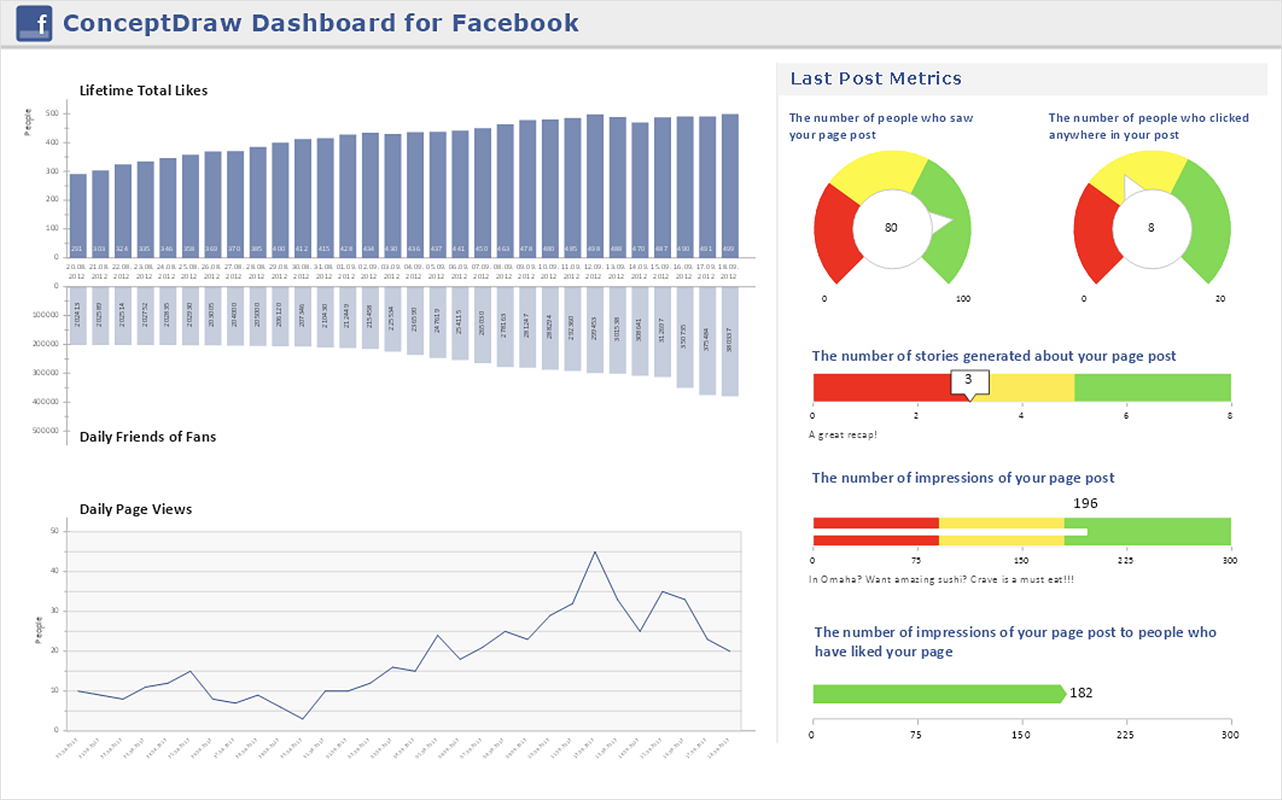
The ConceptDraw Dashboard for Facebook Solution is a visual dashboard that visualizes lifetime total Likes, daily Friends of Fans, and daily Page views based on the information exported from your Facebook Page. To use this Solution, you will need ConceptDraw DIAGRAM and the ConceptDraw Dashboard for Facebook solution installed. The ConceptDraw Dashboard for Facebook supports data from text files (*.txt) and MS Excel spreadsheet files (*.xls, *.xlsx).
Folow the steps below to connect a sample data source MS Excel file (*.xlsx) to the ConceptDraw Dashboard for Facebook on Windows:
- Run ConceptDraw DIAGRAM.
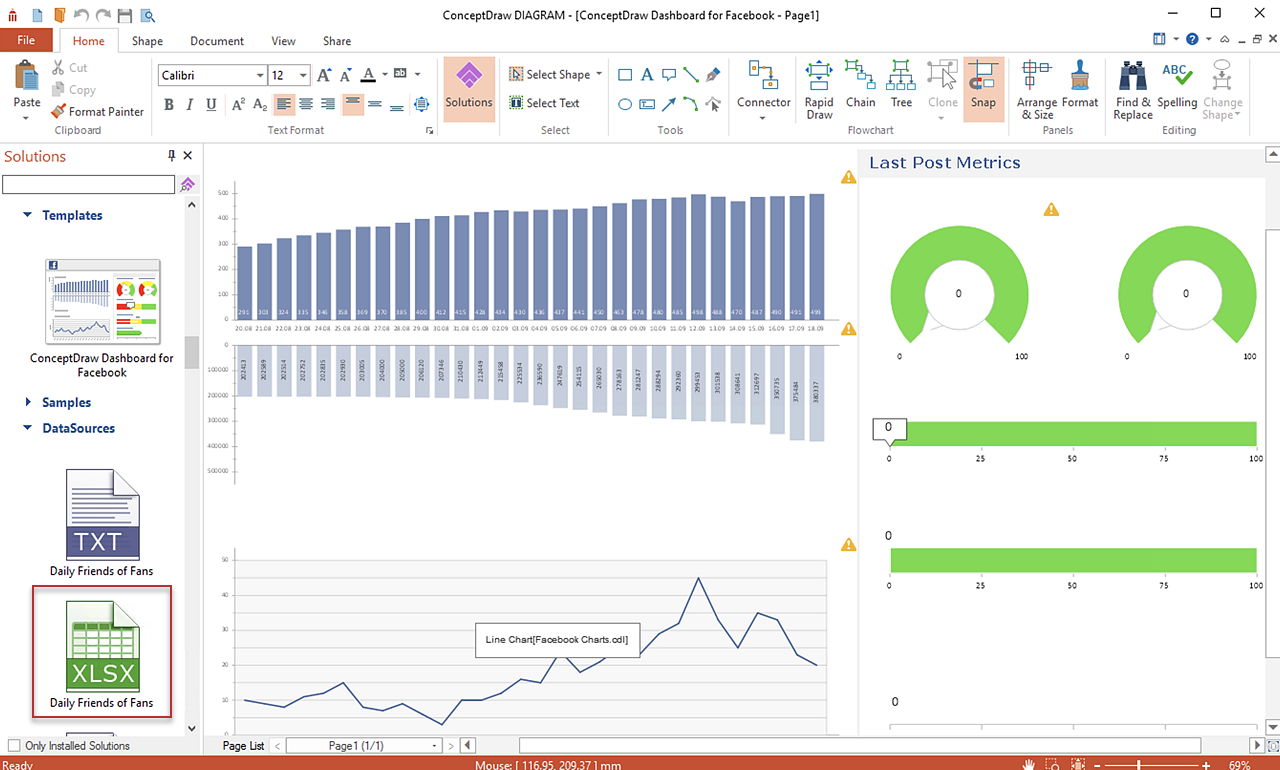
- Reveal the ConceptDraw Dashboard for Facebook item in the Solutions panel.
- Click the template preview to open it.
- Select a sample data source file preview and click to open it.

- You can use this sample file to assign your specific data to the live object. Edit a data source file according to your particular data and save it.
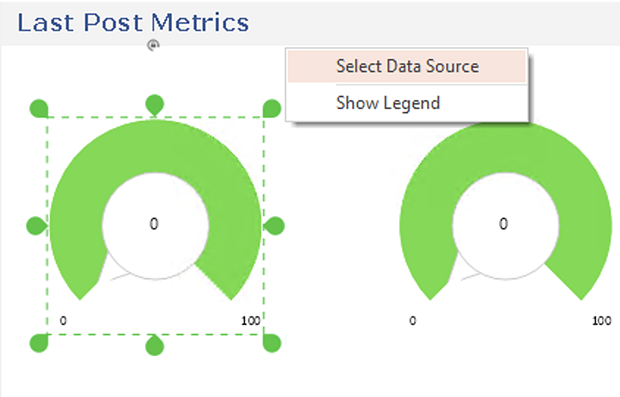
- Open Action menu of the Chart object, using the button
 in the upper right corner of the object, then choose Select Data Source and select your saved data source file. in the upper right corner of the object, then choose Select Data Source and select your saved data source file.

- Perform the same procedure to set the data sources for other dashboard objects.

Result:Once you have connected a source file to the Facebook Dashboard, the visual indicators will automatically be updated based on your selection of refresh time and source file changes.
|
How it works:
- Set of ready-to-use templates supplied with ConceptDraw DIAGRAM
- Collection of professional samples supports each template
- Professional drawing tools
- Live Objects Technology
Useful Solutions and Products:
- Visual dynamically updated dashboard.
- Interactive Time Series Charts: Column Charts, Line Charts and Bar Charts.
- Easily create graphic Quantitative Indicators
- Visualize the actual values of business KPIs
- Diagraming and Charts
- Vector Illustrations
- Maps
- Floor plans
- Engineering drawings
- Business dashboards
- Infographics
- Presentation
- Over 10 000 vector stencils
- Export to vector graphics files
- Export to Adobe Acrobat® PDF
- Export to MS PowerPoint®
- Export to MS Visio® VSDX, VDX
|