- Electric and Telecom Plans Free
- Fire and Emergency Plans Free
- Floor Plans Free
- Plant Layout Plans Free
- School and Training Plans Free
- Seating Plans Free
- Security and Access Plans Free
- Site Plans Free
- Sport Field Plans Free
- Business Process Diagrams Free
- Business Process Mapping Free
- Classic Business Process Modeling Free
- Cross-Functional Flowcharts Free
- Event-driven Process Chain Diagrams Free
- IDEF Business Process Diagrams Free
- Logistics Flow Charts Free
- Workflow Diagrams Free
- ConceptDraw Dashboard for Facebook Free
- Mind Map Exchange Free
- MindTweet Free
- Note Exchange Free
- Project Exchange Free
- Social Media Response Free
- Active Directory Diagrams Free
- AWS Architecture Diagrams Free
- Azure Architecture Free
- Cisco Network Diagrams Free
- Cisco Networking Free
- Cloud Computing Diagrams Free
- Computer Network Diagrams Free
- Google Cloud Platform Free
- Interactive Voice Response Diagrams Free
- Network Layout Floor Plans Free
- Network Security Diagrams Free
- Rack Diagrams Free
- Telecommunication Network Diagrams Free
- Vehicular Networking Free
- Wireless Networks Free
- Comparison Dashboard Free
- Composition Dashboard Free
- Correlation Dashboard Free
- Frequency Distribution Dashboard Free
- Meter Dashboard Free
- Spatial Dashboard Free
- Status Dashboard Free
- Time Series Dashboard Free
- Basic Circle-Spoke Diagrams Free
- Basic Circular Arrows Diagrams Free
- Basic Venn Diagrams Free
- Block Diagrams Free
- Concept Maps Free
- Family Tree Free
- Flowcharts Free
- Basic Area Charts Free
- Basic Bar Graphs Free
- Basic Divided Bar Diagrams Free
- Basic Histograms Free
- Basic Line Graphs Free
- Basic Picture Graphs Free
- Basic Pie Charts Free
- Basic Scatter Diagrams Free
- Aerospace and Transport Free
- Artwork Free
- Audio, Video, Media Free
- Business and Finance Free
- Computers and Communications Free
- Holiday Free
- Manufacturing and Maintenance Free
- Nature Free
- People Free
- Presentation Clipart Free
- Safety and Security Free
- Analog Electronics Free
- Audio and Video Connectors Free
- Basic Circuit Diagrams Free
- Chemical and Process Engineering Free
- Digital Electronics Free
- Electrical Engineering Free
- Electron Tube Circuits Free
- Electronic Block Diagrams Free
- Fault Tree Analysis Diagrams Free
- GHS Hazard Pictograms Free
- Home Automation and Wiring Free
- Mechanical Engineering Free
- One-line Diagrams Free
- Power Сircuits Free
- Specification and Description Language (SDL) Free
- Telecom and AV Circuits Free
- Transport Hazard Pictograms Free
- Data-driven Infographics Free
- Pictorial Infographics Free
- Spatial Infographics Free
- Typography Infographics Free
- Calendars Free
- Decision Making Free
- Enterprise Architecture Diagrams Free
- Fishbone Diagrams Free
- Organizational Charts Free
- Plan-Do-Check-Act (PDCA) Free
- Seven Management and Planning Tools Free
- SWOT and TOWS Matrix Diagrams Free
- Timeline Diagrams Free
- Australia Map Free
- Continent Maps Free
- Directional Maps Free
- Germany Map Free
- Metro Map Free
- UK Map Free
- USA Maps Free
- Customer Journey Mapping Free
- Marketing Diagrams Free
- Matrices Free
- Pyramid Diagrams Free
- Sales Dashboard Free
- Sales Flowcharts Free
- Target and Circular Diagrams Free
- Cash Flow Reports Free
- Current Activities Reports Free
- Custom Excel Report Free
- Knowledge Reports Free
- MINDMAP Reports Free
- Overview Reports Free
- PM Agile Free
- PM Dashboards Free
- PM Docs Free
- PM Easy Free
- PM Meetings Free
- PM Planning Free
- PM Presentations Free
- PM Response Free
- Resource Usage Reports Free
- Visual Reports Free
- House of Quality Free
- Quality Mind Map Free
- Total Quality Management TQM Diagrams Free
- Value Stream Mapping Free
- Astronomy Free
- Biology Free
- Chemistry Free
- Language Learning Free
- Mathematics Free
- Physics Free
- Piano Sheet Music Free
- Android User Interface Free
- Class Hierarchy Tree Free
- Data Flow Diagrams (DFD) Free
- DOM Tree Free
- Entity-Relationship Diagram (ERD) Free
- EXPRESS-G data Modeling Diagram Free
- IDEF0 Diagrams Free
- iPhone User Interface Free
- Jackson Structured Programming (JSP) Diagrams Free
- macOS User Interface Free
- Object-Role Modeling (ORM) Diagrams Free
- Rapid UML Free
- SYSML Free
- Website Wireframe Free
- Windows 10 User Interface Free
Circular Arrows Diagrams
Circular Arrows Diagrams (Segmented Cycle Diagrams) are an intuitive way to visualize cyclical, repeatable processes in which one action leads to another. They are the perfect way to represent sequence of steps, tasks, or events as a circular flow, to illustrate and analyze conceptual theories, product lifecycles, physical processes and corporate standards.
The steps of the process are shown as arced sections of a ring; each segment ends with an arrow indicating direction of the process flow and links up from the last step to the first. Often the Circular Arrows Diagrams use a color scheme for additional information; this can be used to highlight the importance and priority of a stage.
Circular Arrows Diagrams are great when used to view a processing cycle in management, marketing analysis, business, information technologies, advertising, mass media, PR, and sales.Circular Arrows Diagrams solution extends ConceptDraw DIAGRAM with extensive drawing tools, predesigned samples, Circular flow diagram template for quick start, and a library of ready circular arrow vector stencils for drawing Circular Arrow Diagrams, Segmented Cycle Diagrams, and Circular Flow Diagrams. The elements in this solution help managers, analysts, business advisers, marketing experts, scientists, lecturers, and other knowledge workers in their daily work.
-
Buy this solution $25 -
Solution Requirements - This solution requires the following products to be installed:
ConceptDraw DIAGRAM v18 - This solution requires the following products to be installed:
-
Compatibility - Sonoma (14), Sonoma (15)
MS Windows 10, 11 - Sonoma (14), Sonoma (15)
-
Support for this Solution -
Helpdesk
There is 1 library containing 20 vector objects in the Circular Arrows Diagrams solution.
Design Elements — Circular Arrows Diagrams

Examples
There are a few samples that you see on this page which were created in the ConceptDraw DIAGRAM application by using the Circular Arrows Diagrams solution. Some of the solution's capabilities as well as the professional results which you can achieve are all demonstrated here on this page.
All source documents are vector graphic documents which are always available for modifying, reviewing and/or converting to many different formats, such as MS PowerPoint, PDF file, MS Visio, and many other graphic ones from the ConceptDraw Solution Park or ConceptDraw STORE. The Circular Arrows Diagrams solution is available to all ConceptDraw DIAGRAM users to get installed and used while working in the ConceptDraw DIAGRAM charting and drawing software.
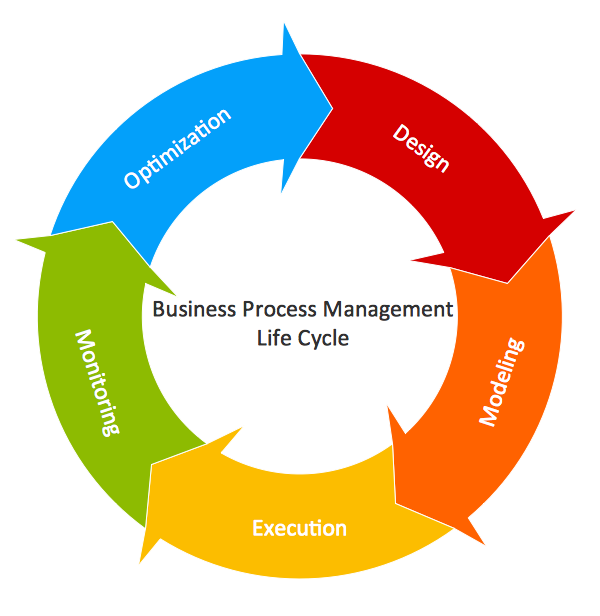
Example 1: Circular Arrows Diagram — BPM Life Cycle
This diagram was created in ConceptDraw DIAGRAM using the Circular Arrows Diagrams Library from the Circular Arrows Diagrams Solution. An experienced user spent 10 minutes creating this sample.
This Circular Arrows Diagram sample represents the main stages of a business process management (BPM) life cycle and was designed based on the Wikimedia Commons file “Business Process Management Life-Cycle.svg”. Business process management is a systematic approach, a management concept that considers and combines the organization's strategy and goals with the expectations and needs of its customers. Organizations use business process management to improve all their business processes, because the success of an organization begins with a clear concept, understanding of customer needs and ends with their implementation. The diagram presents all BPM activities grouped into five main stages connected with each other: design, modeling, execution, monitoring, and optimization. These stages are mandatory for companies of any direction and location. And the last touch — add visibility and appeal to your diagram, simplify its memorization and highlight each stage with its own bright color.

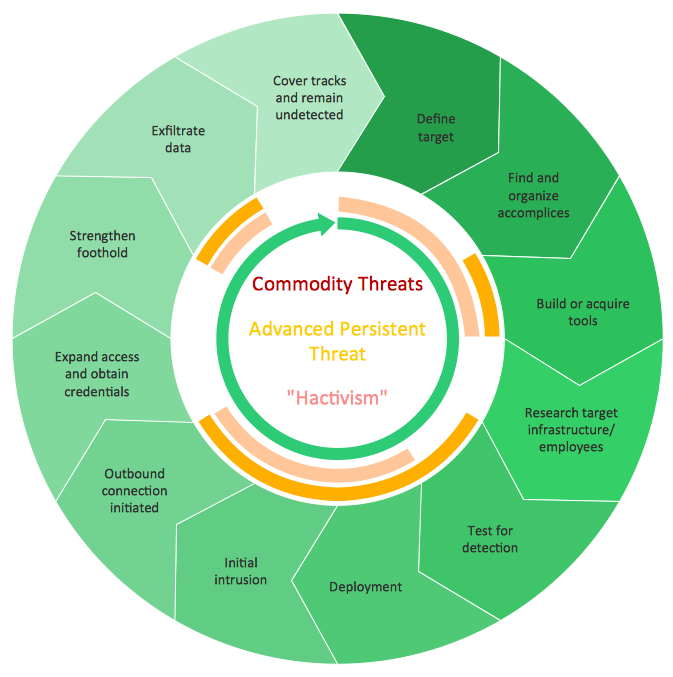
Example 2: Circular Arrows Diagram — Advanced Persistent Threat Lifecycle
This diagram was created in ConceptDraw DIAGRAM using the Circular Arrows Diagrams Library from the Circular Arrows Diagrams Solution. An experienced user spent 15 minutes creating this sample.
This sample shows a Circular Arrows Diagram that describes an Advanced Persistent Threat (APT) lifecycle. Advanced Persistent Threat is a set of continuous processes that possess a high degree of covertness and are organized by a human as hacking actions targeting a particular entity, organization or nation for political or business reasons. The term is applied for cyber threats and attacks of different kinds, espionage, access to confidential information, gathering intelligence information. It commonly supposes the application of sophisticated techniques, malware, through the use of systems' vulnerabilities. The name ATP reflects three main processes: advanced, persistent, and threat, because usually ATP is implemented not by one person, but by organizations, groups of people who purposefully and continuously monitor and extract data from a specific target. You can see how the gradation of color works, the color intensity is reduced from stage to stage, emphasizing the importance and priority of the most intensely colored stages.

Example 3: Circular Arrows Diagram — Conservation Measures Partnership CMP Cycle
This diagram was created in ConceptDraw DIAGRAM using the Circular Arrows Diagrams Library from the Circular Arrows Diagrams Solution. An experienced user spent 10 minutes creating this sample.
This sample shows the Circular Arrows Diagram of the Conservation Measures Partnership (CMP) adaptive management (AM) lifecycle. Adaptive resource management is an iterative structured process designed to make decisions in the face of unpredictability, helping to reduce unpredictability over time through system monitoring and finding effective methods for managing complex dynamic business systems. Thus, the decision-making under AM conditions meets not only the goals of resource management, but also allows you to accumulate information that can improve the management process; such accumulation can be implemented both passively and actively. Adaptive management allows learning system and changing it, as well as improving long-run management outcomes. That's why it is important to find the correct balance between gaining knowledge to improve management and achieve the best short-term outcome. Each stage has a detailed description in this complex chart that however was easily created with ConceptDraw DIAGRAM. By using the predesigned objects contained in the library one can draw a similar diagram in a few minutes.

Example 4: Circular Arrows Diagram — Systems Development Life Cycle
This diagram was created in ConceptDraw DIAGRAM using the Circular Arrows Diagrams Library from the Circular Arrows Diagrams Solution. An experienced user spent 5 minutes creating this sample.
This Circular Arrows Diagram shows the Systems Development Life Cycle (SDLC) applied in software engineering, systems engineering, information systems. SDLC is a period of time during which a product is developed; it starts from the moment a decision is made to develop a new product and ends with testing the finished product. This process includes five main clearly defined work phases: design, implementation, testing, evaluation, and analysis. The cycle may include some additional stages, such as planning, requirements analysis, documentation, evaluation, deployment of the information system. If they are present, you can display them in a diagram. The lifecycle model depends on the specifics, scale, complexity of the project, as well as on the specific conditions in which the system is created and operates. This diagram is clear, accurate, stylish, professional-looking and can be successfully used in different presentations, reports, conferences, reportages, reviews, etc. One can also highlight the stage which the product development is currently at.

Example 5: Circular Arrows Diagram — Emergency Management Process
This diagram was created in ConceptDraw DIAGRAM using the Circular Arrows Diagrams Library from the Circular Arrows Diagrams Solution. An experienced user spent 5 minutes creating this sample.
This Circular Arrows Diagram was designed based on the "Emergency Management" article and image published on the website of Downey City Hall, California, U.S. It illustrates the steps in the emergency management process to reduce vulnerability to hazards and deal with disasters if they occur. The process includes four phases: mitigation, preparedness, response, and recovery. The mitigation phase focuses on long-term measures for preventing hazards from developing into disasters, reducing effects, eliminating risks. The preparedness phase is dedicated to the development the plans of actions for when the disasters strike. The response phase includes all variety of emergency services, firefighters, police, EMS crews and first responders in the disaster areas. The recovery phase is designed to restore the affected area to its previous state, restore damaged property and other infrastructure, and re-employment. This diagram is designed based on a ready-made circular arrow object chosen from the variety offered by the Circular Arrows Diagrams solution. Bright colors and included clipart make this diagram exceptional.

Example 6: Circular Arrows Diagram — Emergency Management Exercise Cycle
This diagram was created in ConceptDraw DIAGRAM using the Circular Arrows Diagrams Library from the Circular Arrows Diagrams Solution. An experienced user spent 5 minutes creating this sample.
This Circular Arrows Diagram sample shows the emergency management exercise cycle stages. It was designed in ConceptDraw DIAGRAM based on the chart from the Emergency Management Institute training IS-120.b webpage placed on the website of the Federal Emergency Management Agency (FEMA) of the United States Department of Homeland Security. The exercises are realized by states, communities, and regions, and suppose the special tools and plans developed with an aim to prevent hazards and disasters of any nature, prepare for them, reduce vulnerability, effectively respond them, decrease the effect of disasters as possible, and recover all consequences. The emergency plan development requires special attention because any mistakes can entail the loss of people's lives, missing revenue, and significant assets damage as well. There are four stages included: 1) Strategy plan, 2) Improvement planning, 3) Design and development, 4) Conduct and evaluation. The first two stages refer to the program management, and the last ones — to the project management.

Example 7: Circular Arrows Diagram — Innovation Life Cycle
This diagram was created in ConceptDraw DIAGRAM using the Circular Arrows Diagrams Library from the Circular Arrows Diagrams Solution. An experienced user spent 5 minutes creating this sample.
This Circular Arrows Diagram sample illustrates the innovation's life cycle stages. It was constructed based on the diagram from the website of the Federal Highway Administration (FHWA) of the U.S. Department of Transportation (DOT). The "innovation" term means the introduction of something new. The new method, device, or newest idea, better solution, are considered as the innovations and usually meet new requirements and existing market needs. This can be also the more effective process, service, or business model, more original product or technology having technical or scientific nature. Typically, the innovation "breaks into" the market and society, has a great impact on them and drives economic growth. The innovations can be found in economics, management science, IT, business, engineering, technology, sociology, history, as well as in many other fields. The social and economic innovations can occur spontaneously and can be predicted. A number of economic strategies, theories, mathematical formulas, and computerized business models are used to predict the innovations' impact.

Example 8: Circular Arrows Diagram — Performance and Power Modeling
This diagram was created in ConceptDraw DIAGRAM using the Circular Arrows Diagrams Library from the Circular Arrows Diagrams Solution. An experienced user spent 5 minutes creating this sample.
This Circular Arrows Diagram example is dedicated to performance and power modeling. It is a Performance and Architecture Laboratory (PAL) circle that includes five components: programming model, hardware, system software, runtime, and compiler. The sample was designed based on the diagram published on the U.S. Department of Energy website in the "Advanced Computing, Mathematics and Data Division Research Highlights" article from the Pacific Northwest National Laboratory (PNNL) section. PAL is a department in Pacific Northwest National Laboratory (PNNL), which focuses on the power and energy problems affecting high-performance computing (HPC) and achievement practical efficiency at the exascale. The algorithms and methods developed by PAL scientists use the accurate per-core proxy power sensor model to estimate the core's active power and provide the capability of workload-specific quantitative power modeling. The models record the workload phases, their impact on power consumption, as well as influence of the system architecture and processor clock speeds.
Example 9: Circular Arrows Diagram — Training and Exercise Process Wheel
This diagram was created in ConceptDraw DIAGRAM using the Circular Arrows Diagrams Library from the Circular Arrows Diagrams Solution. An experienced user spent 5 minutes creating this sample.
This Wheel diagram sample shows emergency preparedness training and exercise processes. It was designed based on the diagram from the "Public Health Preparedness Training and Exercise" webpage published on the FloridaHealth website of the Florida Department of Health. The diagram includes the following points: training and exercise planning, curriculum and exercise review, training, exercises, credentialing, and evaluation. The emergency preparedness term includes all steps needed to be taken to avoid emergencies, and natural or manmade disasters, to make sure the safety is ensured during and after, as well as actions for dealing. It involves the consideration and preparation of all variety of fast reaction methods in order to reduce the negative impact, mitigate and eliminate the consequences of emergencies and disasters. The organization of emergency management requires a collaborative work of all levels of government: local, state and federal, and all directions of the private sector, such as business, industry, public and voluntary organizations.

Example 10: Circular Arrows Diagram — Key Components of Performance Landscape
This diagram was created in ConceptDraw DIAGRAM using the Circular Arrows Diagrams Library from the Circular Arrows Diagrams Solution. An experienced user spent 5 minutes creating this sample.
This Circular Arrows Diagram sample was developed based on the chart from the "Performance Management — A Leadership Priority" webpage published on the US Department of State website. It shows the relationships between the key components of the performance landscape. Performance management (PM) is a system of management teams and individual employees ensuring the consistent and effective implementation of goals and achievement the maximal performance of the whole organization, as well as its separate departments and individual employees. It includes a set of effective activities aimed at common understanding the goals and approaches for organizing work and training employees and may contain a great number of tasks and special actions. This sample offers the key points and tools of performance management in a visual form of Circular Arrow Diagram: mission performance plan, bureau performance plan, department performance plan, mission performance report, department state, and USAID strategic plan.
Inside


What I Need to Get Started
After ConceptDraw DIAGRAM is installed, the Circular Arrows Diagrams solution can be purchased either from the Diagrams area of ConceptDraw STORE itself or from our online store. Thus, you will be able to use the Circular Arrows Diagrams solution straight after.

How to install
First of all, make sure that both ConceptDraw STORE and ConceptDraw DIAGRAM applications are downloaded and installed on your computer. Next, install the Circular Arrows Diagrams solution from the ConceptDraw STORE to use it in the ConceptDraw DIAGRAM application.

Start using
Start using the Circular Arrows Diagrams solution to make the professionally looking diagrams by adding the design elements taken from the stencil libraries and editing the pre-made examples that can be found there.

Circular Arrows Diagrams
The use of circular arrows as a simple diagram style is utilized by knowledge workers to visually represent a circular, repeating process or lifecycle. The steps in the process are shown as a ring segment, an arcuate portion ending in an arrow that indicates the direction of the process flow. Thus, the process forms a continuous cycle; the last step of the process leading to the first.
Circular arrows diagrams are used in many different business and educational settings, and can go under a number of different names depending on user preference. Here are a few alternate synonyms that may be used:
- Arrows cycle diagram
- Circle arrows diagram
- Circular chevron diagram
- Circular flow diagram
- Circular multi-arrows diagram
- Circular process diagram
- Cycle diagram
- Segmented cycle diagram
Each one essentially describes the same style. Through this basic premise, a large variety of physical processes and conceptual theories can be explored, presented and analyzed. In a business environment, circular arrows diagrams are used to distil company strategies into easily digestible and repeatable slogans, that can form the basis of internal company policy. Their use is also widespread in marketing and sales — here the cycle can include point of sales and customer interactions, to give some feedback on processes that are external to the business. Product lifecycles, corporate standards, or a design process; all can be shown using circular arrows.
A basic circular arrows diagram, made using ConceptDraw DIAGRAM, with the central concept stated
With a neat, succinct form that can break any topic down into inter-related points, circular arrows diagrams are an ideal method for sharing relatively complex ideas with a large audience, pointing to the central concept in a way that's easy for the viewer to follow — the idea of cyclic processes is an intuitive one, with each point leading directly to the next, and all in support of base subject. Due to this, it is common to find circular arrows diagrams in advertising, news media, infographics, and as an educational tool — often as a visual reference to a central theme, accompanied by supporting text or illustrations.
This diagram uses a color scheme for additional information — shades of green denote process start/end, while colored arcs reference the central text
ConceptDraw DIAGRAM can now be extended with the tools needed for those wishing to use this diagramming technique. The Circular Arrows Diagrams solution supplies knowledge workers with a full package of templates, vector graphic stencils, and help and learning materials to give users of any experience a helping hand with their diagramming.
The vector graphics within the solution library are professionally designed, especially for ConceptDraw DIAGRAM, with its powerful features and functionality that allow for full control and a variety of visual styles when creating your diagram. The solution is adaptable — segments can be added and taken away from the initial design with just a few clicks, and a full range of color options let you give your diagram the aesthetic you need.
Circular arrows diagrams can be stand alone concepts, viewed directly as they were made through PRO For those with wider needs for their diagram, ConceptDraw is on hand to help — a full range of exporting options and presentation facilities are offered, to ensure your diagram is seen by those who need to see it. As an integrated part of the ConceptDraw Office suite, diagrams made in PRO can be shared with other ConceptDraw products to enhance project material and facilitate worker collaboration.
The Circular Arrows Diagram for ConceptDraw DIAGRAM is another invaluable tool for business people, knowledge workers and educators.