How to Draw a Circular Arrows Diagram
Many processes in astronomy, biology, chemistry, physics, mathematics, etc. have cycle properties. It is also widely used in information technologies and marketing analysis. Graphical representation of cyclic processes can have many forms. It can be a circle, parabola, hyperbola, ellipse, and others. Circular Arrows Diagrams are usually used to represent cyclical processes, where one action leads to another ultimately influencing the first step. ConceptDraw DIAGRAM allows you to draw a Circular Arrows Diagram using the Circular Arrows Diagram solution.
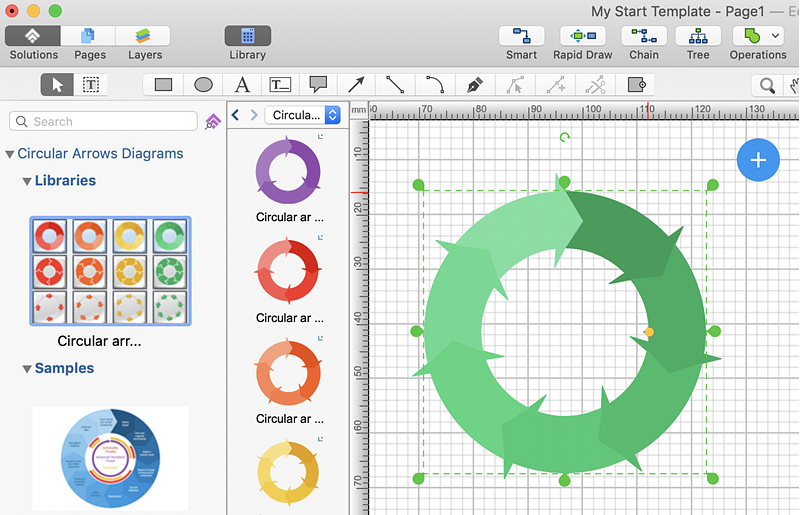
- Open a ConceptDraw DIAGRAM new document and select the Circular Arrows Diagrams library.
- Add the diagram to the document by dragging it from the library to the document page.

- To make changes in your diagram use the Action button menu. To open the menu select an object and click the
 button in the upper right corner of the object. button in the upper right corner of the object.
- To change the thickness of the arrows select the diagram, then move the control dot.
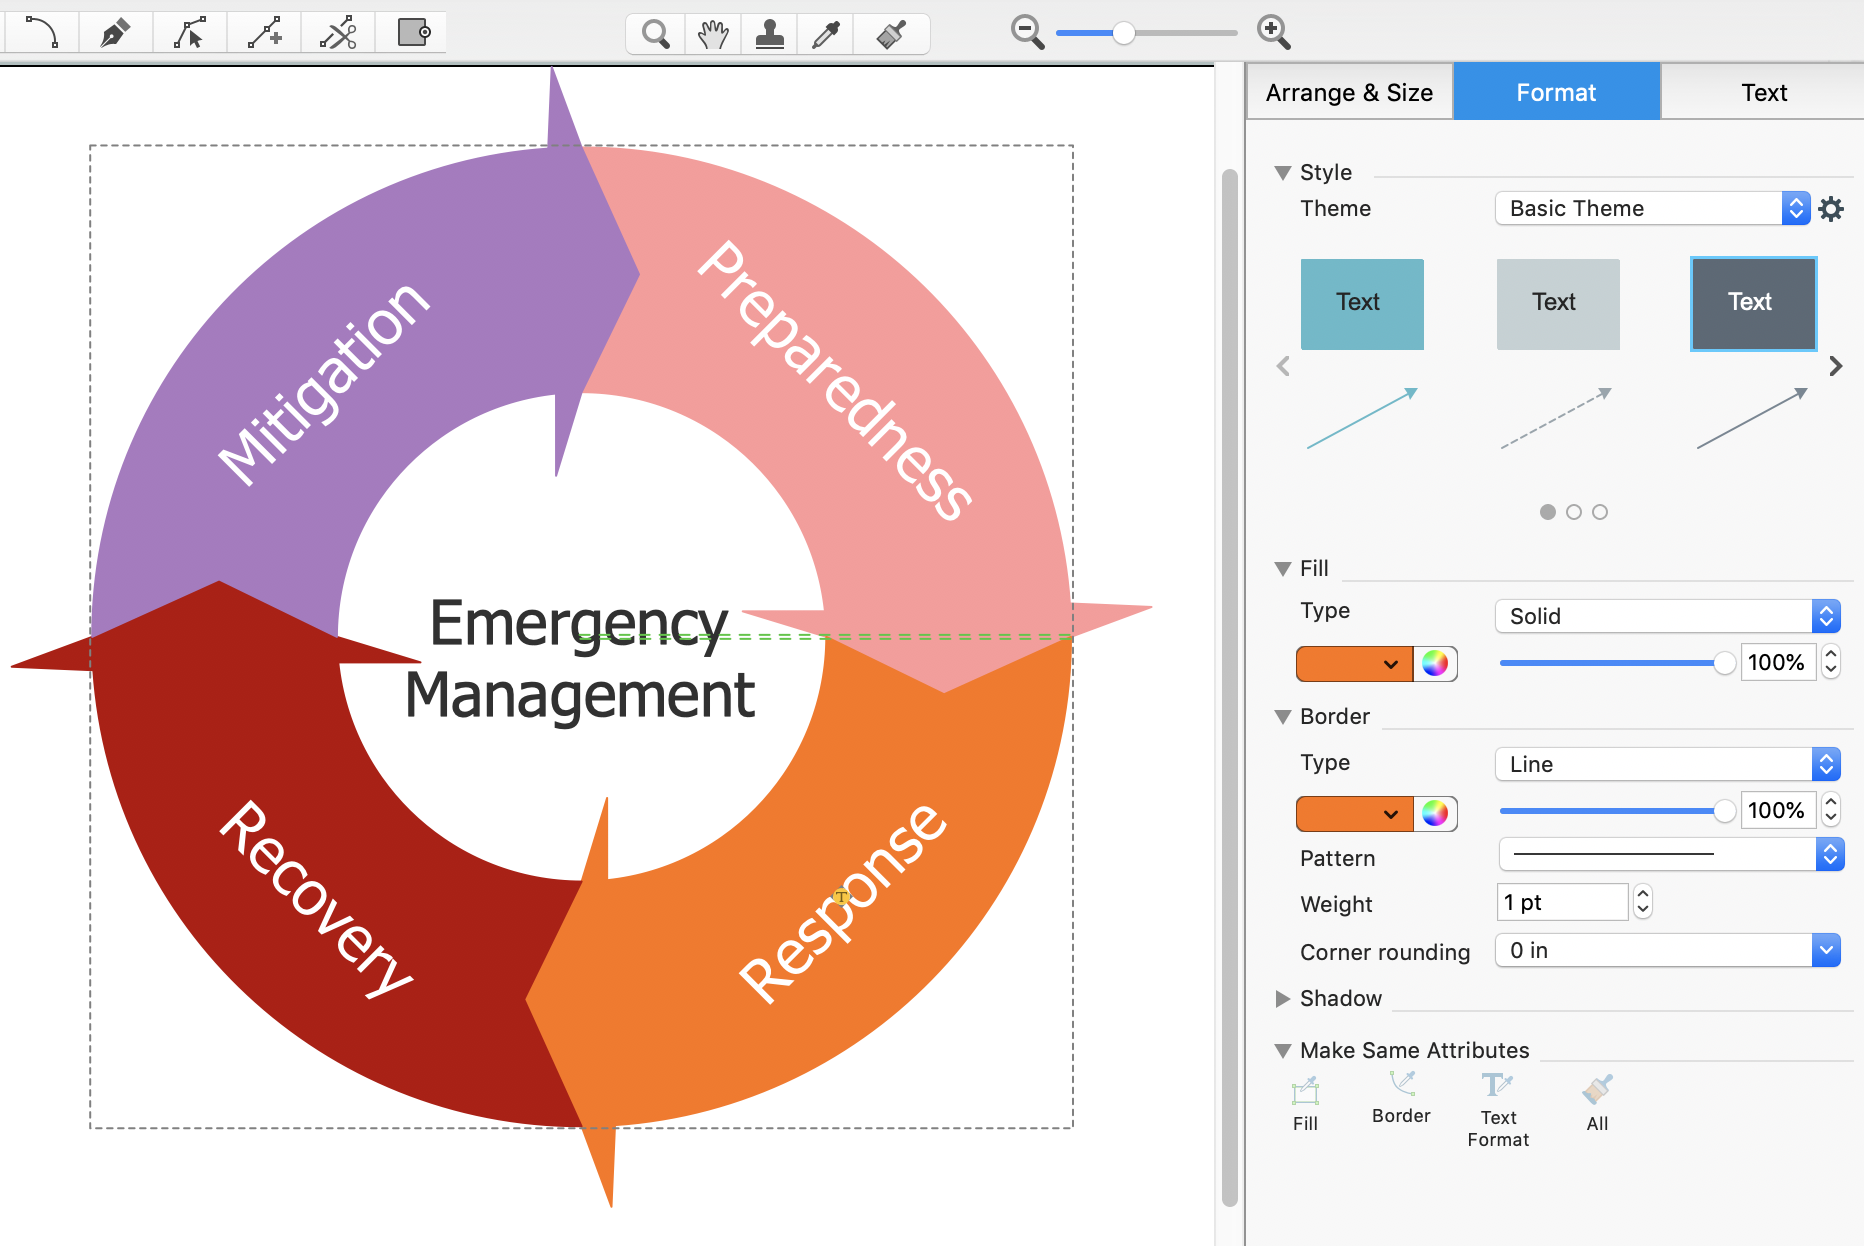
- To add text, select diagram, then select the arrow, and start typing. You can easily change a text position by using the control dot.

- Use Line, Fill and Shadow tools provided in the Format panel to format the diagram elements.

Result: A Circular Arrows Diagram is used as one of the statistical charts in the business, mass media and is quite popular for representing marketing concepts as well.

|
How it works:
- Set of ready-to-use templates supplied with ConceptDraw DIAGRAM
- Collection of professional samples supports each template
- Professional drawing tools
Useful Solutions and Products:
- Easily draw charts and diagrams.
- Visualize business information
- Block Diagrams
- Bubble Diagrams
- Circle-Spoke Diagrams
- Circular Arrows Diagrams
- Concept Maps
- Flowcharts
- Venn Diagrams
- Marketing and sales communication visualization
- Marketing Diagrams
- Matrices
- Pyramid Diagrams
- Sales Dashboard
- Sales Flowcharts
- Target and Circular Diagrams
- Diagramming and Charts
- Vector Illustrations
- Maps
- Floor plans
- Engineering drawings
- Business dashboards
- Infographics
- Presentation
- Over 10 000 vector stencils
- Export to vector graphics files
- Export to Adobe Acrobat® PDF
- Export to MS PowerPoint®
- Export to MS Visio® VSDX, VDX
|


 Business-specific Drawings