- Electric and Telecom Plans Free
- Fire and Emergency Plans Free
- Floor Plans Free
- Plant Layout Plans Free
- School and Training Plans Free
- Seating Plans Free
- Security and Access Plans Free
- Site Plans Free
- Sport Field Plans Free
- Business Process Diagrams Free
- Business Process Mapping Free
- Classic Business Process Modeling Free
- Cross-Functional Flowcharts Free
- Event-driven Process Chain Diagrams Free
- IDEF Business Process Diagrams Free
- Logistics Flow Charts Free
- Workflow Diagrams Free
- ConceptDraw Dashboard for Facebook Free
- Mind Map Exchange Free
- MindTweet Free
- Note Exchange Free
- Project Exchange Free
- Social Media Response Free
- Active Directory Diagrams Free
- AWS Architecture Diagrams Free
- Azure Architecture Free
- Cisco Network Diagrams Free
- Cisco Networking Free
- Cloud Computing Diagrams Free
- Computer Network Diagrams Free
- Google Cloud Platform Free
- Interactive Voice Response Diagrams Free
- Network Layout Floor Plans Free
- Network Security Diagrams Free
- Rack Diagrams Free
- Telecommunication Network Diagrams Free
- Vehicular Networking Free
- Wireless Networks Free
- Comparison Dashboard Free
- Composition Dashboard Free
- Correlation Dashboard Free
- Frequency Distribution Dashboard Free
- Meter Dashboard Free
- Spatial Dashboard Free
- Status Dashboard Free
- Time Series Dashboard Free
- Basic Circle-Spoke Diagrams Free
- Basic Circular Arrows Diagrams Free
- Basic Venn Diagrams Free
- Block Diagrams Free
- Concept Maps Free
- Family Tree Free
- Flowcharts Free
- Basic Area Charts Free
- Basic Bar Graphs Free
- Basic Divided Bar Diagrams Free
- Basic Histograms Free
- Basic Line Graphs Free
- Basic Picture Graphs Free
- Basic Pie Charts Free
- Basic Scatter Diagrams Free
- Aerospace and Transport Free
- Artwork Free
- Audio, Video, Media Free
- Business and Finance Free
- Computers and Communications Free
- Holiday Free
- Manufacturing and Maintenance Free
- Nature Free
- People Free
- Presentation Clipart Free
- Safety and Security Free
- Analog Electronics Free
- Audio and Video Connectors Free
- Basic Circuit Diagrams Free
- Chemical and Process Engineering Free
- Digital Electronics Free
- Electrical Engineering Free
- Electron Tube Circuits Free
- Electronic Block Diagrams Free
- Fault Tree Analysis Diagrams Free
- GHS Hazard Pictograms Free
- Home Automation and Wiring Free
- Mechanical Engineering Free
- One-line Diagrams Free
- Power Сircuits Free
- Specification and Description Language (SDL) Free
- Telecom and AV Circuits Free
- Transport Hazard Pictograms Free
- Data-driven Infographics Free
- Pictorial Infographics Free
- Spatial Infographics Free
- Typography Infographics Free
- Calendars Free
- Decision Making Free
- Enterprise Architecture Diagrams Free
- Fishbone Diagrams Free
- Organizational Charts Free
- Plan-Do-Check-Act (PDCA) Free
- Seven Management and Planning Tools Free
- SWOT and TOWS Matrix Diagrams Free
- Timeline Diagrams Free
- Australia Map Free
- Continent Maps Free
- Directional Maps Free
- Germany Map Free
- Metro Map Free
- UK Map Free
- USA Maps Free
- Customer Journey Mapping Free
- Marketing Diagrams Free
- Matrices Free
- Pyramid Diagrams Free
- Sales Dashboard Free
- Sales Flowcharts Free
- Target and Circular Diagrams Free
- Cash Flow Reports Free
- Current Activities Reports Free
- Custom Excel Report Free
- Knowledge Reports Free
- MINDMAP Reports Free
- Overview Reports Free
- PM Agile Free
- PM Dashboards Free
- PM Docs Free
- PM Easy Free
- PM Meetings Free
- PM Planning Free
- PM Presentations Free
- PM Response Free
- Resource Usage Reports Free
- Visual Reports Free
- House of Quality Free
- Quality Mind Map Free
- Total Quality Management TQM Diagrams Free
- Value Stream Mapping Free
- Astronomy Free
- Biology Free
- Chemistry Free
- Language Learning Free
- Mathematics Free
- Physics Free
- Piano Sheet Music Free
- Android User Interface Free
- Class Hierarchy Tree Free
- Data Flow Diagrams (DFD) Free
- DOM Tree Free
- Entity-Relationship Diagram (ERD) Free
- EXPRESS-G data Modeling Diagram Free
- IDEF0 Diagrams Free
- iPhone User Interface Free
- Jackson Structured Programming (JSP) Diagrams Free
- macOS User Interface Free
- Object-Role Modeling (ORM) Diagrams Free
- Rapid UML Free
- SYSML Free
- Website Wireframe Free
- Windows 10 User Interface Free
Presentation Clipart
A presentation is a process of introducing some topic to other people called an “audience”. Being a typical introduction, demonstration, speech or lecture, any presentation is meant to persuade, inform or present some new idea or a new product. The term “presentation” can also be used for either a ritualized or formal offering or introduction.
A slide show may be called a presentation of a series of a number still images as well. It is usually a projection of some images and text to a screen or to an electronic display device. Usually, it is made in a prearranged sequence. All the changes of the slides may be either automatic at some regular intervals or manually controlled. A presenter or the viewer can control the slides if they wish.
Originally consisted of a series of individual photographic slides that are projected onto a screen by using a slide projector, slide shows may be a presentation of some images purely in order to satisfy someone’s artistic value or visual interest, or accompanied by short text or description. They may be also used for clarifying or reinforcing ideas, information, comments, suggestions or solutions which may be presented verbally.
A well-organized slide show or presentation may allow its presenter to fit the needed visual images to an oral presentation adding a certain amount of experience, rehearsal, and talent leading to having a successful result. For making the presentation-related drawings, the Presentation Clipart solution may be used as it offers the pre-made samples and templates of different illustrations as well as stencil libraries full of vector shapes.
The Presentation Clipart solution may be useful for all the ConceptDraw DIAGRAM users, especially those who either have their own business or run someone’s working for someone making the professionally-looking illustrating presentation slides to use in their documents and websites having the most popular presentation symbols (e.g., arrows, backgrounds, callouts, borders, title blocks, and frames) available at all times.
-
Install this solution Free -
What I need to get started -
Solution Requirements - This solution requires the following products to be installed:
ConceptDraw DIAGRAM v18 - This solution requires the following products to be installed:
-
Compatibility - Sonoma (14), Sonoma (15)
MS Windows 10, 11 - Sonoma (14), Sonoma (15)
-
Support for this Solution -
Helpdesk
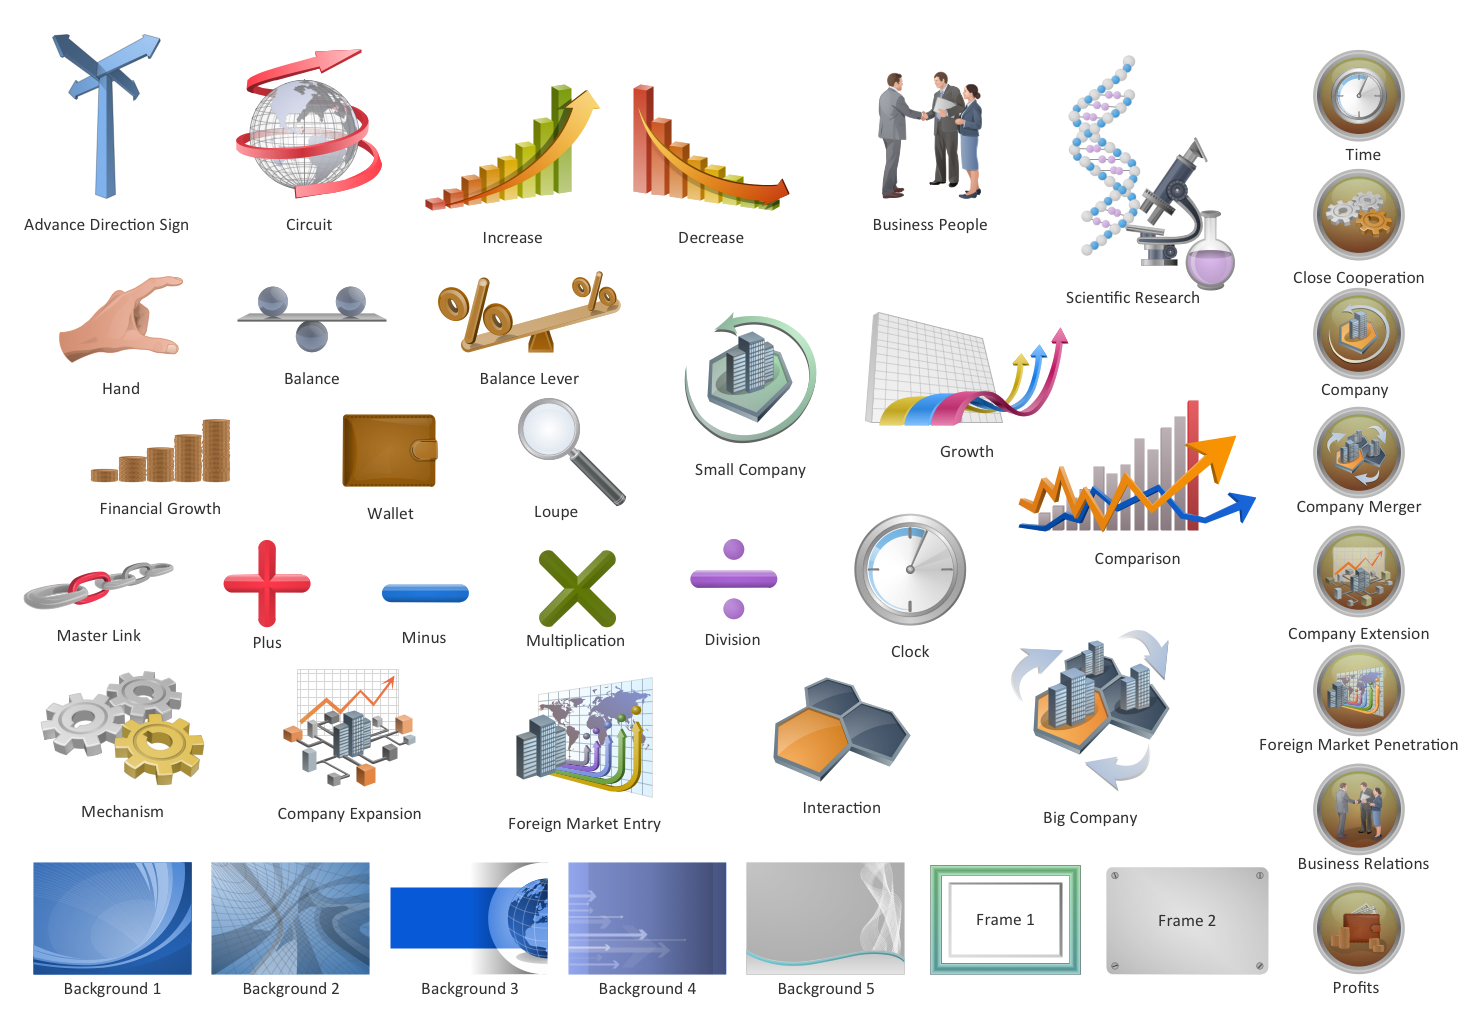
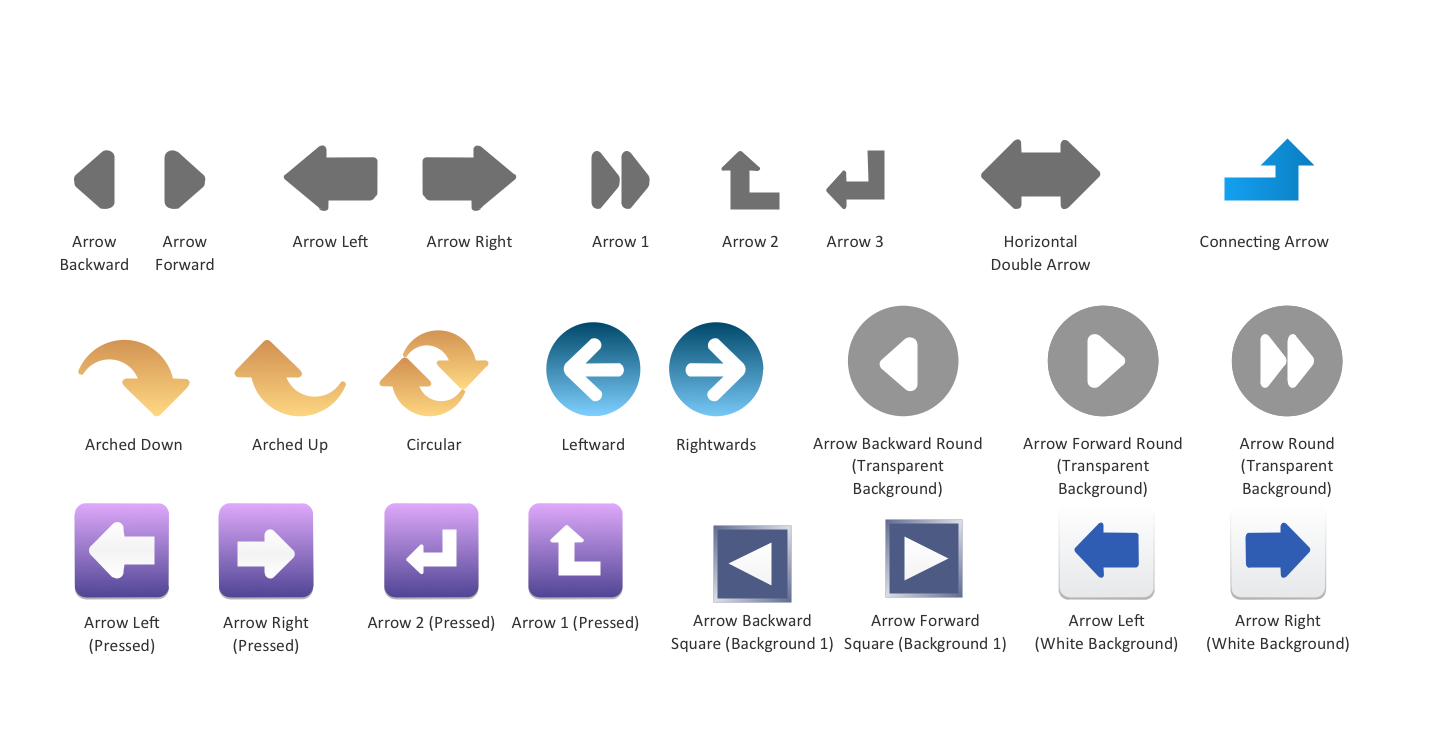
There are 2 clipart libraries containing 82 vector images in the Presentation Clipart solution.
Design Elements — Presentation Symbols
Design Elements — Arrows
Examples
There are a few samples that you see on this page which were created in the ConceptDraw DIAGRAM application by using the Presentation Clipart solution. Some of the solution's capabilities as well as the professional results which you can achieve are all demonstrated here on this page.
All source documents are vector graphic documents which are always available for modifying, reviewing and/or converting to many different formats, such as MS PowerPoint, PDF file, MS Visio, and many other graphic ones from the ConceptDraw Solution Park or ConceptDraw STORE. The Presentation Clipart solution is available to all ConceptDraw DIAGRAM users to get installed and used while working in the ConceptDraw DIAGRAM diagramming and drawing software.
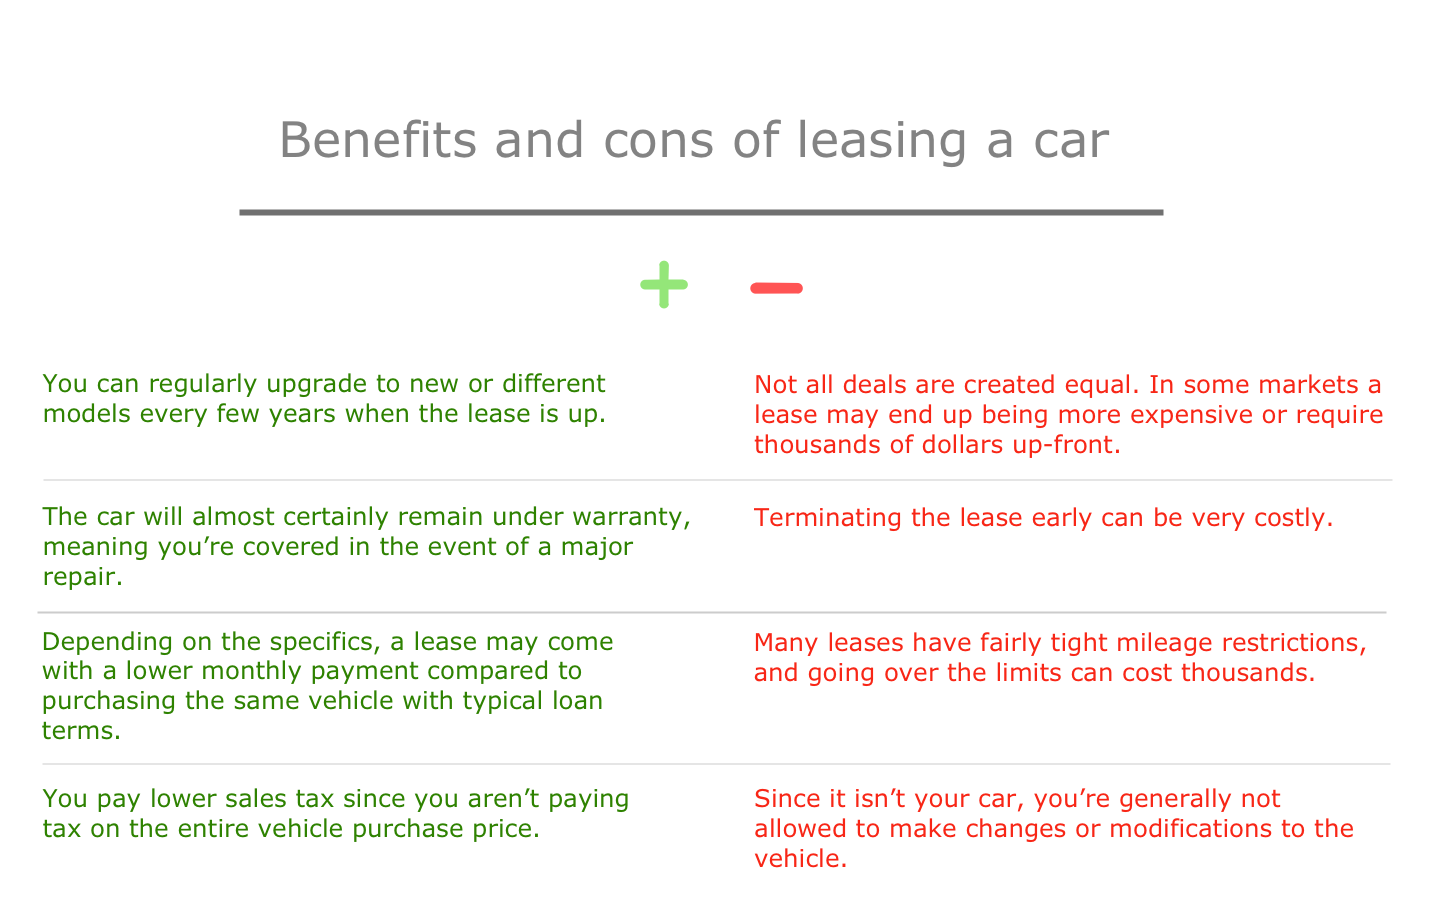
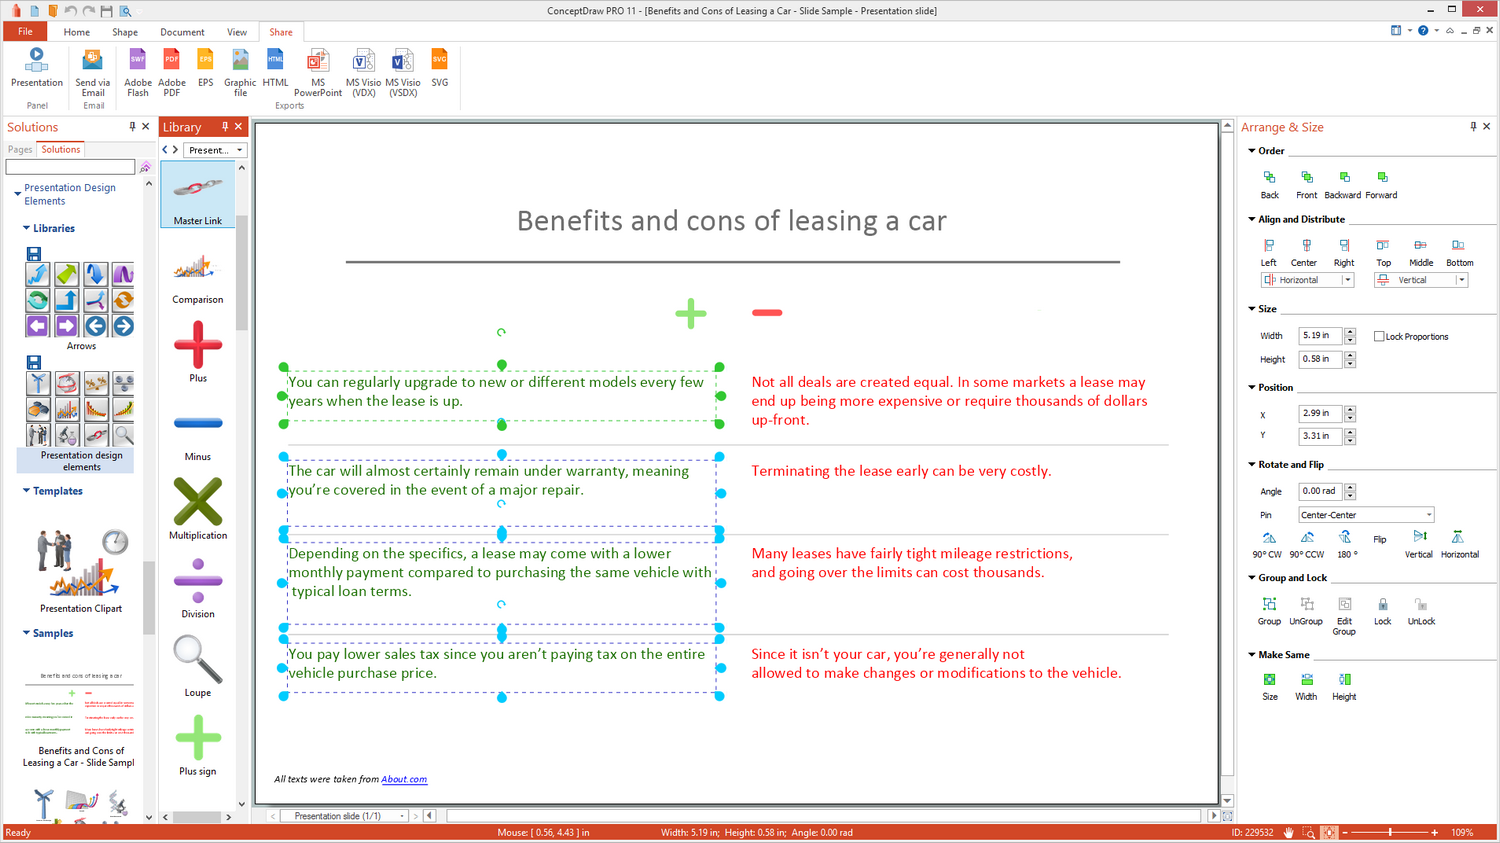
Example 1: Benefits and Cons of Leasing a Car — Slide Sample
This example demonstrates how to create professional-looking slides using ConceptDraw DIAGRAM and the "Presentation Design Elements" library from the Presentation Clipart Solution. An experienced user spent 10 minutes creating this sample.
The secret of producing professional-looking presentations lies in a harmonious combination of texts and symbols. Simple visual markers, such as plus and minus signs in this example, facilitate the perception of your story, and make your presentation clear and bright.
All texts were taken from About.com
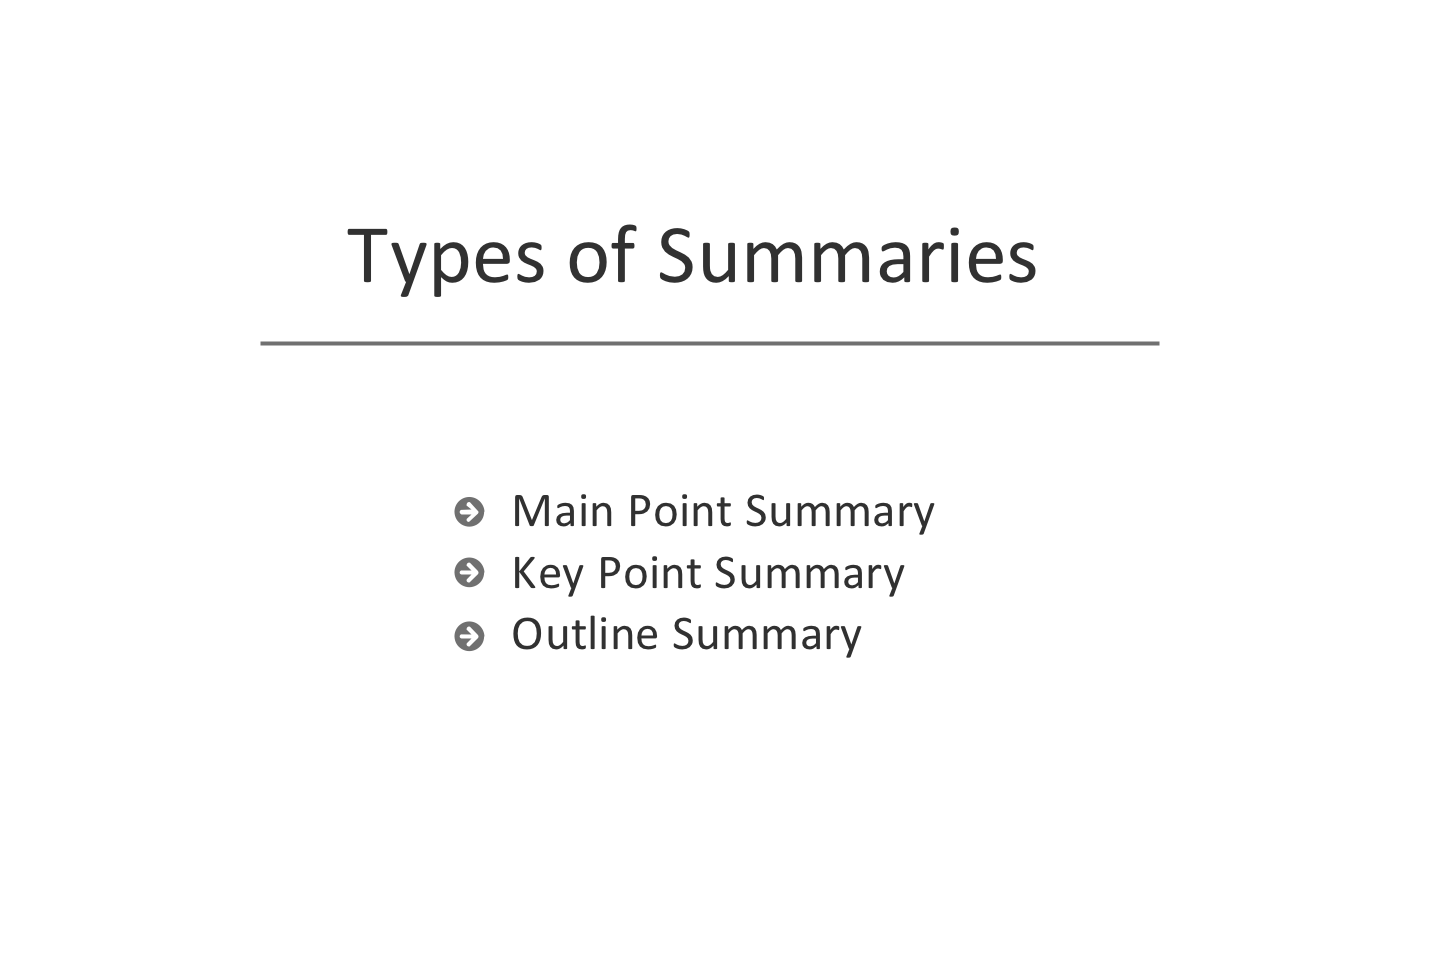
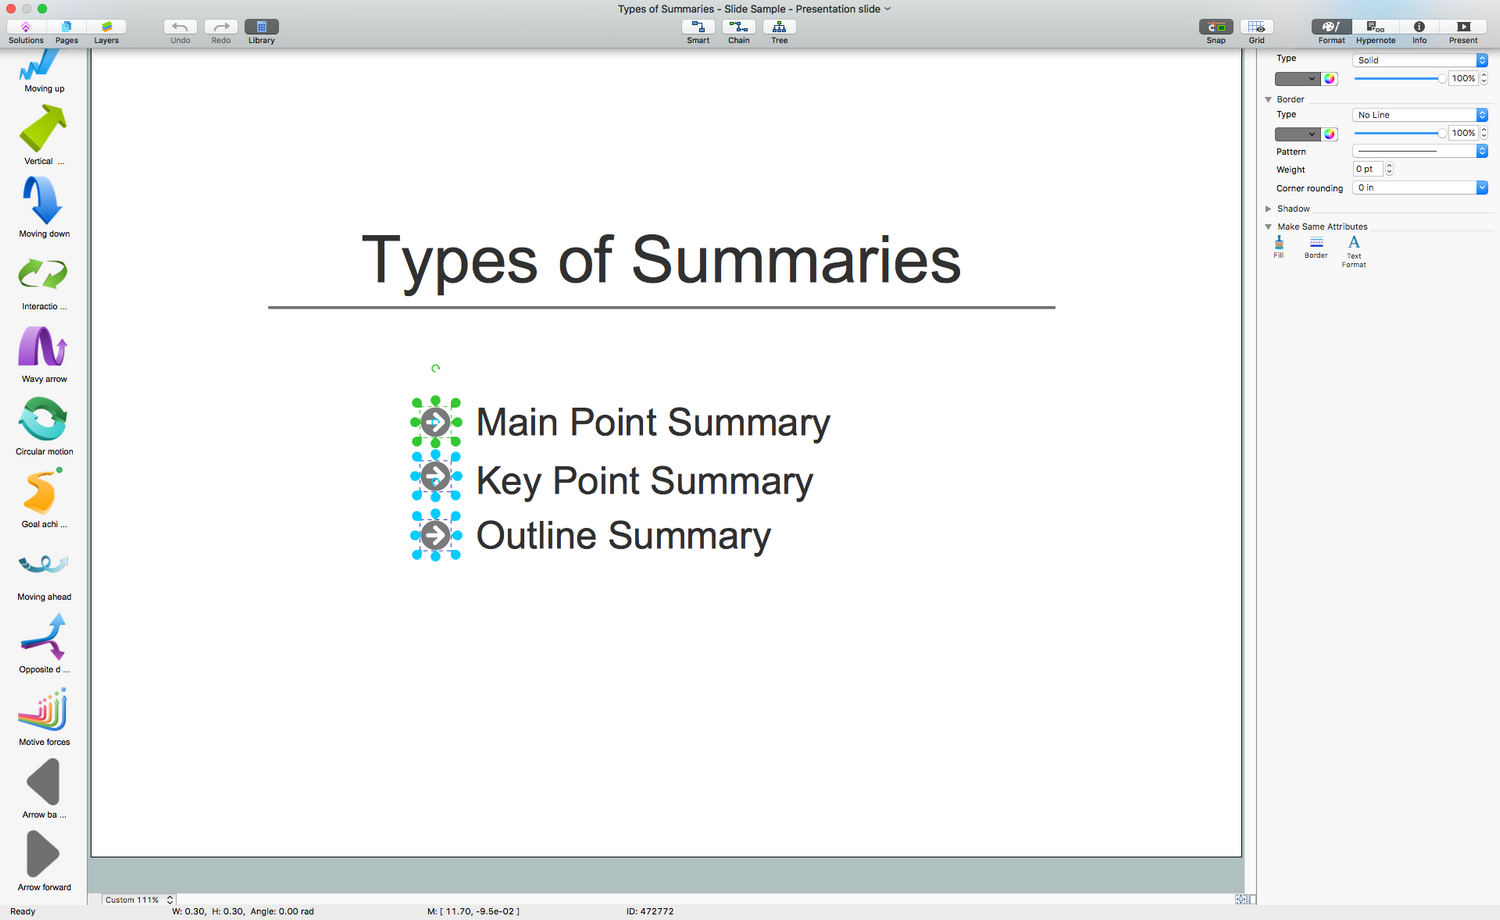
Example 2: Types of Summaries — Slide Sample
This example was created in ConceptDraw DIAGRAM using the Arrows library from the Presentation Clipart Solution. The Arrows library is a great way to add finishing detail to a drawing. An experienced user spent 3 minutes creating this sample.
Using the Arrows library form ConceptDraw DIAGRAM allows one to add accents to a slide. The high resolution vector arrows are perfect for presentation needs, because they scale properly for large screens.
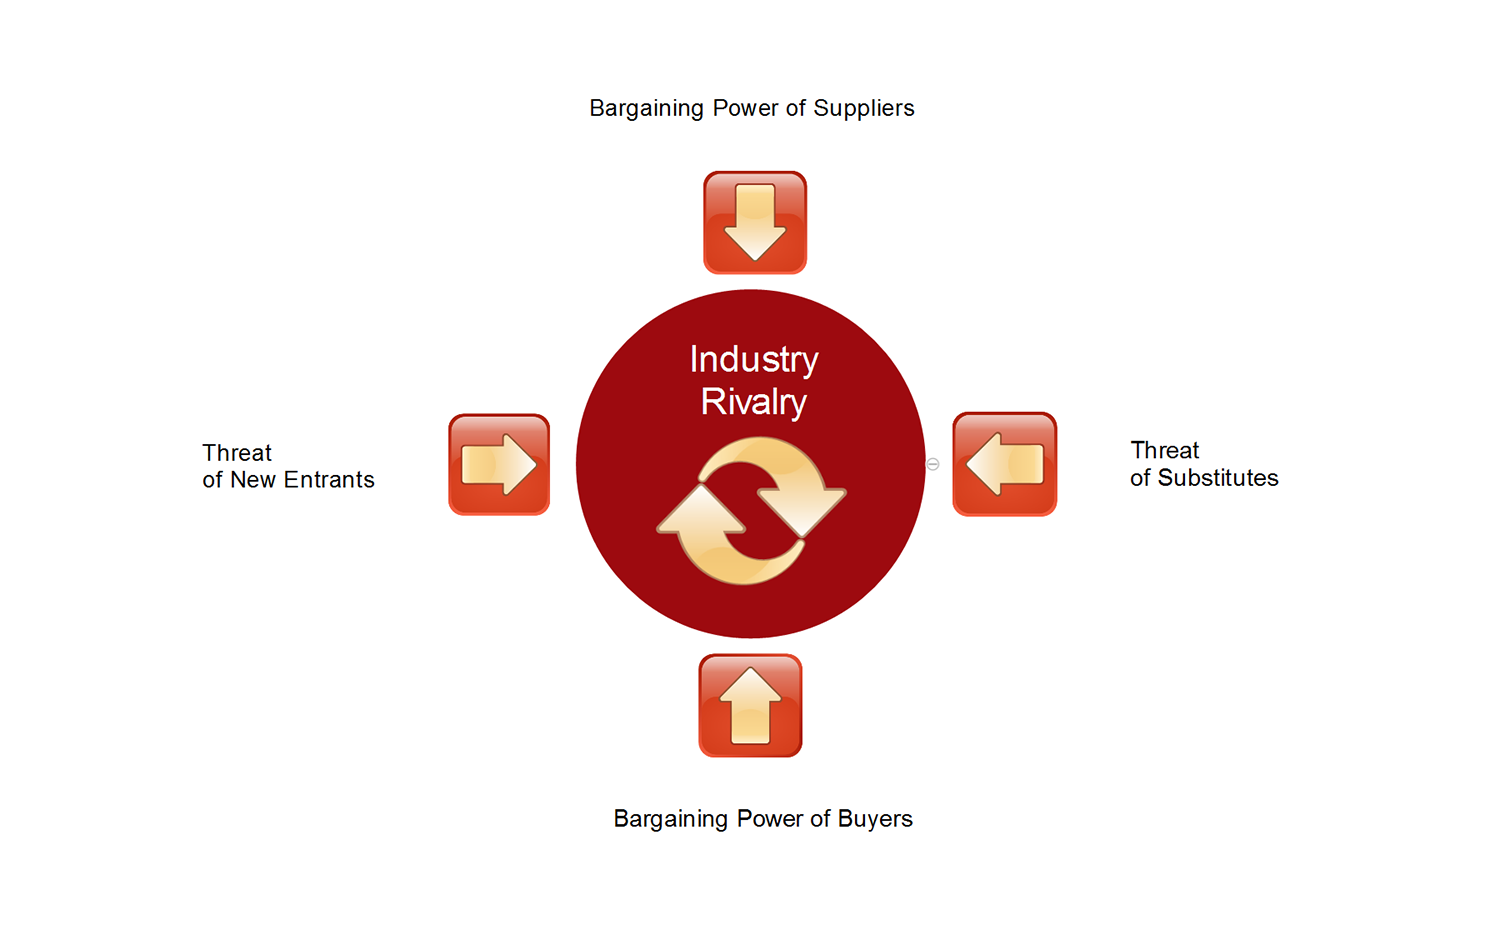
Example 3: Elements of Industry Structure
This Mind Map represents the Michael Porter's Five Forces model, which is a marketing tool applied for analyzing the competition of a business. The five forces, among which are the threat of new entrants, bargaining power of buyers, bargaining power of suppliers, threat of substitutes, and industry rivalry, determine the industry's competitive intensity, its success and attractiveness or vice versa the lack of attractiveness in terms of the profitability. The conclusion of the attractiveness is made when the effect of these five forces increases the overall profitability. At the unattractive industry, the profitability is reduced and even may approach to the pure competition. However, the overall industry's attractiveness doesn't mean that each organization or firm working within this industry returns equally great profitability. The Porter's Five Forces model is based on the paradigm of “structure — conduct — performance” and is an incredibly popular business tool no matter which field of industry you are involved.
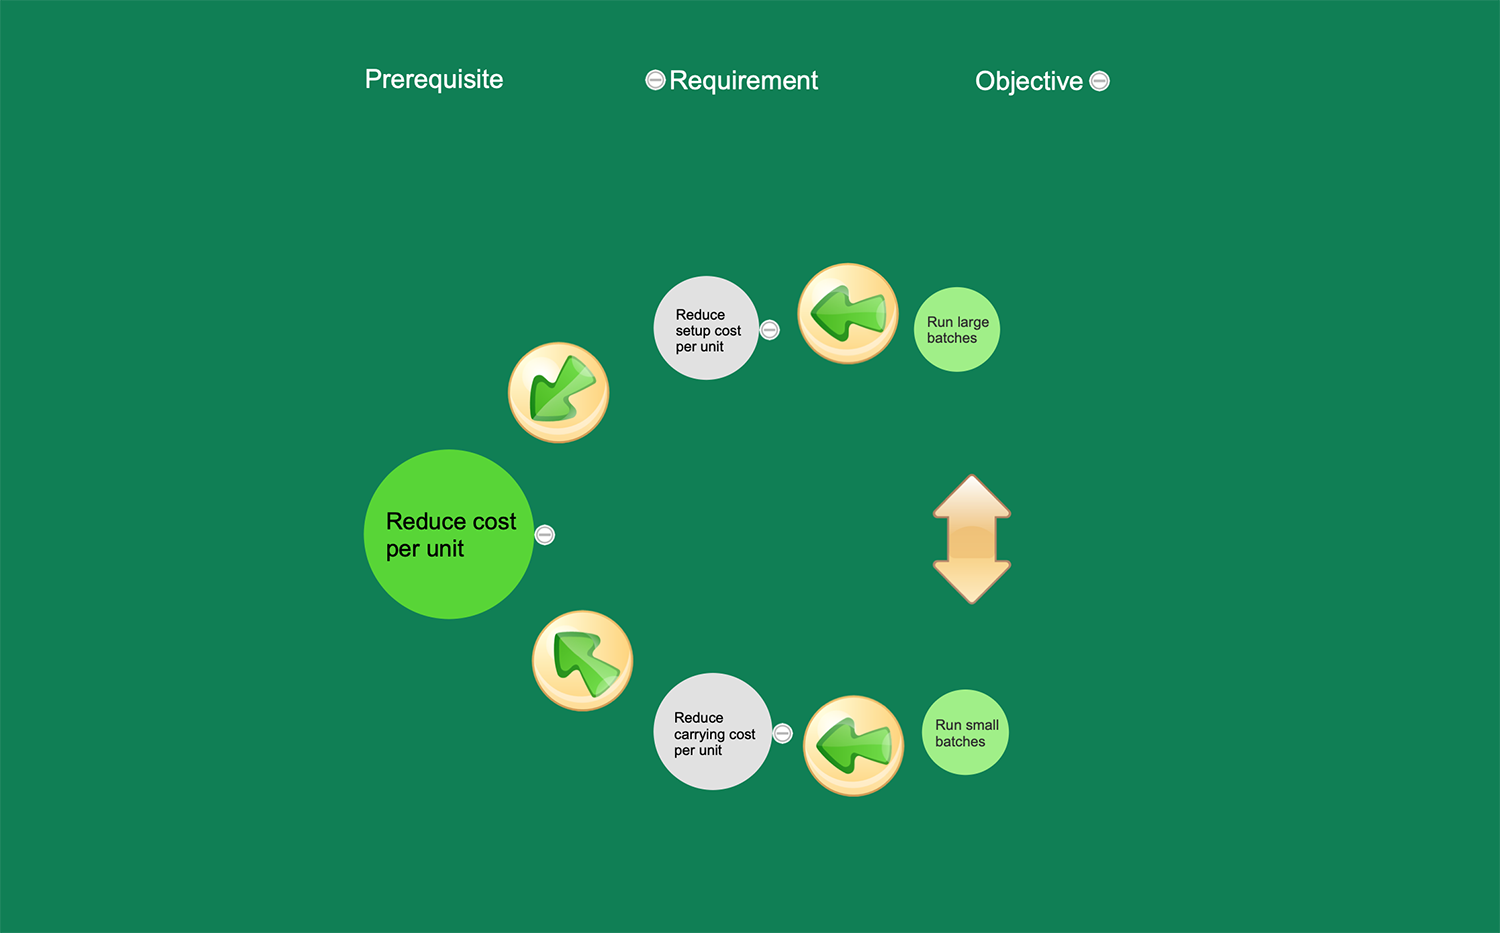
Example 4: Evaporating Cloud
This Mind Map demonstrates the evaporating cloud example or conflict resolution diagram according to the reducing cost. It is a common structure of the Evaporating Cloud (EC), which is one of six Thinking Processes in the Theory of Constraints. The Evaporating Cloud represents a logical diagram depicting a problem that has no evident acceptable solution. It is effective when used for solving conflict, dilemma or trade-off situations. The Evaporating Cloud supposes the examining of assumptions behind the logic and diagramming logic behind the conflict. The five nodes of the diagram are laid in a form of evaporating cloud as it is represented on this map. They depict two opposing wants composing a conflict, two needs that require to be satisfied, and a common goal that both these needs try to perform. The arrows you see on the map are the rationale or causal assumptions linking the nodes, they can be interpreted as “because”, “so that”, or “in order to”.
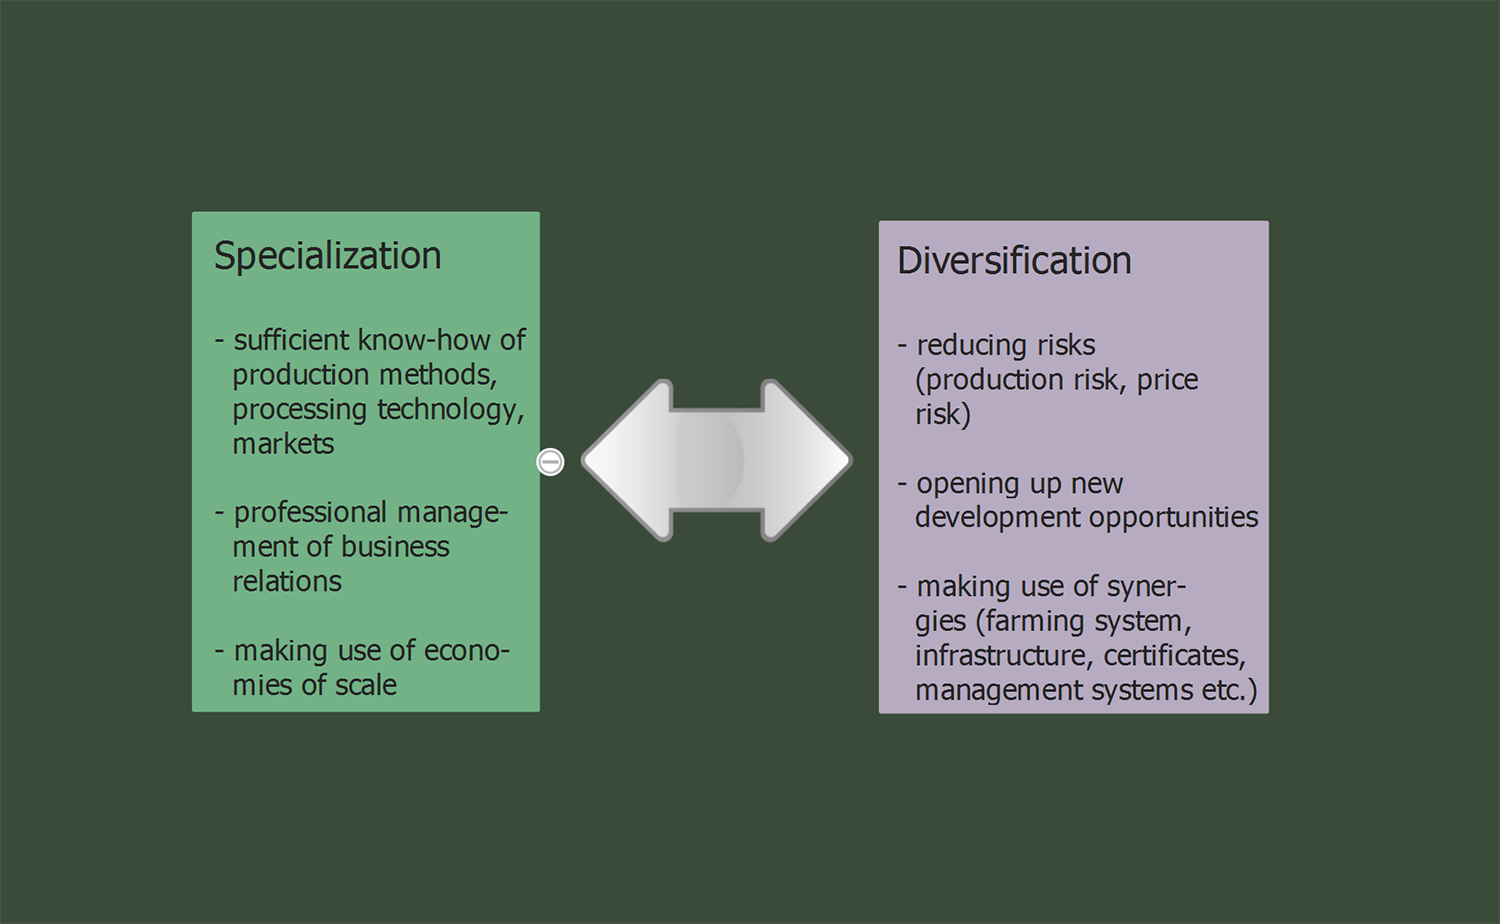
Example 5: Specialization vs Diversification
This Mind Map sample represents the specialization options vs diversification ones between which the organic businesses make their choice. The specialization, possession of specific knowledge in a certain field are obligatory for becoming really successful in this field. It is needed to be the expert, to know specific production and processing technologies, methods, and market requirements to develop a high-quality product. That is why most enterprises are the single-purpose and focused on a small number of products or a single product. The specialization lets professional managing the business relations and using the economies of scale. In its turn, the diversification assists in reducing production risks, enhancing food security, improving rotation in the farming system, opening new development opportunities, distributing costs, reducing the vulnerability of enterprises to the market fluctuations, responding flexibly to the changes in a business environment, making use of synergies. All these pros and cons are accurately depicted in this sample.
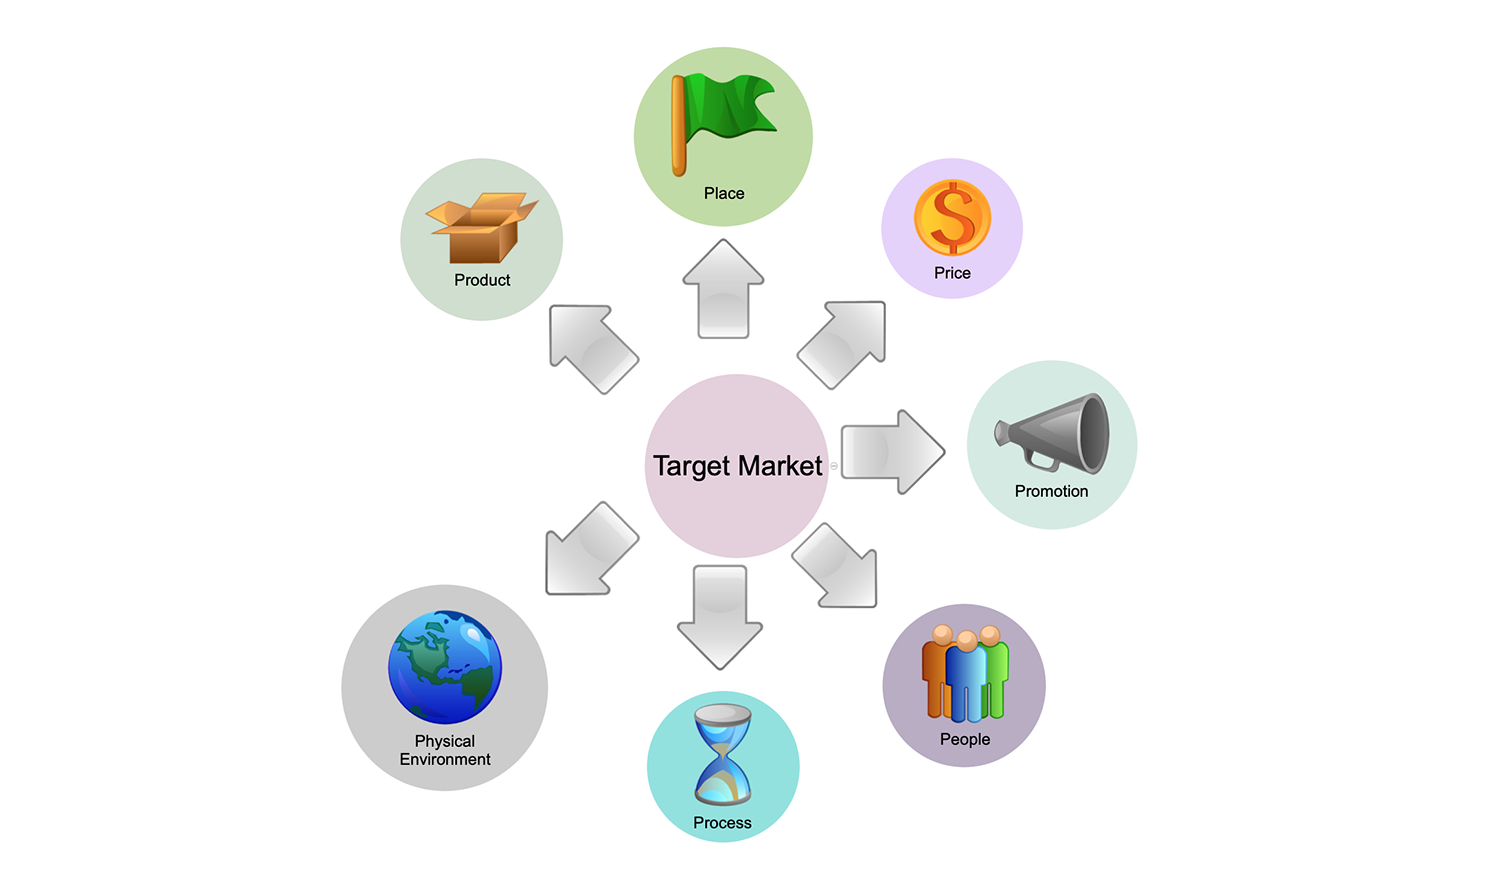
Example 6: Target Market
This Mind Map illustrates the target market and 7P principle that includes product, place, price, promotion, people, process, physical environment. Each of these components can bring a competitive advantage for the company, but only in a complex they become an ideal tool, one of the most effective marketing tools. 7P is effective in the sale of services and helps to gain a leading position at the market. Typically, each business and marketing strategy and program is based on the deep learning and analysis of the target market. At this, the development of the marketing program and effective positioning strategy requires an obligatory understanding of the target market, the motivations of consumers to purchase a specific product or brand. The Mind Map is made in the form of a circle-spoke diagram and depicts the marketing basis, relationships, and also interactions between the main components of the marketing strategy and the target market.
Inside
What I Need to Get Started
Both ConceptDraw DIAGRAM diagramming and drawing software and the Presentation Clipart solution can help creating the illustrations you need. The Presentation Clipart solution can be found in the Illustration area of ConceptDraw STORE application that can be downloaded from this site. Make sure that both ConceptDraw DIAGRAM and ConceptDraw STORE applications are installed on your computer before you get started.
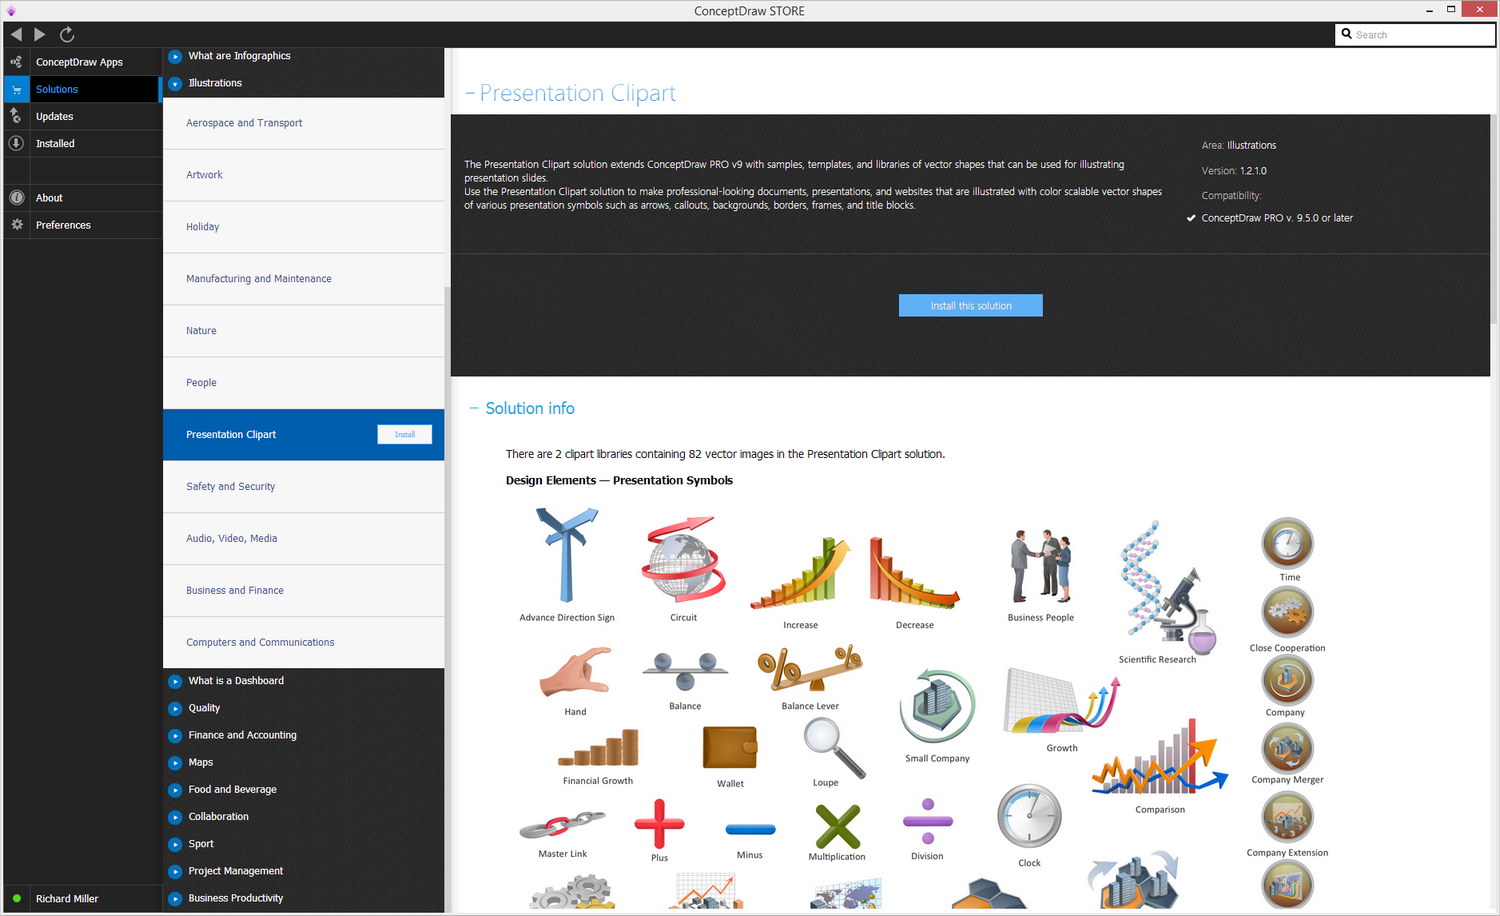
How to install
After ConceptDraw STORE and ConceptDraw DIAGRAM are downloaded and installed, you can install the Presentation Clipart solution from the ConceptDraw STORE.
Start Using
To make sure that you are doing it all right, use the pre-designed symbols from the stencil libraries from the solution to make your drawings look smart and professional. Also, the pre-made examples from this solution can be used as drafts so your own drawings can be based on them. Using the samples, you can always change their structures, colors and data.
