- Electric and Telecom Plans Free
- Fire and Emergency Plans Free
- Floor Plans Free
- Plant Layout Plans Free
- School and Training Plans Free
- Seating Plans Free
- Security and Access Plans Free
- Site Plans Free
- Sport Field Plans Free
- Business Process Diagrams Free
- Business Process Mapping Free
- Classic Business Process Modeling Free
- Cross-Functional Flowcharts Free
- Event-driven Process Chain Diagrams Free
- IDEF Business Process Diagrams Free
- Logistics Flow Charts Free
- Workflow Diagrams Free
- ConceptDraw Dashboard for Facebook Free
- Mind Map Exchange Free
- MindTweet Free
- Note Exchange Free
- Project Exchange Free
- Social Media Response Free
- Active Directory Diagrams Free
- AWS Architecture Diagrams Free
- Azure Architecture Free
- Cisco Network Diagrams Free
- Cisco Networking Free
- Cloud Computing Diagrams Free
- Computer Network Diagrams Free
- Google Cloud Platform Free
- Interactive Voice Response Diagrams Free
- Network Layout Floor Plans Free
- Network Security Diagrams Free
- Rack Diagrams Free
- Telecommunication Network Diagrams Free
- Vehicular Networking Free
- Wireless Networks Free
- Comparison Dashboard Free
- Composition Dashboard Free
- Correlation Dashboard Free
- Frequency Distribution Dashboard Free
- Meter Dashboard Free
- Spatial Dashboard Free
- Status Dashboard Free
- Time Series Dashboard Free
- Basic Circle-Spoke Diagrams Free
- Basic Circular Arrows Diagrams Free
- Basic Venn Diagrams Free
- Block Diagrams Free
- Concept Maps Free
- Family Tree Free
- Flowcharts Free
- Basic Area Charts Free
- Basic Bar Graphs Free
- Basic Divided Bar Diagrams Free
- Basic Histograms Free
- Basic Line Graphs Free
- Basic Picture Graphs Free
- Basic Pie Charts Free
- Basic Scatter Diagrams Free
- Aerospace and Transport Free
- Artwork Free
- Audio, Video, Media Free
- Business and Finance Free
- Computers and Communications Free
- Holiday Free
- Manufacturing and Maintenance Free
- Nature Free
- People Free
- Presentation Clipart Free
- Safety and Security Free
- Analog Electronics Free
- Audio and Video Connectors Free
- Basic Circuit Diagrams Free
- Chemical and Process Engineering Free
- Digital Electronics Free
- Electrical Engineering Free
- Electron Tube Circuits Free
- Electronic Block Diagrams Free
- Fault Tree Analysis Diagrams Free
- GHS Hazard Pictograms Free
- Home Automation and Wiring Free
- Mechanical Engineering Free
- One-line Diagrams Free
- Power Сircuits Free
- Specification and Description Language (SDL) Free
- Telecom and AV Circuits Free
- Transport Hazard Pictograms Free
- Data-driven Infographics Free
- Pictorial Infographics Free
- Spatial Infographics Free
- Typography Infographics Free
- Calendars Free
- Decision Making Free
- Enterprise Architecture Diagrams Free
- Fishbone Diagrams Free
- Organizational Charts Free
- Plan-Do-Check-Act (PDCA) Free
- Seven Management and Planning Tools Free
- SWOT and TOWS Matrix Diagrams Free
- Timeline Diagrams Free
- Australia Map Free
- Continent Maps Free
- Directional Maps Free
- Germany Map Free
- Metro Map Free
- UK Map Free
- USA Maps Free
- Customer Journey Mapping Free
- Marketing Diagrams Free
- Matrices Free
- Pyramid Diagrams Free
- Sales Dashboard Free
- Sales Flowcharts Free
- Target and Circular Diagrams Free
- Cash Flow Reports Free
- Current Activities Reports Free
- Custom Excel Report Free
- Knowledge Reports Free
- MINDMAP Reports Free
- Overview Reports Free
- PM Agile Free
- PM Dashboards Free
- PM Docs Free
- PM Easy Free
- PM Meetings Free
- PM Personal Time Management Free
- PM Planning Free
- PM Presentations Free
- PM Response Free
- Resource Usage Reports Free
- Visual Reports Free
- House of Quality Free
- Quality Mind Map Free
- Total Quality Management TQM Diagrams Free
- Value Stream Mapping Free
- Astronomy Free
- Biology Free
- Chemistry Free
- Language Learning Free
- Mathematics Free
- Physics Free
- Piano Sheet Music Free
- Android User Interface Free
- Class Hierarchy Tree Free
- Data Flow Diagrams (DFD) Free
- DOM Tree Free
- Entity-Relationship Diagram (ERD) Free
- EXPRESS-G data Modeling Diagram Free
- IDEF0 Diagrams Free
- iPhone User Interface Free
- Jackson Structured Programming (JSP) Diagrams Free
- macOS User Interface Free
- Object-Role Modeling (ORM) Diagrams Free
- Rapid UML Free
- SYSML Free
- Website Wireframe Free
- Windows 10 User Interface Free
Australia Map
Australia is known to be officially named as the Commonwealth of Australia. Being a sovereign country that is comprising the mainland of the Australian continent, as well as the island of Tasmania and many other different small islands, it is known to be the largest country in Oceania.
Australia is the world's sixth-largest country taking into consideration its total area. Australia’s neighbouring countries are Papua New Guinea, East Timor, Indonesia, Vanuatu and the Solomon Islands, as well as New Zealand. Australia's capital is Canberra while its largest city is Sydney.
Having the world's 13th-largest economy as well as the tenth-highest per capita income, Australia is ranked highly in quality of life, health, economic freedom, civil liberties, political rights and education. Enabling anyone to create a map of Australia, the ConceptDraw DIAGRAM diagramming and drawing software was developed.
To simplify the work of drawing the maps of Australia in the ConceptDraw DIAGRAM application, the Australia Map solution can be used, including its collection of scalable graphics that is known to be representing the political geography of Australia, splitting into distinct state maps.
Each of the available maps offers many details that can be added to the maps so it becomes possible to show this country’s sub-divisions as well as its local government areas. Being focused on the main cities and the capital, the maps of Australia can be created by edited the pre-made templates.
In order to develop their international business any ConceptDraw DIAGRAM user might find the Australia Map solution useful in terms of saving time on creating the maps from a scratch using the already previously made examples instead.
-
Install this solution Free -
What I need to get started -
Solution Requirements - This solution requires the following products to be installed:
ConceptDraw DIAGRAM v17 - This solution requires the following products to be installed:
-
Compatibility - Monterey (12), Ventura (13), Sonoma (14)
MS Windows 8.1, 10 - Monterey (12), Ventura (13), Sonoma (14)
-
Support for this Solution -
Helpdesk
There is 1 library containing 8 objects in the Australia Map solution.
Design Elements — Australia Map

Design Elements — New South Wales

Design Elements — Northern Territory

Design Elements — Western Australia

Design Elements — Queensland

Design Elements — South Australia

Design Elements — Tasmania

Design Elements — Victoria

Related News:
Examples
There are a few samples that you see on this page which were created in the ConceptDraw DIAGRAM application by using the Australia Map solution. Some of the solution's capabilities as well as the professional results which you can achieve are all demonstrated here on this page.
All source documents are vector graphic documents which are always available for modifying, reviewing and/or converting to many different formats, such as MS PowerPoint, PDF file, MS Visio, and many other graphic ones from the ConceptDraw Solution Park or ConceptDraw STORE. The Australia Map solution is available to all ConceptDraw DIAGRAM users to get installed and used while working in the ConceptDraw DIAGRAM diagramming and drawing software.
Example 1: Australia Map
This diagram was created in ConceptDraw DIAGRAM using the Australia Map library from the Australia Map solution. An experienced user spent 15 minutes creating this sample.
When combined together, the elements from the Australia Map solution create a complete map of Australia and nearby islands. This map distinguishes state by color, and leaves out further levels of detail.

Example 2: Australia New South Wales with LGA Names
This diagram was created in ConceptDraw DIAGRAM using the Australia Map library from the Australia Map solution. An experienced user spent 10 minutes creating this sample.
This individual state map is split into named local governments areas, part of larger territories. Regions and towns are named, with the largest and most important cities marked in red.

Example 3: Australia Northern Territory with LGA Names
This diagram was created in ConceptDraw DIAGRAM using the Australia Map library from the Australia Map solution. An experienced user spent 10 minutes creating this sample.
The Northern Territory is one of the more sparsely populated in Australia, but features one of its more famed cities - Darwin. Also included on the map are the island chains found off the North coast.

Example 4: Australia Victoria with LGA Names
This diagram was created in ConceptDraw DIAGRAM using the Australia Map library from the Australia Map solution. An experienced user spent 10 minutes creating this sample.
One of the smallest, but most populous of states, Victoria contains the city of Melbourne, and some of the most famous beaches found in Australia.

Example 5: NSW in Australia Map
This diagram was created in ConceptDraw DIAGRAM using the Australia Map library from the Australia Map solution. An experienced user spent 10 minutes creating this sample.
Using all the state map graphics in combination, a color scale can be used to focus on one particular area. Choose how much detail your map shows, and which features you want named and highlighted.


Inside


What I Need to Get Started
Both ConceptDraw DIAGRAM diagramming and drawing software and the Australia Map solution can help creating the illustrations you need. The Australia Map solution can be found in the Maps area of ConceptDraw STORE application that can be downloaded from this site. Make sure that both ConceptDraw DIAGRAM and ConceptDraw STORE applications are installed on your computer before you get started.
How to install
After ConceptDraw STORE and ConceptDraw DIAGRAM are downloaded and installed, you can install the Australia Map solution from the ConceptDraw STORE.

Start Using
To make sure that you are doing it all right, use the pre-designed symbols from the stencil libraries from the solution to make your drawings look smart and professional. Also, the pre-made examples from this solution can be used as drafts so your own drawings can be based on them. Using the samples, you can always change their structures, colors and data.

States and territories maps of Australia
When European explorers and settlers reached Australia's shores, they brought with them the style of social structure, politics and governance from their homelands. Early settlements became colonies, some of which would form the foundations of modern day Australian cities such as Sydney and Melbourne. These colonies began to divide the mainland (and certain surrounding islands) into distinct territories — initially their boundaries were ever-changing, but by the end of the 1800s they eventually settled with the formation of six states that have remained largely unchanged to this day.
With Australia no longer serving solely as a penal colony for British convicts, and more and more migrants reaching the country, population and infrastructure expanded rapidly, leading to a call to unify the individual territories under one flag. After some negotiations, the six member states were ratified under the Commonwealth of Australia, that although still holding strong ties with the United Kingdom, would be largely self governing. In the 120 years since this unification, the political map of Australia has been consistent; the following is a list of the six states that comprised the nation then and now:
- South Australia
- New South Wales
- Queensland
- Victoria
- Western Australia
- Tasmania
There are also 3 self governing territories — Northern Territory, Jervis Bay Territory, and the Australian Capital Territory, which is something like the USA's Washington DC. Over the years, Australia has also grouped several island chains under the Commonwealth, resulting in seven extra external territories.
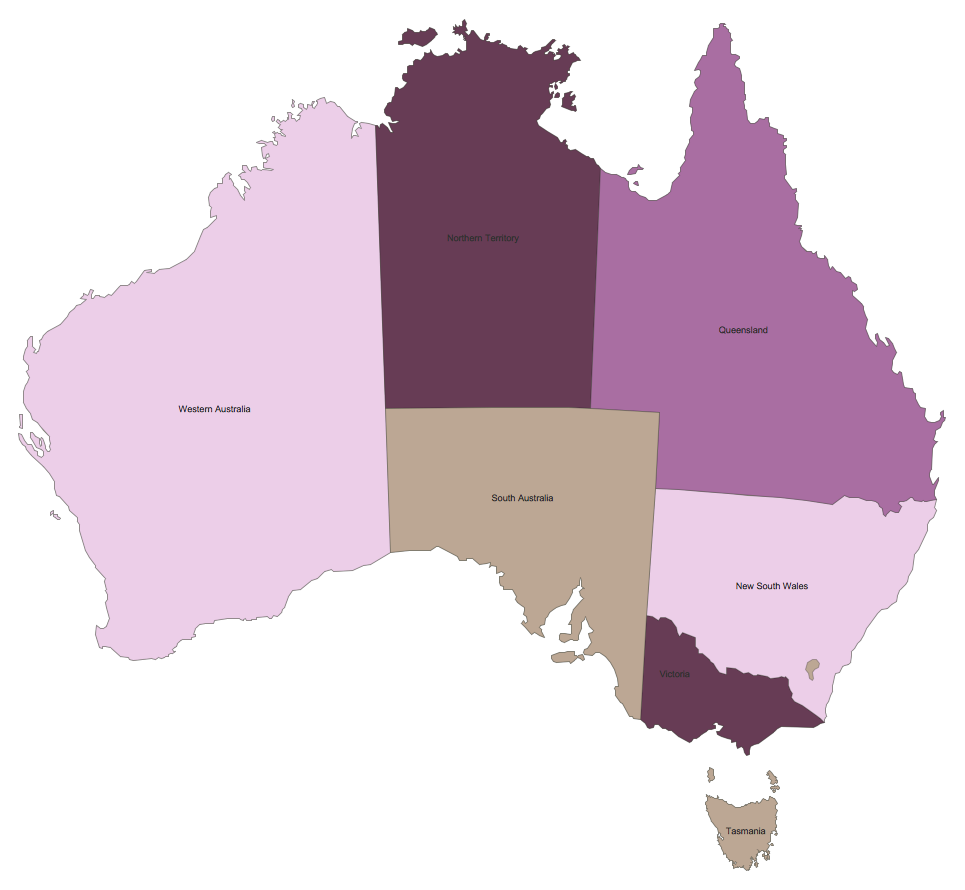
Australian map was created with ConceptDraw DIAGRAM, it shows states and territories of Australia
The distinct and long standing territories, aligned with interesting geological features across a wide expanse, make thematic maps an ideal way of presenting geological, geographical or political information relating to Australia. A thematic map studies a particular theme or subject area in relation to a particular location — often the focus is on the distribution and spatial variation of whatever data is being analysed.
Thematic maps lack a certain level of detail — they often do not show features such as road networks or contours, but instead tend to use a basic political map as the foundation, with an added layer of data to give context. A common example is a map of population density. Using Australia in this instance, the map would consist of a basic outline with state borders, and some form of dot distribution to indicate population. The more dots condensed in one area, the more populous it is — looking at Australia we would see a large collection of dots spread along the (particularly South) coast, while the center of the map (the Australian Outback) would be relatively clear.
A geospatial infographic goes one step further than a thematic map, in that it can tackle a broader range of subjects and use a more dynamic visual style to get its message across. The idea behind an infographic is to tell the viewer a story about that subject, perhaps answering a posed question or using statistics to back up a more general statement. Rather than just focussing on one set of data, such as Australia's population density as used in the last example, an infographic can expand on linked causes and effects — health issues, pay disparities or political leanings for example.
There are few limits on how this information is presented, only that visual techniques are used to present the data in a way that is easily identifiable and understandable, and that a coherent argument is made.
The way geospatial and social data is collected now results in reams of data that is impenetrable to a casual viewer. Thematic maps and infographics have risen to prominence as effective ways of collating this data, and breaking it down into manageable pieces that are conducive to sharing through social media streams. At CS Odessa, we recognize the fact that working with complicated data while trying to express this creatively through original diagrams represents a challenge, particularly with the fast moving trends and deadlines that many are bound to. We constantly endeavour to provide the solutions to these problems.
The Australia Map solution for ConceptDraw DIAGRAM is our latest solution for knowledge workers and business people. We try and make every step of the creative process as simple and intuitive as possible. Inside the Australia Map solution you will find templates and samples to get you started, a library containing vector graphics representing each Australian state, and if you're still struggling for inspiration then there is our comprehensive help and video tutorial section to explain some tips and tricks. Used in conjunction with other ConceptDraw DIAGRAM solutions libraries, our vector graphics allow you to create rich and varied infographics along any theme. For a more concentrated map, these images allow extra levels of detail — you can choose to display your map with county borders, named geographical regions, and major towns and cities.
Once you've finished you design, we offer a full range of import and export capabilities, including exporting to different file formats, or sharing your creativity through presentations.
The Australia Map solution for ConceptDraw DIAGRAM is part of an ever-growing collection of visual solutions from CS Odessa — aiming to provide inspiration and productivity at every stage of the design process.