- Electric and Telecom Plans Free
- Fire and Emergency Plans Free
- Floor Plans Free
- Plant Layout Plans Free
- School and Training Plans Free
- Seating Plans Free
- Security and Access Plans Free
- Site Plans Free
- Sport Field Plans Free
- Business Process Diagrams Free
- Business Process Mapping Free
- Classic Business Process Modeling Free
- Cross-Functional Flowcharts Free
- Event-driven Process Chain Diagrams Free
- IDEF Business Process Diagrams Free
- Logistics Flow Charts Free
- Workflow Diagrams Free
- ConceptDraw Dashboard for Facebook Free
- Mind Map Exchange Free
- MindTweet Free
- Note Exchange Free
- Project Exchange Free
- Social Media Response Free
- Active Directory Diagrams Free
- AWS Architecture Diagrams Free
- Azure Architecture Free
- Cisco Network Diagrams Free
- Cisco Networking Free
- Cloud Computing Diagrams Free
- Computer Network Diagrams Free
- Google Cloud Platform Free
- Interactive Voice Response Diagrams Free
- Network Layout Floor Plans Free
- Network Security Diagrams Free
- Rack Diagrams Free
- Telecommunication Network Diagrams Free
- Vehicular Networking Free
- Wireless Networks Free
- Comparison Dashboard Free
- Composition Dashboard Free
- Correlation Dashboard Free
- Frequency Distribution Dashboard Free
- Meter Dashboard Free
- Spatial Dashboard Free
- Status Dashboard Free
- Time Series Dashboard Free
- Basic Circle-Spoke Diagrams Free
- Basic Circular Arrows Diagrams Free
- Basic Venn Diagrams Free
- Block Diagrams Free
- Concept Maps Free
- Family Tree Free
- Flowcharts Free
- Basic Area Charts Free
- Basic Bar Graphs Free
- Basic Divided Bar Diagrams Free
- Basic Histograms Free
- Basic Line Graphs Free
- Basic Picture Graphs Free
- Basic Pie Charts Free
- Basic Scatter Diagrams Free
- Aerospace and Transport Free
- Artwork Free
- Audio, Video, Media Free
- Business and Finance Free
- Computers and Communications Free
- Holiday Free
- Manufacturing and Maintenance Free
- Nature Free
- People Free
- Presentation Clipart Free
- Safety and Security Free
- Analog Electronics Free
- Audio and Video Connectors Free
- Basic Circuit Diagrams Free
- Chemical and Process Engineering Free
- Digital Electronics Free
- Electrical Engineering Free
- Electron Tube Circuits Free
- Electronic Block Diagrams Free
- Fault Tree Analysis Diagrams Free
- GHS Hazard Pictograms Free
- Home Automation and Wiring Free
- Mechanical Engineering Free
- One-line Diagrams Free
- Power Сircuits Free
- Specification and Description Language (SDL) Free
- Telecom and AV Circuits Free
- Transport Hazard Pictograms Free
- Data-driven Infographics Free
- Pictorial Infographics Free
- Spatial Infographics Free
- Typography Infographics Free
- Calendars Free
- Decision Making Free
- Enterprise Architecture Diagrams Free
- Fishbone Diagrams Free
- Organizational Charts Free
- Plan-Do-Check-Act (PDCA) Free
- Seven Management and Planning Tools Free
- SWOT and TOWS Matrix Diagrams Free
- Timeline Diagrams Free
- Australia Map Free
- Continent Maps Free
- Directional Maps Free
- Germany Map Free
- Metro Map Free
- UK Map Free
- USA Maps Free
- Customer Journey Mapping Free
- Marketing Diagrams Free
- Matrices Free
- Pyramid Diagrams Free
- Sales Dashboard Free
- Sales Flowcharts Free
- Target and Circular Diagrams Free
- Cash Flow Reports Free
- Current Activities Reports Free
- Custom Excel Report Free
- Knowledge Reports Free
- MINDMAP Reports Free
- Overview Reports Free
- PM Agile Free
- PM Dashboards Free
- PM Docs Free
- PM Easy Free
- PM Meetings Free
- PM Planning Free
- PM Presentations Free
- PM Response Free
- Resource Usage Reports Free
- Visual Reports Free
- House of Quality Free
- Quality Mind Map Free
- Total Quality Management TQM Diagrams Free
- Value Stream Mapping Free
- Astronomy Free
- Biology Free
- Chemistry Free
- Language Learning Free
- Mathematics Free
- Physics Free
- Piano Sheet Music Free
- Android User Interface Free
- Class Hierarchy Tree Free
- Data Flow Diagrams (DFD) Free
- DOM Tree Free
- Entity-Relationship Diagram (ERD) Free
- EXPRESS-G data Modeling Diagram Free
- IDEF0 Diagrams Free
- iPhone User Interface Free
- Jackson Structured Programming (JSP) Diagrams Free
- macOS User Interface Free
- Object-Role Modeling (ORM) Diagrams Free
- Rapid UML Free
- SYSML Free
- Website Wireframe Free
- Windows 10 User Interface Free
Basic Pie Charts
This solution extends the capabilities of ConceptDraw DIAGRAM with templates, samples, and a library of vector stencils for drawing pie and donut charts.
A Pie Chart is a disk divided into sectors. The sector angle is proportional to the represented quantity. Pie charts effectively display proportions. In particular, if the intent is to compare the size of a slice with a whole pie, rather than comparing slices among them, pie charts are very illustrative. Pie Charts are used in statistics, business, and mass media for composition comparison (i.e. to visualize the percentage for the parts of one total).
-
Install this solution Free -
What I need to get started -
Solution Requirements - This solution requires the following products to be installed:
ConceptDraw DIAGRAM v18 - This solution requires the following products to be installed:
-
Compatibility - Sonoma (14), Sonoma (15)
MS Windows 10, 11 - Sonoma (14), Sonoma (15)
-
Support for this Solution -
Helpdesk
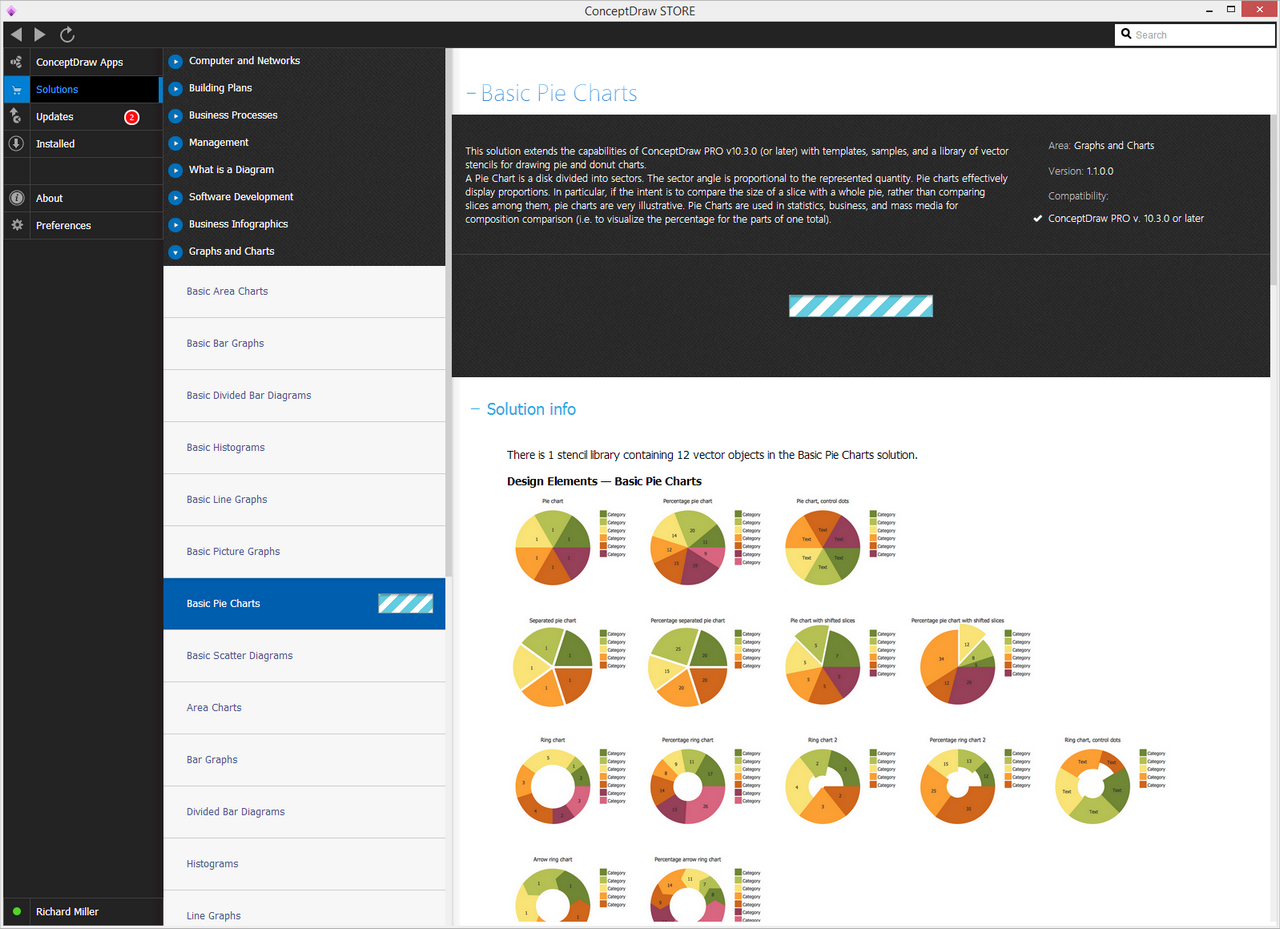
There is 1 stencil library containing 12 vector objects in the Basic Pie Charts solution.
Design Elements — Basic Pie Charts

Related News:
Examples
There are a few samples that you see on this page which were created in the ConceptDraw DIAGRAM application by using the Basic Pie Charts solution. Some of the solution's capabilities as well as the professional results which you can achieve are all demonstrated here on this page.
All source documents are vector graphic documents which are always available for modifying, reviewing and/or converting to many different formats, such as MS PowerPoint, PDF file, MS Visio, and many other graphic ones from the ConceptDraw Solution Park or ConceptDraw STORE. The Basic Pie Charts solution is available to all ConceptDraw DIAGRAM users to get installed and used while working in the ConceptDraw DIAGRAM diagramming and drawing software.
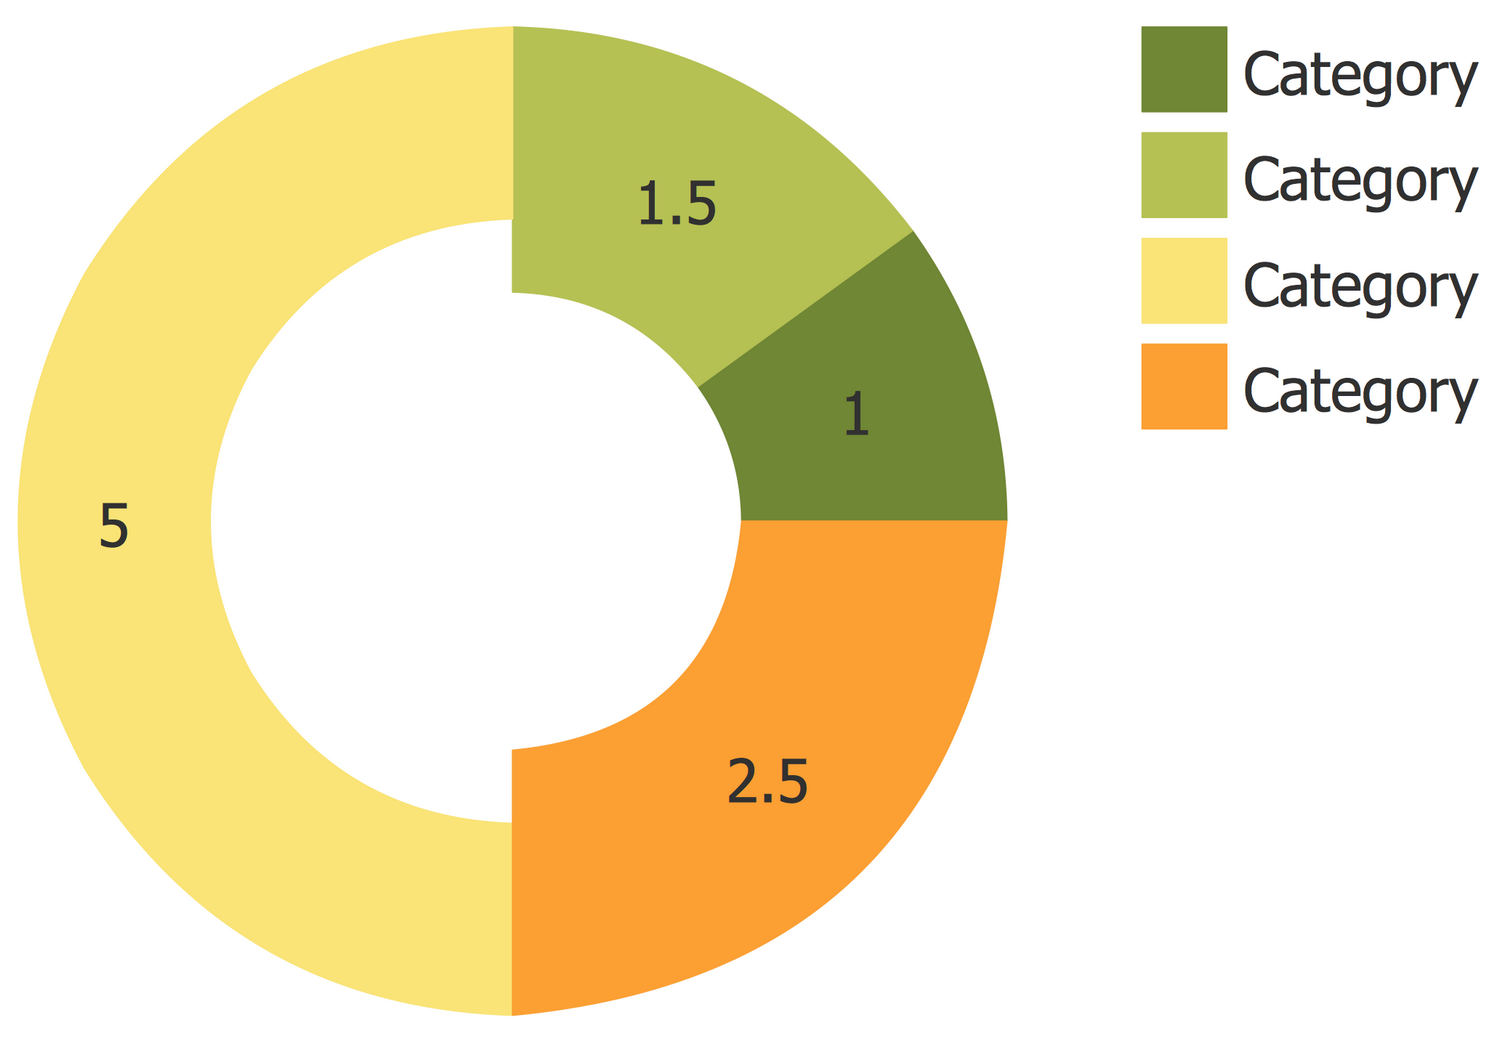
Example 1: Basic Donut Chart — Budgeted Appropriations
This example was created in ConceptDraw DIAGRAM using the Basic Pie Charts Library from the Pie Charts Solution. An experienced user spent 5 minutes creating this sample.
A donut (doughnut) chart is similar to a pie chart, but it gives the ability to support multiple statistics at once. In this simple case, the choice of donut chart vs pie chart was based on visual criteria only - leaving the center blank makes this chart lightweight.

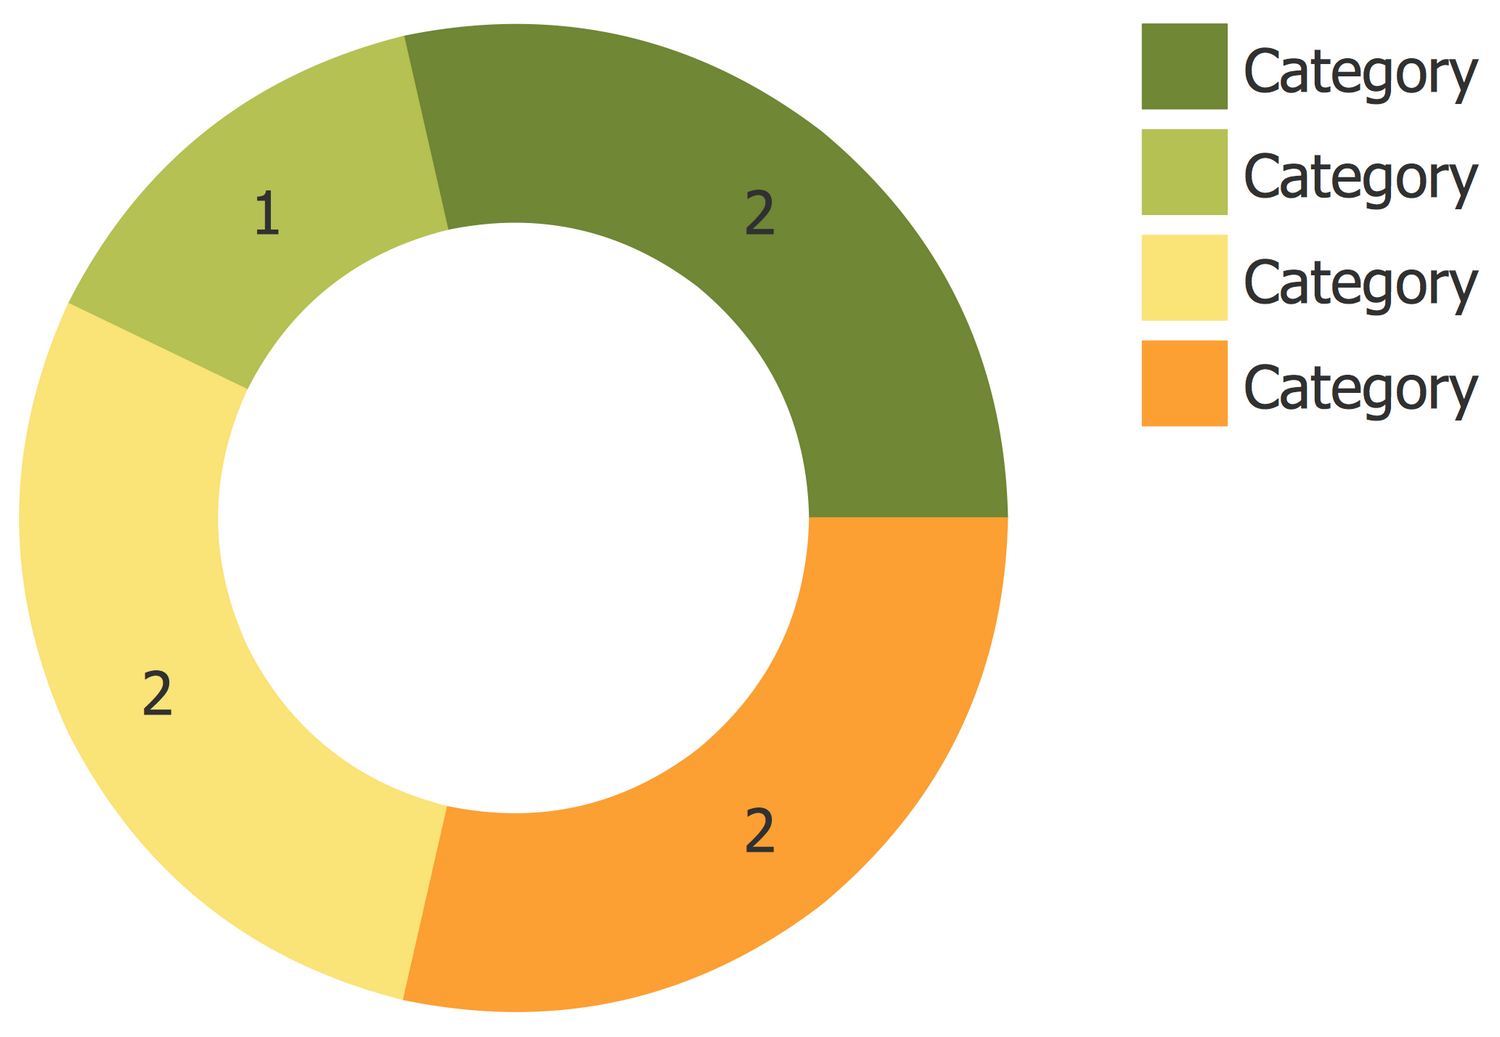
Example 2: Basic Pie Chart — Sector Weightings
This example was created in ConceptDraw DIAGRAM using the Basic Pie Charts Library from the Basic Pie Charts Solution. An experienced user spent 15 minutes creating this sample.
This is a typical example of pie chart. It captures attention using a rich color palette. When using this approach, be aware of using too many categories. This can make your pie chart impossible to understand.

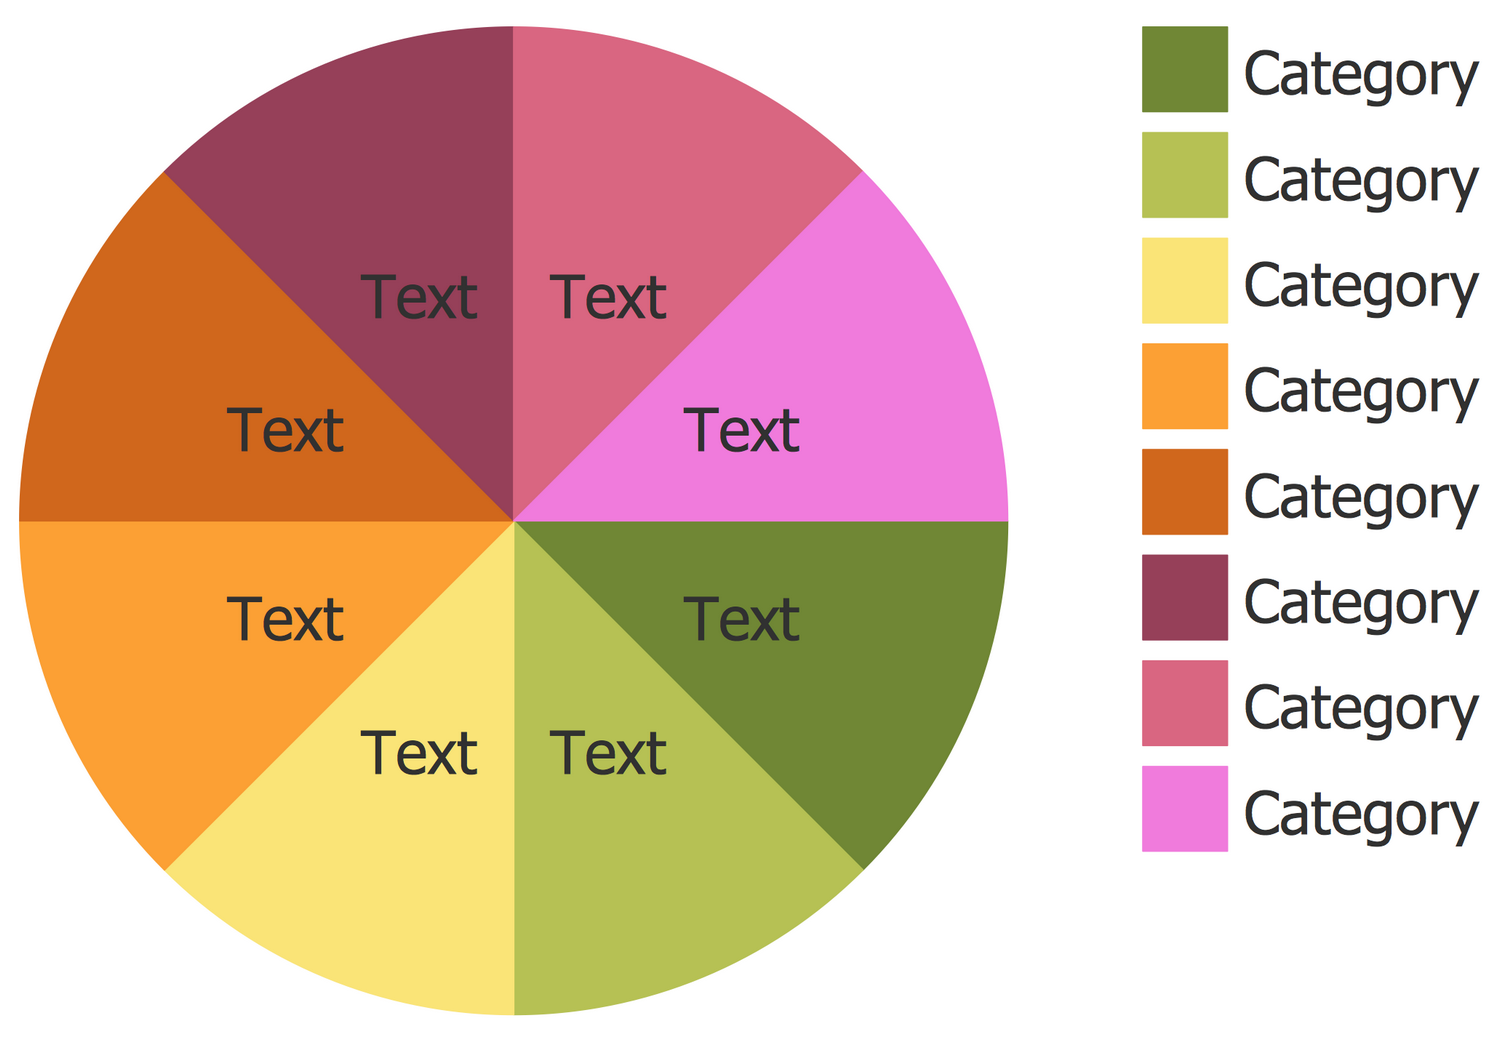
Example 3: Basic Pie Chart — Approximate Composition of the Air
This example was created in ConceptDraw DIAGRAM using the Basic Pie Charts Library from the Basic Pie Charts Solution. An experienced user spent 5 minutes creating this sample.
Using pie charts always leaves a free space on your page or slide. You can use this space to add illustrations or text labels provide your audience with additional information which may help your audience understand the subject.

Template 1: Basic Pie Chart
This example was created in ConceptDraw DIAGRAM using the Basic Pie Charts Library from the Basic Pie Charts Solution. An experienced user spent 2 minutes creating this template.
The Basic Pie Charts Solution contains ready-to-use templates with pie charts. You can input your data to an existing template and then redesign it according to your taste.


Inside


What I Need to Get Started
Both ConceptDraw DIAGRAM diagramming and drawing software and the Basic Pie Charts solution can help creating the numerical data you need. The Basic Pie Charts solution can be found in the Graphs and Charts area of ConceptDraw STORE application that can be downloaded from this site. Make sure that both ConceptDraw DIAGRAM and ConceptDraw STORE applications are installed on your computer before you get started.
How to install
After ConceptDraw STORE and ConceptDraw DIAGRAM are downloaded and installed, you can install the Basic Pie Charts solution from the ConceptDraw STORE.
Start Using
To make sure that you are doing it all right, use the pre-designed symbols from the stencil libraries from the solution to make your drawings look smart and professional. Also, the pre-made examples from this solution can be used as drafts so your own drawings can be based on them. Using the samples, you can always change their structures, colors and data.

To install this solution follow steps:
- Run ConceptDraw STORE app
- Open Solutions tab to display all the solutions
- Free solutions are indicated with Install button
- Select solution and Click Install