- Electric and Telecom Plans Free
- Fire and Emergency Plans Free
- Floor Plans Free
- Plant Layout Plans Free
- School and Training Plans Free
- Seating Plans Free
- Security and Access Plans Free
- Site Plans Free
- Sport Field Plans Free
- Business Process Diagrams Free
- Business Process Mapping Free
- Classic Business Process Modeling Free
- Cross-Functional Flowcharts Free
- Event-driven Process Chain Diagrams Free
- IDEF Business Process Diagrams Free
- Logistics Flow Charts Free
- Workflow Diagrams Free
- ConceptDraw Dashboard for Facebook Free
- Mind Map Exchange Free
- MindTweet Free
- Note Exchange Free
- Project Exchange Free
- Social Media Response Free
- Active Directory Diagrams Free
- AWS Architecture Diagrams Free
- Azure Architecture Free
- Cisco Network Diagrams Free
- Cisco Networking Free
- Cloud Computing Diagrams Free
- Computer Network Diagrams Free
- Google Cloud Platform Free
- Interactive Voice Response Diagrams Free
- Network Layout Floor Plans Free
- Network Security Diagrams Free
- Rack Diagrams Free
- Telecommunication Network Diagrams Free
- Vehicular Networking Free
- Wireless Networks Free
- Comparison Dashboard Free
- Composition Dashboard Free
- Correlation Dashboard Free
- Frequency Distribution Dashboard Free
- Meter Dashboard Free
- Spatial Dashboard Free
- Status Dashboard Free
- Time Series Dashboard Free
- Basic Circle-Spoke Diagrams Free
- Basic Circular Arrows Diagrams Free
- Basic Venn Diagrams Free
- Block Diagrams Free
- Concept Maps Free
- Family Tree Free
- Flowcharts Free
- Basic Area Charts Free
- Basic Bar Graphs Free
- Basic Divided Bar Diagrams Free
- Basic Histograms Free
- Basic Line Graphs Free
- Basic Picture Graphs Free
- Basic Pie Charts Free
- Basic Scatter Diagrams Free
- Aerospace and Transport Free
- Artwork Free
- Audio, Video, Media Free
- Business and Finance Free
- Computers and Communications Free
- Holiday Free
- Manufacturing and Maintenance Free
- Nature Free
- People Free
- Presentation Clipart Free
- Safety and Security Free
- Analog Electronics Free
- Audio and Video Connectors Free
- Basic Circuit Diagrams Free
- Chemical and Process Engineering Free
- Digital Electronics Free
- Electrical Engineering Free
- Electron Tube Circuits Free
- Electronic Block Diagrams Free
- Fault Tree Analysis Diagrams Free
- GHS Hazard Pictograms Free
- Home Automation and Wiring Free
- Mechanical Engineering Free
- One-line Diagrams Free
- Power Сircuits Free
- Specification and Description Language (SDL) Free
- Telecom and AV Circuits Free
- Transport Hazard Pictograms Free
- Data-driven Infographics Free
- Pictorial Infographics Free
- Spatial Infographics Free
- Typography Infographics Free
- Calendars Free
- Decision Making Free
- Enterprise Architecture Diagrams Free
- Fishbone Diagrams Free
- Organizational Charts Free
- Plan-Do-Check-Act (PDCA) Free
- Seven Management and Planning Tools Free
- SWOT and TOWS Matrix Diagrams Free
- Timeline Diagrams Free
- Australia Map Free
- Continent Maps Free
- Directional Maps Free
- Germany Map Free
- Metro Map Free
- UK Map Free
- USA Maps Free
- Customer Journey Mapping Free
- Marketing Diagrams Free
- Matrices Free
- Pyramid Diagrams Free
- Sales Dashboard Free
- Sales Flowcharts Free
- Target and Circular Diagrams Free
- Cash Flow Reports Free
- Current Activities Reports Free
- Custom Excel Report Free
- Knowledge Reports Free
- MINDMAP Reports Free
- Overview Reports Free
- PM Agile Free
- PM Dashboards Free
- PM Docs Free
- PM Easy Free
- PM Meetings Free
- PM Personal Time Management Free
- PM Planning Free
- PM Presentations Free
- PM Response Free
- Resource Usage Reports Free
- Visual Reports Free
- House of Quality Free
- Quality Mind Map Free
- Total Quality Management TQM Diagrams Free
- Value Stream Mapping Free
- Astronomy Free
- Biology Free
- Chemistry Free
- Language Learning Free
- Mathematics Free
- Physics Free
- Piano Sheet Music Free
- Android User Interface Free
- Class Hierarchy Tree Free
- Data Flow Diagrams (DFD) Free
- DOM Tree Free
- Entity-Relationship Diagram (ERD) Free
- EXPRESS-G data Modeling Diagram Free
- IDEF0 Diagrams Free
- iPhone User Interface Free
- Jackson Structured Programming (JSP) Diagrams Free
- macOS User Interface Free
- Object-Role Modeling (ORM) Diagrams Free
- Rapid UML Free
- SYSML Free
- Website Wireframe Free
- Windows 10 User Interface Free
Basic Circular Arrows Diagrams
Circular Arrows Diagrams or Segmented Cycle Diagrams are diagramming tools used to depict processes, a series of events, stages of their execution, and interconnectedness. These diagrams are made in the form of a ring divided into parts with arrows indicating the direction of the flow of related events. The Circular Arrows Diagrams show the order in which a task or project is performed. They are cyclic, so one step or phase follows another, and this process is continuous and repeated, the last step is always associated with the first.
Circular Arrows Diagrams can be used for any sort of processes or events in business, economy, manufacturing, management, marketing, mass media, PR, sales, advertising, IT, or any other field. A business plan, life cycle of a product or idea, flow of events, money, resources, or critical steps can be depicted as a Circular Arrows Diagram. It is also necessary for planning and monitoring tasks within a complex project.
Basic Circular Arrows Diagrams solution extends ConceptDraw DIAGRAM with predesigned samples and a library of vector stencils allowing one to create the Circular Arrows diagrams for any purpose or need. You can start with one desired of ready-made vector stencils or samples using it as a circular flow diagram template and make your own Circular Arrow Diagram with the required quantity of sectors in a few minutes. Finally, you can customize it by making some stylish changes to distinguish one step from another, using contrasting colors to highlight the most important ones, color steps with the same characteristics in the same way, so designing the scheme best suits your taste.
-
Install this solution Free -
What I need to get started -
Solution Requirements - This solution requires the following products to be installed:
ConceptDraw DIAGRAM v17 - This solution requires the following products to be installed:
-
Compatibility - Monterey (12), Ventura (13), Sonoma (14)
MS Windows 8.1, 10 - Monterey (12), Ventura (13), Sonoma (14)
-
Support for this Solution -
Helpdesk
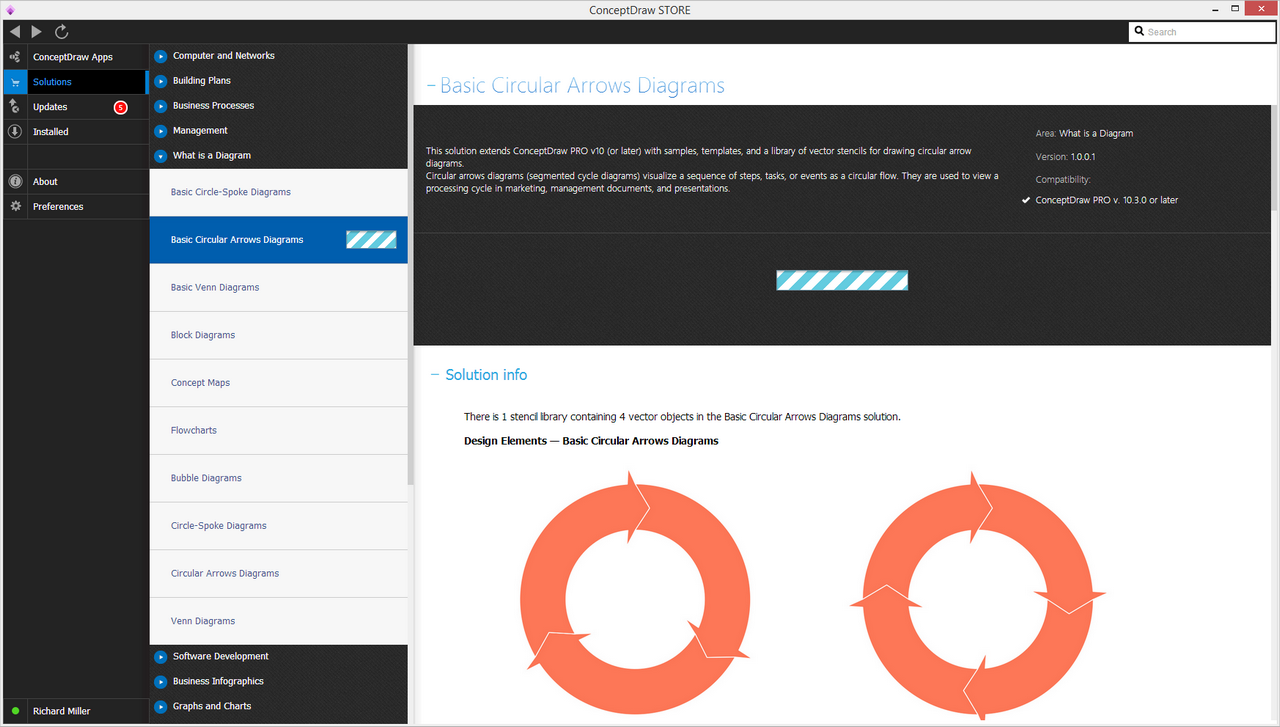
There is 1 stencil library containing 4 vector objects in the Basic Circular Arrows Diagrams solution.
Design Elements — Basic Circular Arrows Diagrams

Examples
There are a few samples that you see on this page which were created in the ConceptDraw DIAGRAM application by using the Basic Circular Arrows Diagrams solution. Some of the solution's capabilities as well as the professional results which you can achieve are all demonstrated here on this page.
All source documents are vector graphic documents which are always available for modifying, reviewing and/or converting to many different formats, such as MS PowerPoint, PDF file, MS Visio, and many other graphic files from the ConceptDraw Solution Park or ConceptDraw STORE. The Basic Circular Arrows Diagrams solution is available to all ConceptDraw DIAGRAM users for installing and use while working in the ConceptDraw DIAGRAM charting and drawing software.
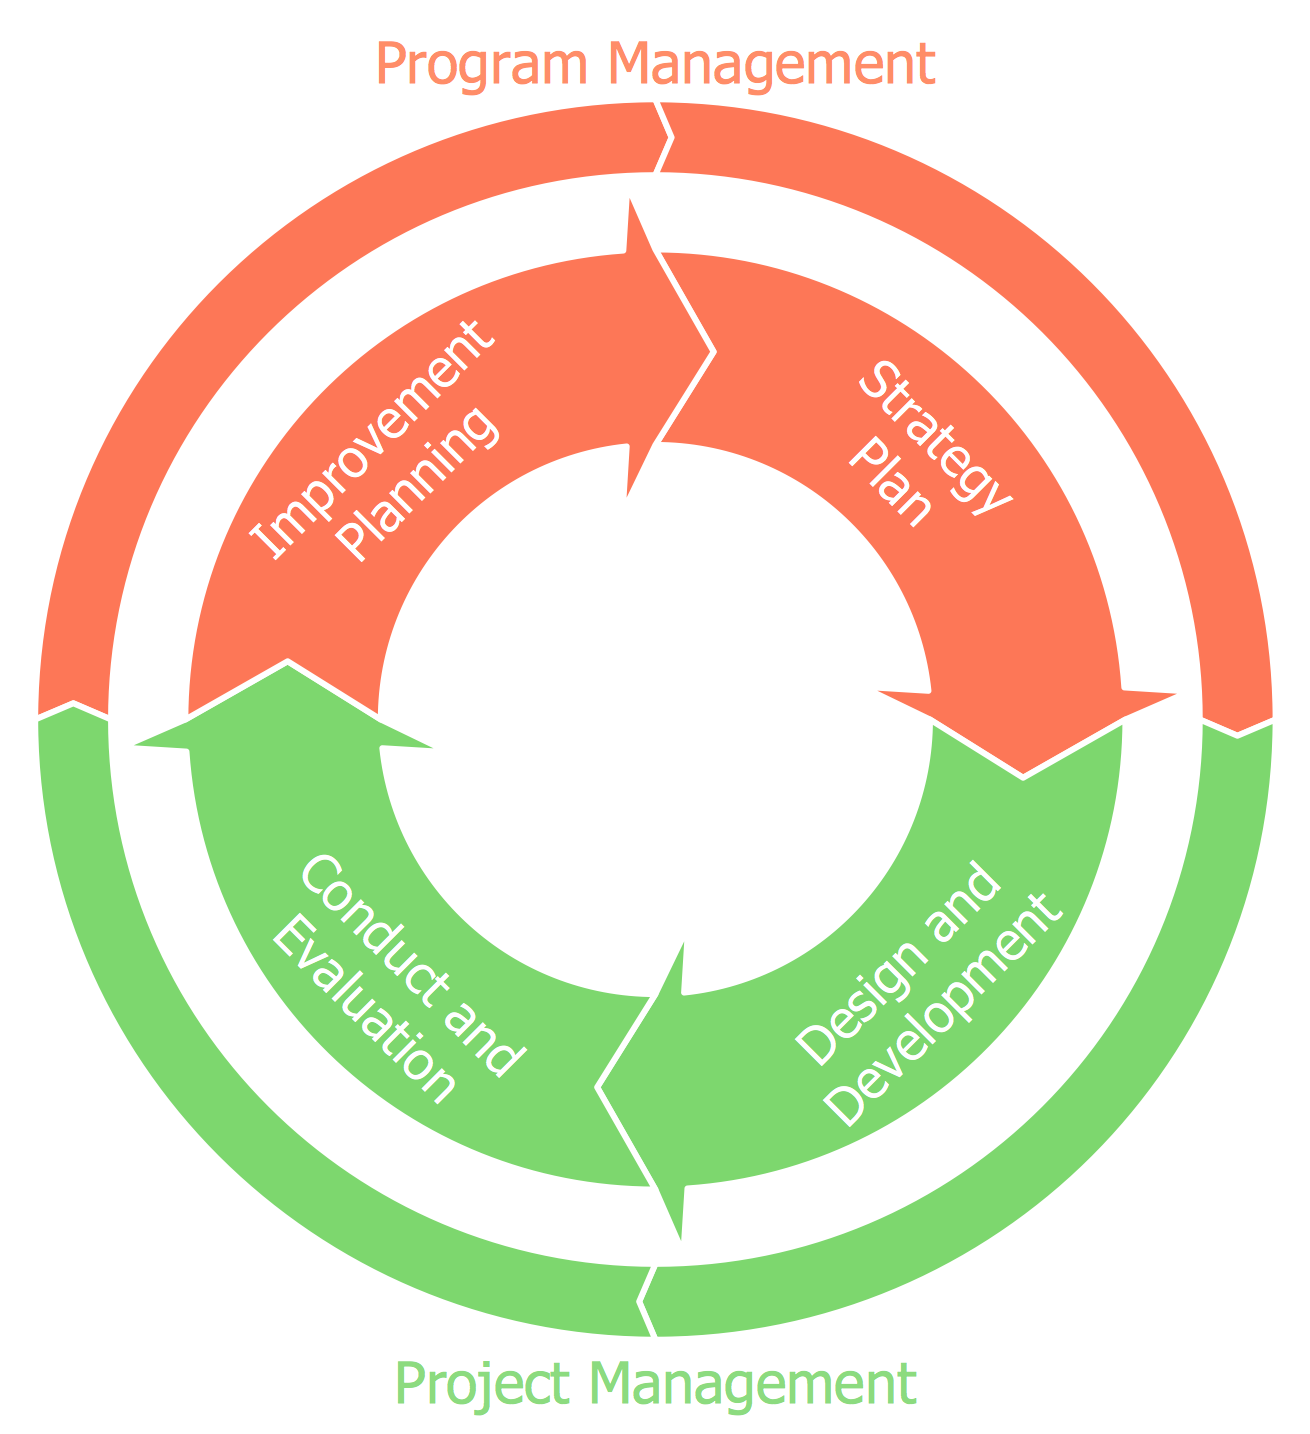
Example 1: Basic Circular Arrows Diagram — Management Exercise Cycle
This diagram was created in ConceptDraw DIAGRAM using the Basic Circular Arrows Diagram Library from the Basic Circular Arrows Diagram Solution. An experienced user spent 5 minutes creating this sample.
This Circular Arrows Diagram sample visually illustrates four stages of the emergency management exercise cycle such as a strategy plan, design and development, conduct and evaluation, and improvement planning. This sample is based on the illustration from the website of the Federal Emergency Management Agency (FEMA) of the US Department of Homeland Security. The Emergency management plans are obligatory and incredibly useful in such emergencies as earthquakes, hurricanes, fire, terrorism, industrial sabotage, public disorder, and other failures and accidents. They were created as part of emergency management and are aimed at reducing vulnerability to hazardous events, quick response and successful recovery from natural disasters. The correct choice of a diagram's type to represent your data, ideas, and other useful information, as well as its coloring style, allows you to achieve maximum success during presentations, reports, conferences, etc. The use of a Circular Arrows Diagram is perfect for this case and the two-coloring is also justified.
Example 2: Basic Circular Arrows Diagram — Emergency Management Process
This diagram was created in ConceptDraw DIAGRAM using the Basic Circular Arrows Diagram Library from the Basic Circular Arrows Diagram Solution. An experienced user spent 5 minutes creating this sample.
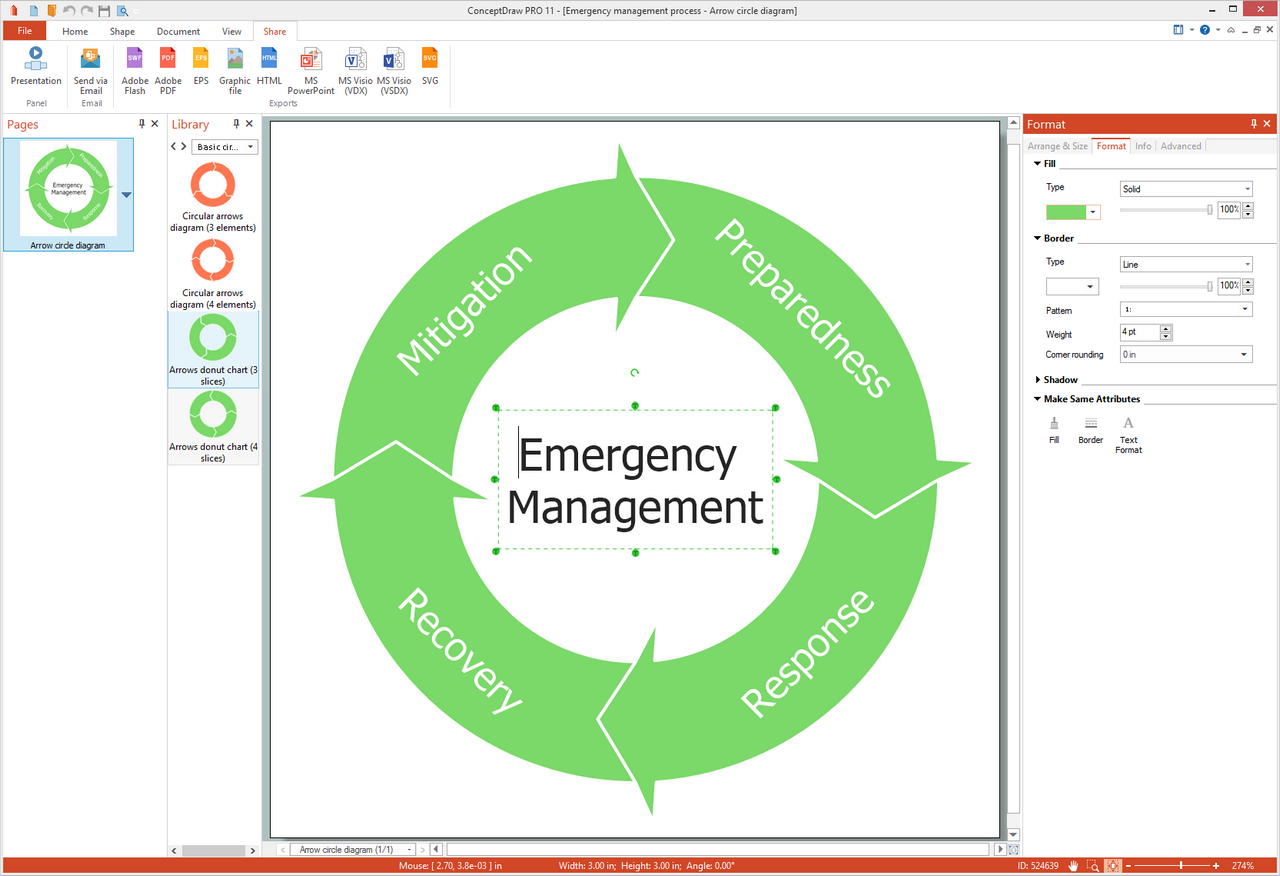
This Circular Arrows Diagram is based on the chart from the "Emergency Management" webpage published on the website of the U.S Downey City Hall in California and demonstrates the phases of the process of emergency management. Four phases are included and each of them is represented by the own sector of the diagram. These are mitigation, preparedness, response, and recovery. The mitigation suggests the prevention of hazards' development into disasters and reducing their effects when they already occur. The emergency plans are developed in the preparedness phase. The mobilization of all necessary emergency and first aid services is realized in the response phase. And finally, you can see the recovery phase that supposes the restoration of the affected area. While designing a diagram, use as the base the ready predesigned circular arrow vector stencil or circular flow diagram template that meets your needs and taste better. The different kinds of circular arrow vector objects are offered at the solution's library.

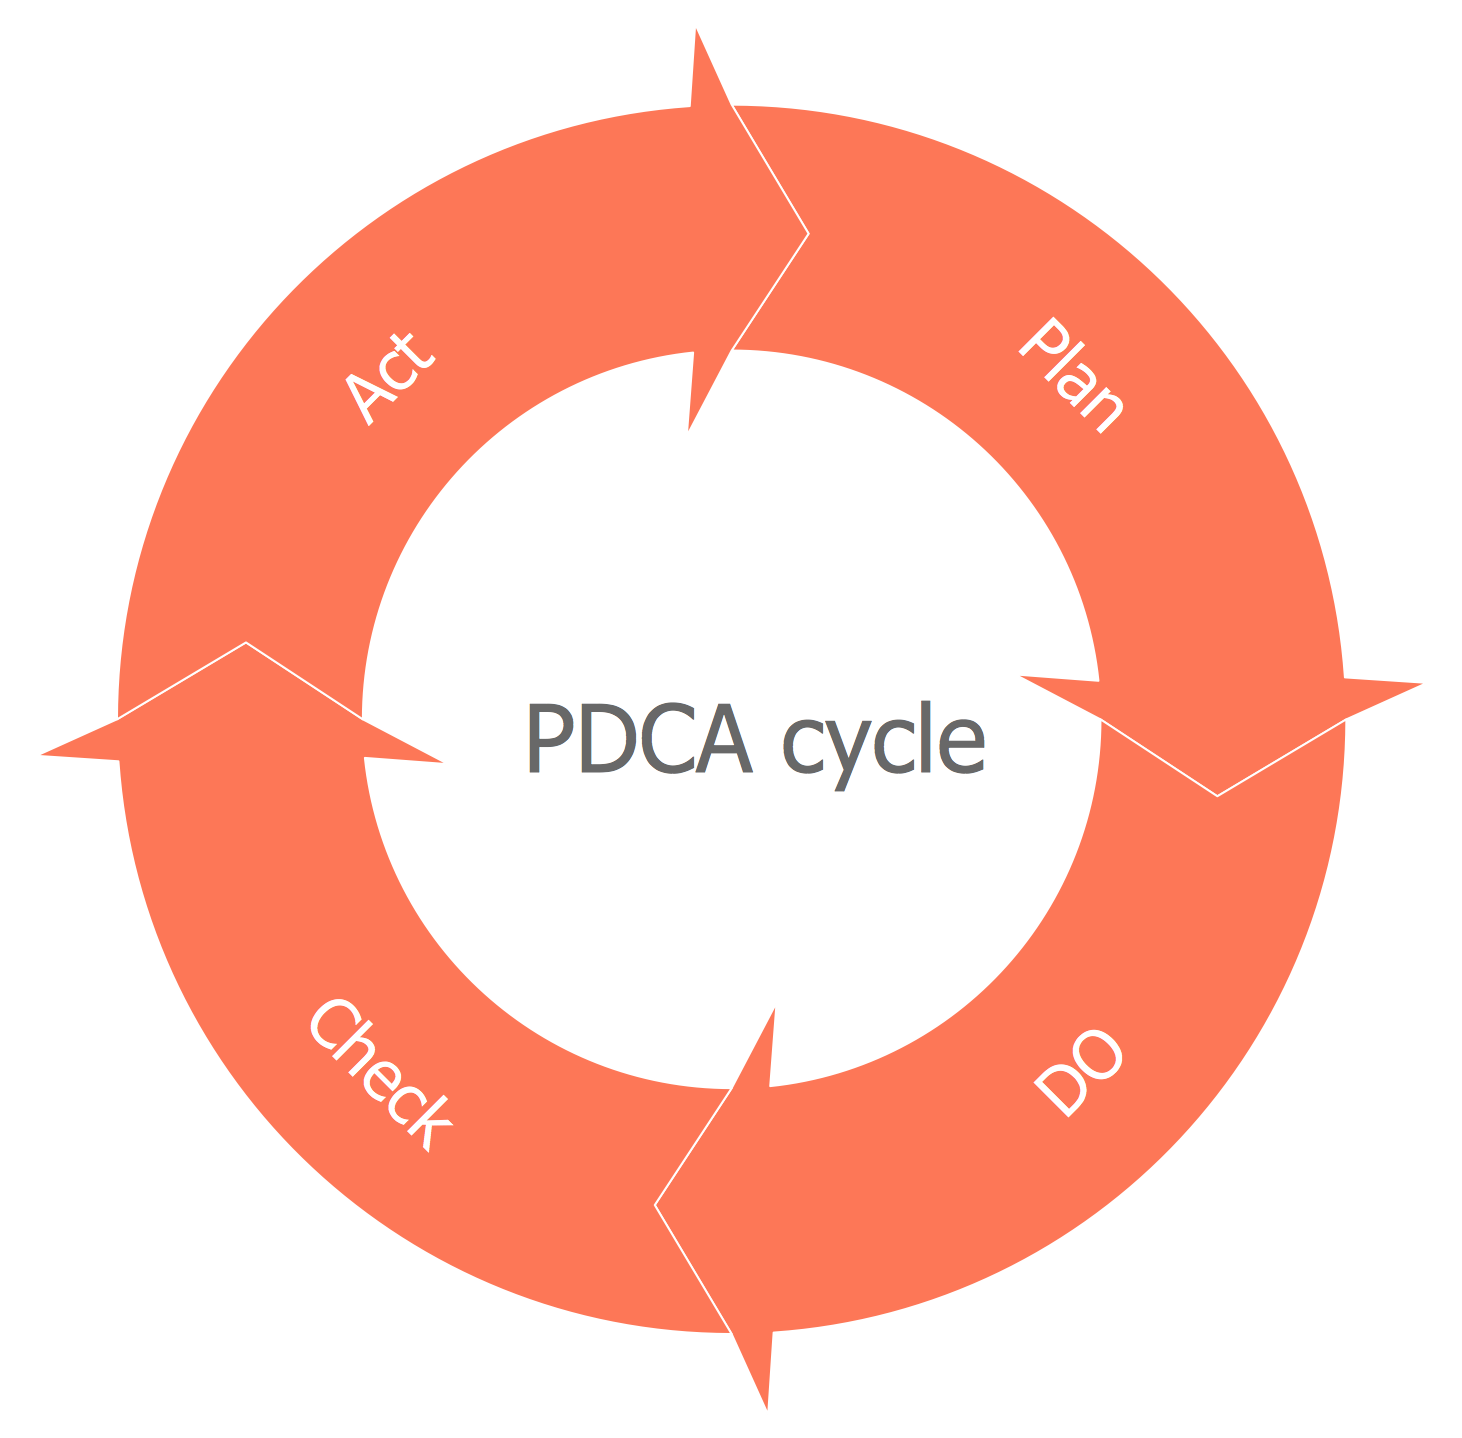
Example 3: Basic Circular Arrows Diagram — PDCA Cycle
This diagram was created in ConceptDraw DIAGRAM using the Basic Circular Arrows Diagrams Library from the Basic Circular Arrows Diagrams Solution. An experienced user spent 5 minutes creating this sample.
This sample shows the steps in the PDCA cycle, which stands for plan-do-check-act. The PDCA is the simplest manager’s action algorithm to manage the process and achieve the main process goals. It is an iterative decision-making management method that consists of four steps and is widely used in business for the control and continuous improvement of products and processes. The management cycle begins with planning, setting goals and defining processes to achieve these goals, as well as distributing the necessary resources. Then follows the process of performing the planned work, monitoring and checking the received result based on the key performance indicators, identifying and analyzing deviations. If some deviations were identified, they are analyzed, their causes are determined and measures are taken to eliminate these deviations, as well as changes in the planning and allocation of resources. The Circular Arrows Diagram with arrows is ideal for visually displaying similar charts.
Inside
What I Need to Get Started
Both ConceptDraw DIAGRAM diagramming and drawing software and the Basic Circular Arrows Diagrams solution can help creating the diagrams you need. The Basic Circular Arrows Diagrams solution can be found in the Diagrams area of ConceptDraw STORE application that can be downloaded from this site. Make sure that both ConceptDraw DIAGRAM and ConceptDraw STORE applications are installed on your computer before you get started.
How to install
After ConceptDraw STORE and ConceptDraw DIAGRAM are downloaded and installed, you can install the Basic Circular Arrows Diagrams solution from the ConceptDraw STORE.
Start using
To make sure that you are doing it all right, use the pre-designed symbols from the stencil libraries from the solution to make your drawings look smart and professional. Also, the pre-made examples from this solution can be used as drafts so your own drawings can be based on them. Using the samples, you can always change their structures, colors and data.
