- Electric and Telecom Plans Free
- Fire and Emergency Plans Free
- Floor Plans Free
- Plant Layout Plans Free
- School and Training Plans Free
- Seating Plans Free
- Security and Access Plans Free
- Site Plans Free
- Sport Field Plans Free
- Business Process Diagrams Free
- Business Process Mapping Free
- Classic Business Process Modeling Free
- Cross-Functional Flowcharts Free
- Event-driven Process Chain Diagrams Free
- IDEF Business Process Diagrams Free
- Logistics Flow Charts Free
- Workflow Diagrams Free
- ConceptDraw Dashboard for Facebook Free
- Mind Map Exchange Free
- MindTweet Free
- Note Exchange Free
- Project Exchange Free
- Social Media Response Free
- Active Directory Diagrams Free
- AWS Architecture Diagrams Free
- Azure Architecture Free
- Cisco Network Diagrams Free
- Cisco Networking Free
- Cloud Computing Diagrams Free
- Computer Network Diagrams Free
- Google Cloud Platform Free
- Interactive Voice Response Diagrams Free
- Network Layout Floor Plans Free
- Network Security Diagrams Free
- Rack Diagrams Free
- Telecommunication Network Diagrams Free
- Vehicular Networking Free
- Wireless Networks Free
- Comparison Dashboard Free
- Composition Dashboard Free
- Correlation Dashboard Free
- Frequency Distribution Dashboard Free
- Meter Dashboard Free
- Spatial Dashboard Free
- Status Dashboard Free
- Time Series Dashboard Free
- Basic Circle-Spoke Diagrams Free
- Basic Circular Arrows Diagrams Free
- Basic Venn Diagrams Free
- Block Diagrams Free
- Concept Maps Free
- Family Tree Free
- Flowcharts Free
- Basic Area Charts Free
- Basic Bar Graphs Free
- Basic Divided Bar Diagrams Free
- Basic Histograms Free
- Basic Line Graphs Free
- Basic Picture Graphs Free
- Basic Pie Charts Free
- Basic Scatter Diagrams Free
- Aerospace and Transport Free
- Artwork Free
- Audio, Video, Media Free
- Business and Finance Free
- Computers and Communications Free
- Holiday Free
- Manufacturing and Maintenance Free
- Nature Free
- People Free
- Presentation Clipart Free
- Safety and Security Free
- Analog Electronics Free
- Audio and Video Connectors Free
- Basic Circuit Diagrams Free
- Chemical and Process Engineering Free
- Digital Electronics Free
- Electrical Engineering Free
- Electron Tube Circuits Free
- Electronic Block Diagrams Free
- Fault Tree Analysis Diagrams Free
- GHS Hazard Pictograms Free
- Home Automation and Wiring Free
- Mechanical Engineering Free
- One-line Diagrams Free
- Power Сircuits Free
- Specification and Description Language (SDL) Free
- Telecom and AV Circuits Free
- Transport Hazard Pictograms Free
- Data-driven Infographics Free
- Pictorial Infographics Free
- Spatial Infographics Free
- Typography Infographics Free
- Calendars Free
- Decision Making Free
- Enterprise Architecture Diagrams Free
- Fishbone Diagrams Free
- Organizational Charts Free
- Plan-Do-Check-Act (PDCA) Free
- Seven Management and Planning Tools Free
- SWOT and TOWS Matrix Diagrams Free
- Timeline Diagrams Free
- Australia Map Free
- Continent Maps Free
- Directional Maps Free
- Germany Map Free
- Metro Map Free
- UK Map Free
- USA Maps Free
- Customer Journey Mapping Free
- Marketing Diagrams Free
- Matrices Free
- Pyramid Diagrams Free
- Sales Dashboard Free
- Sales Flowcharts Free
- Target and Circular Diagrams Free
- Cash Flow Reports Free
- Current Activities Reports Free
- Custom Excel Report Free
- Knowledge Reports Free
- MINDMAP Reports Free
- Overview Reports Free
- PM Agile Free
- PM Dashboards Free
- PM Docs Free
- PM Easy Free
- PM Meetings Free
- PM Planning Free
- PM Presentations Free
- PM Response Free
- Resource Usage Reports Free
- Visual Reports Free
- House of Quality Free
- Quality Mind Map Free
- Total Quality Management TQM Diagrams Free
- Value Stream Mapping Free
- Astronomy Free
- Biology Free
- Chemistry Free
- Language Learning Free
- Mathematics Free
- Physics Free
- Piano Sheet Music Free
- Android User Interface Free
- Class Hierarchy Tree Free
- Data Flow Diagrams (DFD) Free
- DOM Tree Free
- Entity-Relationship Diagram (ERD) Free
- EXPRESS-G data Modeling Diagram Free
- IDEF0 Diagrams Free
- iPhone User Interface Free
- Jackson Structured Programming (JSP) Diagrams Free
- macOS User Interface Free
- Object-Role Modeling (ORM) Diagrams Free
- Rapid UML Free
- SYSML Free
- Website Wireframe Free
- Windows 10 User Interface Free
Logistics Flow Charts
Currently, the use of marketing approaches is not enough for business success. The use of modern highly effective methods and methods for managing stream processes, for example, logistics, is also required. Logistics coordinates all the structures of the enterprise and is of great importance for customers, suppliers of the company, its owners and shareholders. The goal of logistics is the most rational promotion of goods and services from a supplier to an end user. It is aimed at optimizing costs, streamlining production processes, marketing, and related services within a single enterprise or group of enterprises, and strategic management of financial and information flows. Logistics is a complex process, representing a single chain of inter-related actions: from marketing and receipt of an order for production, storage, and transportation.
Logistics is a kind of philosophy of a successful business and at the same time the art of meeting the needs and desires of both consumers and suppliers. The supplier’s goal is to minimize costs and maximize profits, and the client’s goal is to receive a good quality product or service, at a reasonable price on time and with top-level service. Using logistics helps to optimize all processes in the enterprise, accelerate a turnover of working capital, reduce all types of product inventories during production, delivery and sale, reduce production costs, ensure complete customer satisfaction with the quality of goods and services.
Logistics Flow Charts solution extends ConceptDraw DIAGRAM with powerful Logistics Management Software. It provides a large collection of pre-designed vector logistic symbols, pictograms, objects, and clipart, useful for easily creating various Logistics Flow Charts and Diagrams to reflect the logistic activities and processes of an enterprise or company, depicting a company's logistics and supply chain, logistics planning, stages of movement goods from a seller to a buyer, a demonstration of ways to enhance the economic sustainability of the enterprise in the market, the development of plans for implementing logistics reforms and effective movement of products to the market. Design with pleasure Logistics flowchart, Inventory flow chart, Warehouse flowchart, Logistics flowchart, Warehouse management flowchart, Inventory management flowchart, or any other Logistics diagram using the unique tools of Logistics Flow Charts solution.
-
Install this solution Free -
What I need to get started -
Solution Requirements - This solution requires the following products to be installed:
ConceptDraw DIAGRAM v18 - This solution requires the following products to be installed:
-
Compatibility - Sonoma (14), Sonoma (15)
MS Windows 10, 11 - Sonoma (14), Sonoma (15)
-
Support for this Solution -
Helpdesk
There are 7 stencil libraries containing 262 vector objects in the Logistics Flow Charts solution.
Design Elements — Logistic Pictograms

Design Elements — Logistic Transport

Design Elements — Logistic Warehouse

Design Elements — Logistic Finance

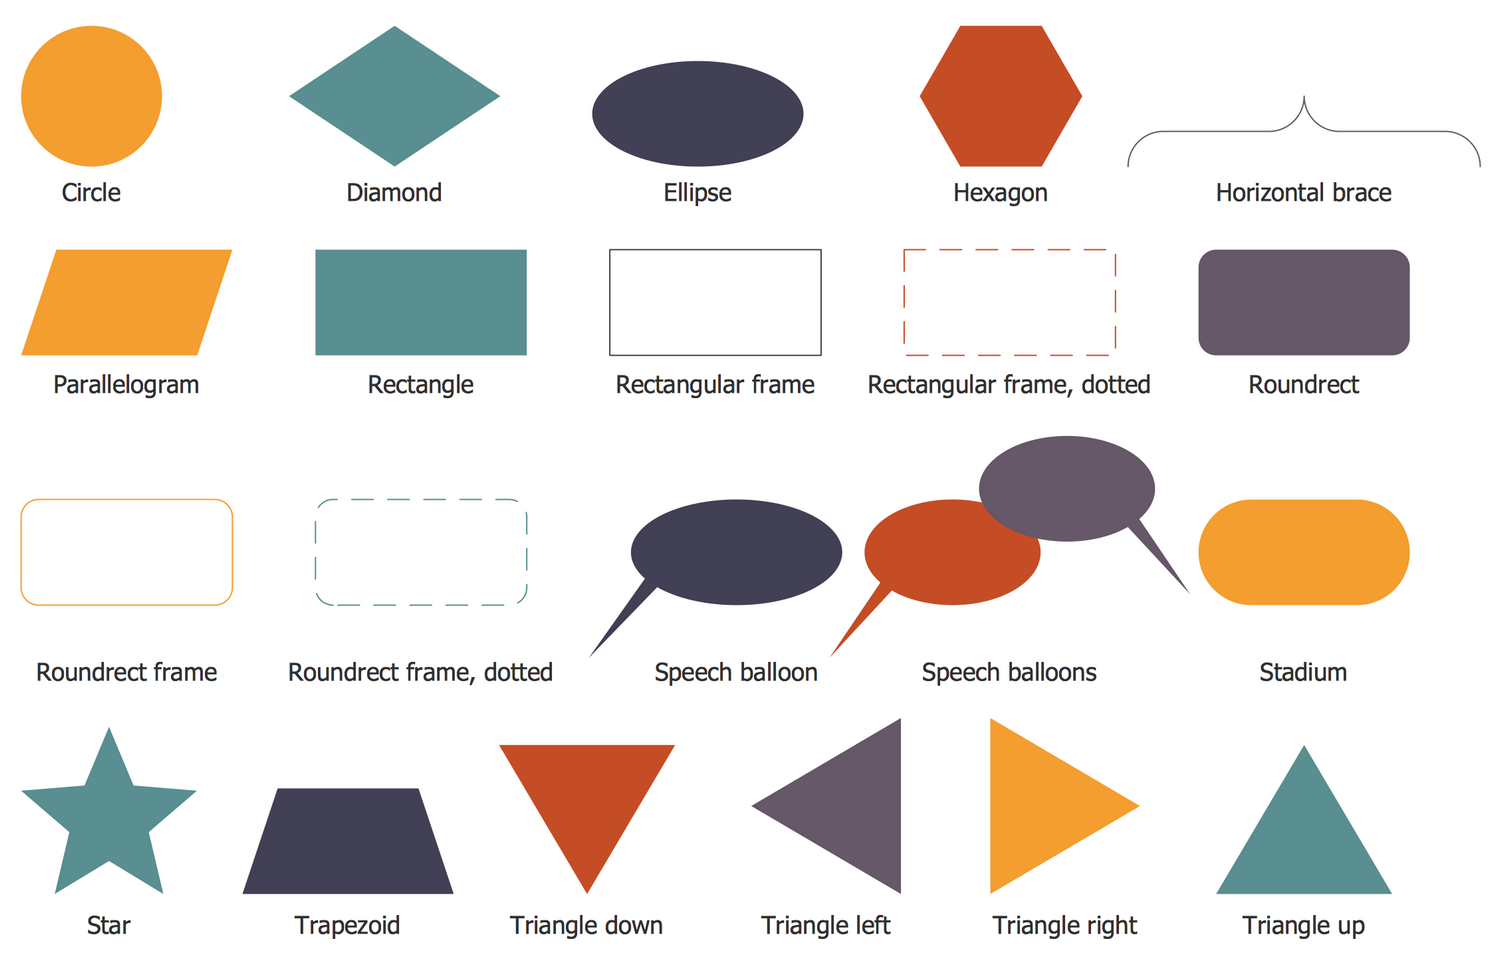
Design Elements — Logistic Shapes
Design Elements — Logistic Arrows

Design Elements — Logistic Connectors

Logistics Flow Charts Examples
There are a few samples that you see on this page which were created in the ConceptDraw DIAGRAM application by using the Logistics Flow Charts solution. Some of the solution's capabilities as well as the professional results which you can achieve are all demonstrated here on this page.
All source documents are vector graphic documents which are always available for modifying, reviewing and/or converting to many different formats, such as MS PowerPoint, PDF file, MS Visio, and many other graphic ones from the ConceptDraw Solution Park or ConceptDraw STORE. The Logistics Flow Charts solution is available to all ConceptDraw DIAGRAM users to get installed and used while working in the ConceptDraw DIAGRAM diagramming and drawing software.
Example 1: A Company's Supply Chain
This diagram was created in ConceptDraw DIAGRAM using the libraries from the Logistics Flow Charts Solution. An experienced user spent 5 minutes creating this sample.
A supply chain is a sequence of flows and processes, which includes everything from the mining of raw materials, components and natural resources, their processing into a finished product and ending by delivering to the final consumer. In all these processes different organizations, people, information are also involved. This Logistic Flow Chart illustrates the company's supply chain and was constructed on the base of "A company's supply chain (en).png" Wikimedia Commons file. It includes the processes of purchasing, production, and distribution and depicts the two-directional links of these processes with the suppliers and customers. This simple schematic can be extended according to your company's needs because in some cases the complex supply chains can exist and also involve the re-entering of ready products for their re-using or recycling. The ConceptDraw DIAGRAM software extended with Logistic Flow Charts solution is perfect for designing as simple as complex logistics and supply chain, Logistic Charts and Flow Diagrams.

Example 2: Beer Distribution Game
This diagram was created in ConceptDraw DIAGRAM using the libraries from the Logistics Flow Charts Solution. An experienced user spent 10 minutes creating this sample.
This Logistic Flow Chart sample demonstrates the principles of a beer distribution game, popular since the 1960s. It is an experiential learning business simulation game developed by the group of professors from the MIT Sloan School of Management. The main purpose of the beer distribution game is to comprehend the basis of supply chain management, to learn its key principles and the distribution side dynamics of a multi-echelon supply chain, which is used for the beer's distribution in this case. The sample was designed on the base of the "Beer Distribution Game Board.JPG" file published on the Wikimedia Commons. The game is played by teams including at least four players. The game's board is divided into four parts between which all process steps are allocated. The approximate time of playing is one hour, a discourse on each team’s results along with the entire game's results usually come afterwards.

Example 3: Distribution Mind Map
This diagram was created in ConceptDraw DIAGRAM using the libraries from the Logistics Flow Charts Solution. An experienced user spent 5 minutes creating this sample.
The distribution is one of the key terms in economics, it represents a division of some material wealth, output, income between the subjects of economic relations (individuals or factors of production, such as labor, land, capital, etc.). This Logistics diagram is based on the Wikimedia Commons file "46v1 New-Sheet.jpg" and illustrates the distribution as an economics term. The distribution process is a connecting item between production and consumption. The diagram represents two ways used for it: by car and by train; as the distribution results the content, food, money are provided. In general, economic theory, each unit of output corresponds to a unit of income. In terms of distribution, a great plus of this diagram is its illustrative form realized with the help of clipart objects. The use of logistics management software and logistics management solutions will be helpful for your business development, make sure this with ConceptDraw DIAGRAM software.

Example 4: End of Line Drawing
This diagram was created in ConceptDraw DIAGRAM using the libraries from the Logistics Flow Charts Solution. An experienced user spent 10 minutes creating this sample.
This Logistic Process Flow Chart was designed on the base of the Wikimedia Commons file "End of Line drawing.jpg and is dedicated to the work of Cermex company, which is famous in a sphere of manufacturing. A wide range of solutions in the field of engineering and producing equipment for packing different goods is offered by this company, such as equipment for packing in boxes, separators for packages, shrink equipment, machines for wrapping pallets before shipment, and others. All this equipment is used for automation of the end of line packaging all kinds of goods, from the individual products to the loaded pallets for their shipment. The chain of manufacturing processes is displayed on this diagram — from the design of primary and secondary packaging and its manufacturing to the products' collation and infeed, packaging in cardboard blanks or cardboard with film, transfer, palletization, and finishing by dispatch and supply chain.

Example 5: Groups in a Supply Chain Cut Out by Disintermediation
This diagram was created in ConceptDraw DIAGRAM using the libraries from the Logistics Flow Charts Solution. An experienced user spent 10 minutes creating this sample.
This Logistic Flow Chart sample is based on the Wikimedia Commons file "Disintermediation graphic.PNG" and uses the predesigned vector logistics symbols from the libraries of ConceptDraw's Logistics Flow Charts solution. It shows the process of removal or eliminating the intermediaries from a supply chain between the product manufacturer and the end consumer, known in economics under the title of disintermediation. The process of disintermediation includes the series of transactions, the main goal of which is the establishment of direct connections between manufacturers and clients, by the Internet or in other ways with simultaneous removal of intermediaries such as distributors, agents, wholesalers, brokers, etc. When it is possible, it has the positive aspects and benefits for the business, allowing reducing any additional expenses and accordingly minimize the price of the final product for the consumers, as well as the time of goods' delivery from the supplier to the final buyer.

Example 6: Integrator Features
This diagram was created in ConceptDraw DIAGRAM using the libraries from the Logistics Flow Charts Solution. An experienced user spent 5 minutes creating this sample.
This Logistic Flow Chart sample displays a detailed scheme of work used by the international courier delivery services company TNT Express. The diagram is developed based on the "TNT Express, un intégrateur mondial. Schéma d'activité.jpg" file published on the Wikimedia Commons. The TNT Express is one of the largest international courier delivery services realizing the delivering service in over 200 countries. It provides a service of door-to-door shipping, including all required operations: transportation, delivery, custom operations. The diagram illustrates strictly and comprehensively how the goods are delivered: first, the collecting of customers’ goods is realized in a TNT depot, then you can see their routing by the company’s own auto, air, or sea transport and delivering to target TNT deport from where the goods get to final destinations. ConceptDraw DIAGRAM software is effective in questions of logistics planning and realizing logistics activities, don’t miss your chance to use it in your work.

Example 7: Intermodal Transport Chain
This diagram was created in ConceptDraw DIAGRAM using the libraries from the Logistics Flow Charts Solution. An experienced user spent 5 minutes creating this sample.
The intermodal transport assumes delivering of cargo by multiple modes of transport, by a single document, with its congestion in transshipment points from one mode of transport to another, without the participation of cargo owner and without any handling of cargo. This sample is based on the "Logistique fluvio-maritime.jpg" file from the Wikimedia Commons and illustrates the chain of fluvio-maritime intermodal transport. The fluvio-maritime transport is a type of transport allowing one to move freely by the same vessel in the sea and on the river, at the same time considering the river's specificities and restrictions. In this way, one can improve the cargo safety and avoid any damages or losses, that can occur at the multiple cargo congestion, also eliminate the need for the partial transportation by over road, as well as save the time and additional costs of transportation by means of eliminating the need for additional cargo handling.

Example 8: Omnichannel Supply Chain
This diagram was created in ConceptDraw DIAGRAM using the libraries from the Logistics Flow Charts Solution. An experienced user spent 10 minutes creating this sample.
This Logistic Flow Chart demonstrates the omnichannel multi-currency supply chain that is popular in a modern world, especially among consumers. Numerous factors, such as pricing, fulfillment, sales, ordering, stock management are controlled by a single central stock pool, you can find it in the center of the diagram. The factors are depicted around the central stock pool. Currently, the consumers more and more often prefer to choose, buy, and return goods through varied kinds of channels instead of using the traditional stores. That's why the real-time tracking the goods across the supply chain is required. The information about the variety of retail channels by which the orders are completed is also depicted in the diagram, these are different stores, mobiles, web, catalogues, concessions, franchises. Any of the items represented in the diagram has the corresponding clipart object taken from the large variety of thematic clipart included in Logistics Flow Charts solution libraries.

Example 9: Supply Chain Network
This diagram was created in ConceptDraw DIAGRAM using the libraries from the Logistics Flow Charts Solution. An experienced user spent 5 minutes creating this sample.
This sample shows the basic diagram of the supply chain network. Typically, the supply chain is a complex system including the set of connected activities, such as handling, distributing, manufacturing and processing goods with a goal to transfer them from a vendor to the end consumer. The diagram clearly illustrates the movement of goods beginning with the stage of raw materials to the moment of their admission into the hands of the end consumer. So, you can see that the supply chain includes the following stages: raw material, supplier, manufacturer, distribution, customer, and consumer. The similar Supply Chain diagrams and Inventory Flow Chart are useful for the comprehension of the principles of supply chain construction for the specific field in order to ensure the correct and safety chain's work, to avoid troubles and disruption of the manufacturing process, imperfections, and attacks. Don't forget to make your diagrams not only informative but attractive, colorful, the pictorial ConceptDraw's clipart will help you in this.

Example 10: Transfer of Risk from the Seller to the Buyer
This diagram was created in ConceptDraw DIAGRAM using the libraries from the Logistics Flow Charts Solution. An experienced user spent 10 minutes creating this sample.
On this Logistic Flow Chart sample, created with the help of ConceptDraw DIAGRAM software on the base of "Incoterms Robert Wielgorski Revised EN.png" file from the Wikimedia Commons, you can see the scheme of transferring the risk from the seller to buyer, when the goods are delivered to the carrier. The abundance of special three-letter incoterms is included in this diagram. The incoterms are common International Commercial Terms, accepted by governments, legal authorities, and practitioners worldwide and published by the International Chamber of Commerce (ICC) as a registered ICC trademark. The incoterms are related to the international commercial law and widely used in procurement processes and different kinds of international commercial transactions, clear communication the tasks, costs, and risks associated with the international goods' transportation and delivery. The incoterms are intended to remove any possible altogether uncertainties that can arise from the differing interpretations of the rules in varied countries and successfully cope with this task.

Inside


What I Need to Get Started
Both ConceptDraw DIAGRAM diagramming and drawing software and the Logistics Flow Charts solution can help creating the business processes diagrams you need. The Logistics Flow Charts solution can be found in the Business Processes area of ConceptDraw STORE application that can be downloaded from this site. Make sure that both ConceptDraw DIAGRAM and ConceptDraw STORE applications are installed on your computer before you get started.
How to install
After ConceptDraw STORE and ConceptDraw DIAGRAM are downloaded and installed, you can install the Logistics Flow Charts solution from the ConceptDraw STORE.

Start using
To make sure that you are doing it all right, use the pre-designed symbols from the stencil libraries from the solution to make your drawings look smart and professional. Also, the pre-made examples from this solution can be used as drafts so your own drawings can be based on them. Using the samples, you can always change their structures, colors and data.
