- Electric and Telecom Plans Free
- Fire and Emergency Plans Free
- Floor Plans Free
- Plant Layout Plans Free
- School and Training Plans Free
- Seating Plans Free
- Security and Access Plans Free
- Site Plans Free
- Sport Field Plans Free
- Business Process Diagrams Free
- Business Process Mapping Free
- Classic Business Process Modeling Free
- Cross-Functional Flowcharts Free
- Event-driven Process Chain Diagrams Free
- IDEF Business Process Diagrams Free
- Logistics Flow Charts Free
- Workflow Diagrams Free
- ConceptDraw Dashboard for Facebook Free
- Mind Map Exchange Free
- MindTweet Free
- Note Exchange Free
- Project Exchange Free
- Social Media Response Free
- Active Directory Diagrams Free
- AWS Architecture Diagrams Free
- Azure Architecture Free
- Cisco Network Diagrams Free
- Cisco Networking Free
- Cloud Computing Diagrams Free
- Computer Network Diagrams Free
- Google Cloud Platform Free
- Interactive Voice Response Diagrams Free
- Network Layout Floor Plans Free
- Network Security Diagrams Free
- Rack Diagrams Free
- Telecommunication Network Diagrams Free
- Vehicular Networking Free
- Wireless Networks Free
- Comparison Dashboard Free
- Composition Dashboard Free
- Correlation Dashboard Free
- Frequency Distribution Dashboard Free
- Meter Dashboard Free
- Spatial Dashboard Free
- Status Dashboard Free
- Time Series Dashboard Free
- Basic Circle-Spoke Diagrams Free
- Basic Circular Arrows Diagrams Free
- Basic Venn Diagrams Free
- Block Diagrams Free
- Concept Maps Free
- Family Tree Free
- Flowcharts Free
- Basic Area Charts Free
- Basic Bar Graphs Free
- Basic Divided Bar Diagrams Free
- Basic Histograms Free
- Basic Line Graphs Free
- Basic Picture Graphs Free
- Basic Pie Charts Free
- Basic Scatter Diagrams Free
- Aerospace and Transport Free
- Artwork Free
- Audio, Video, Media Free
- Business and Finance Free
- Computers and Communications Free
- Holiday Free
- Manufacturing and Maintenance Free
- Nature Free
- People Free
- Presentation Clipart Free
- Safety and Security Free
- Analog Electronics Free
- Audio and Video Connectors Free
- Basic Circuit Diagrams Free
- Chemical and Process Engineering Free
- Digital Electronics Free
- Electrical Engineering Free
- Electron Tube Circuits Free
- Electronic Block Diagrams Free
- Fault Tree Analysis Diagrams Free
- GHS Hazard Pictograms Free
- Home Automation and Wiring Free
- Mechanical Engineering Free
- One-line Diagrams Free
- Power Сircuits Free
- Specification and Description Language (SDL) Free
- Telecom and AV Circuits Free
- Transport Hazard Pictograms Free
- Data-driven Infographics Free
- Pictorial Infographics Free
- Spatial Infographics Free
- Typography Infographics Free
- Calendars Free
- Decision Making Free
- Enterprise Architecture Diagrams Free
- Fishbone Diagrams Free
- Organizational Charts Free
- Plan-Do-Check-Act (PDCA) Free
- Seven Management and Planning Tools Free
- SWOT and TOWS Matrix Diagrams Free
- Timeline Diagrams Free
- Australia Map Free
- Continent Maps Free
- Directional Maps Free
- Germany Map Free
- Metro Map Free
- UK Map Free
- USA Maps Free
- Customer Journey Mapping Free
- Marketing Diagrams Free
- Matrices Free
- Pyramid Diagrams Free
- Sales Dashboard Free
- Sales Flowcharts Free
- Target and Circular Diagrams Free
- Cash Flow Reports Free
- Current Activities Reports Free
- Custom Excel Report Free
- Knowledge Reports Free
- MINDMAP Reports Free
- Overview Reports Free
- PM Agile Free
- PM Dashboards Free
- PM Docs Free
- PM Easy Free
- PM Meetings Free
- PM Planning Free
- PM Presentations Free
- PM Response Free
- Resource Usage Reports Free
- Visual Reports Free
- House of Quality Free
- Quality Mind Map Free
- Total Quality Management TQM Diagrams Free
- Value Stream Mapping Free
- Astronomy Free
- Biology Free
- Chemistry Free
- Language Learning Free
- Mathematics Free
- Physics Free
- Piano Sheet Music Free
- Android User Interface Free
- Class Hierarchy Tree Free
- Data Flow Diagrams (DFD) Free
- DOM Tree Free
- Entity-Relationship Diagram (ERD) Free
- EXPRESS-G data Modeling Diagram Free
- IDEF0 Diagrams Free
- iPhone User Interface Free
- Jackson Structured Programming (JSP) Diagrams Free
- macOS User Interface Free
- Object-Role Modeling (ORM) Diagrams Free
- Rapid UML Free
- SYSML Free
- Website Wireframe Free
- Windows 10 User Interface Free
Process Flowcharts
Being the tasks to complete in order to produce the products or services for the clients, business processes can be management ones (govern the operation of a system, operational ones (create the primary value stream and constitute the core business) and supporting ones (support the core processes).
Any business process usually begins with a mission objective. It should end with an achievement of the business objective. Any complex business process sometimes may be decomposed into a few sub-processes. Such sub-processes are known to be having their own attributes, and also contributing to achieving the objective of the so-called “super-process”.
Business processes are known to be designed for adding the value for the customer. They shouldn’t include any unnecessary activities, being modeled through many different methods and techniques.
The analysis of business processes is known to be including the mapping of processes as well as the sub-processes which can be done in the ConceptDraw DIAGRAM diagramming and drawing software.
The Process Flowcharts solution can help visualize and to communicate all the needed operations of a business process flow having the responsible people or departments mentioned at each stage for each of the operations.
Providing the ConceptDraw DIAGRAM users with the stencil library full of the design elements that represent the Process, the Stored data, the Paper type, the Terminator, the Internal Storage, the Display, the Decision, the Sequential data, the Manual Operation, the Document, the Direct data, the Preparation, the Data, the Manual Input, the Parallel mode, the Predefined process and other terms and tools, the Process Flowcharts solution may be a great assistant for many specialists.
Financiers, bankers, insurance agents, investors, venture capitalists, financial managers, auditors, controllers, accountants, tax inspectors, economists, politicians, analysts, other economic experts, officials, state managers, military specialists, analysts, strategists, tacticians, defense experts, managers, engineers and defense researchers, counterintelligence, business consultants, trainers, marketing specialists, advertising agents, PR-managers, sales managers, HR-managers, recruiters and many other specialists may find it much simpler to work on their business process flowcharts using the mentioned Process Flowcharts solution.
-
Install this solution Free -
What I need to get started -
Solution Requirements - This solution requires the following products to be installed:
ConceptDraw DIAGRAM v18 - This solution requires the following products to be installed:
-
Compatibility - Sonoma (14), Sonoma (15)
MS Windows 10, 11 - Sonoma (14), Sonoma (15)
-
Support for this Solution -
Helpdesk
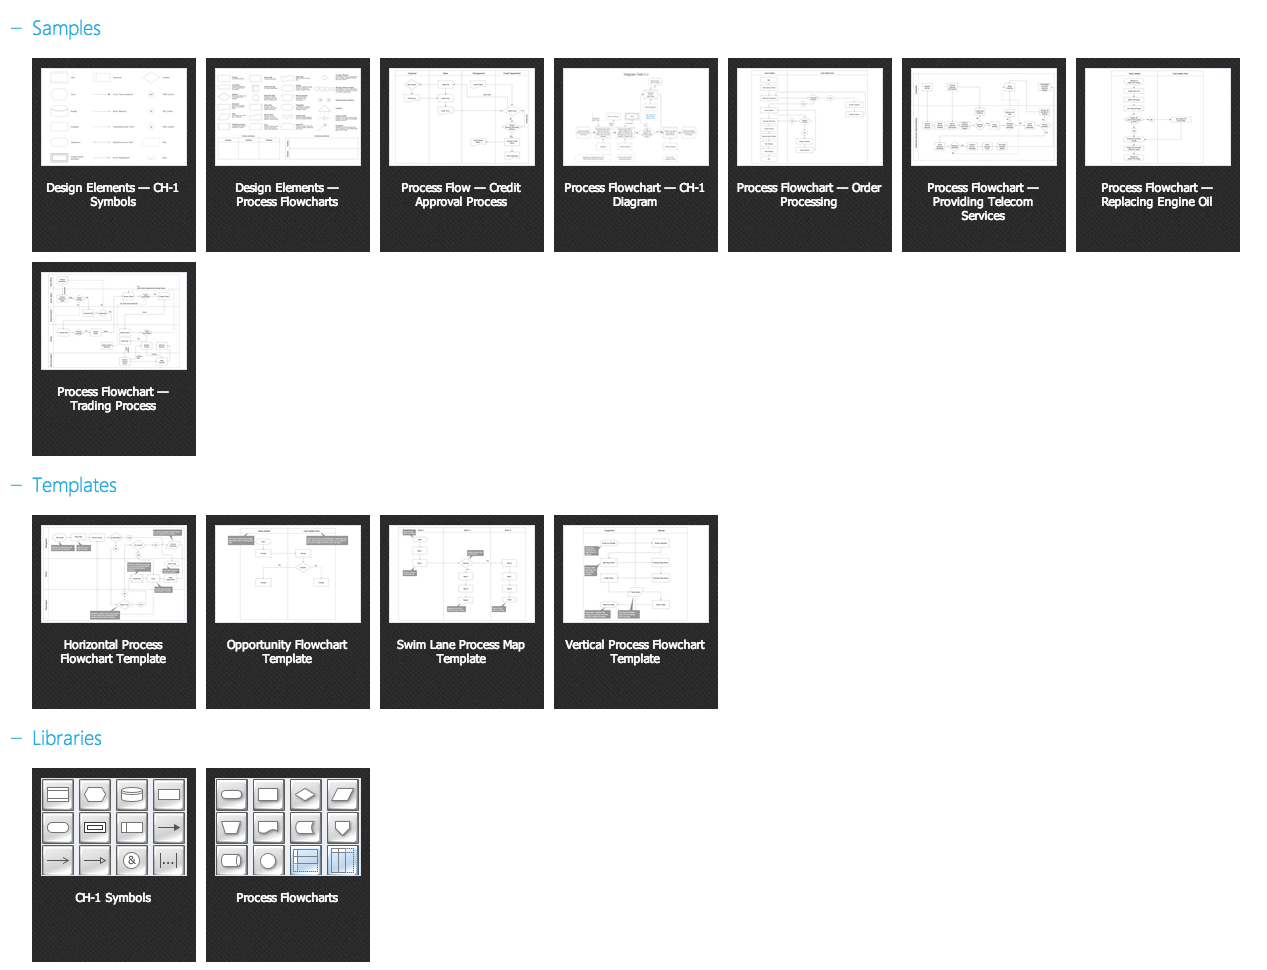
There are 2 stencil libraries containing 48 vector objects in the Process Flowcharts solution.
Design Elements — Process Flowcharts


Examples
There are a few samples that you see on this page which were created in the ConceptDraw DIAGRAM application by using the Process Flowcharts solution. Some of the solution's capabilities as well as the professional results which you can achieve are all demonstrated here on this page.
All source documents are vector graphic documents which are always available for modifying, reviewing and/or converting to many different formats, such as MS PowerPoint, PDF file, MS Visio, and many other graphic ones from the ConceptDraw Solution Park or ConceptDraw STORE. The Process Flowcharts solution is available to all ConceptDraw DIAGRAM users to get installed and used while working in the ConceptDraw DIAGRAM diagramming and drawing software.
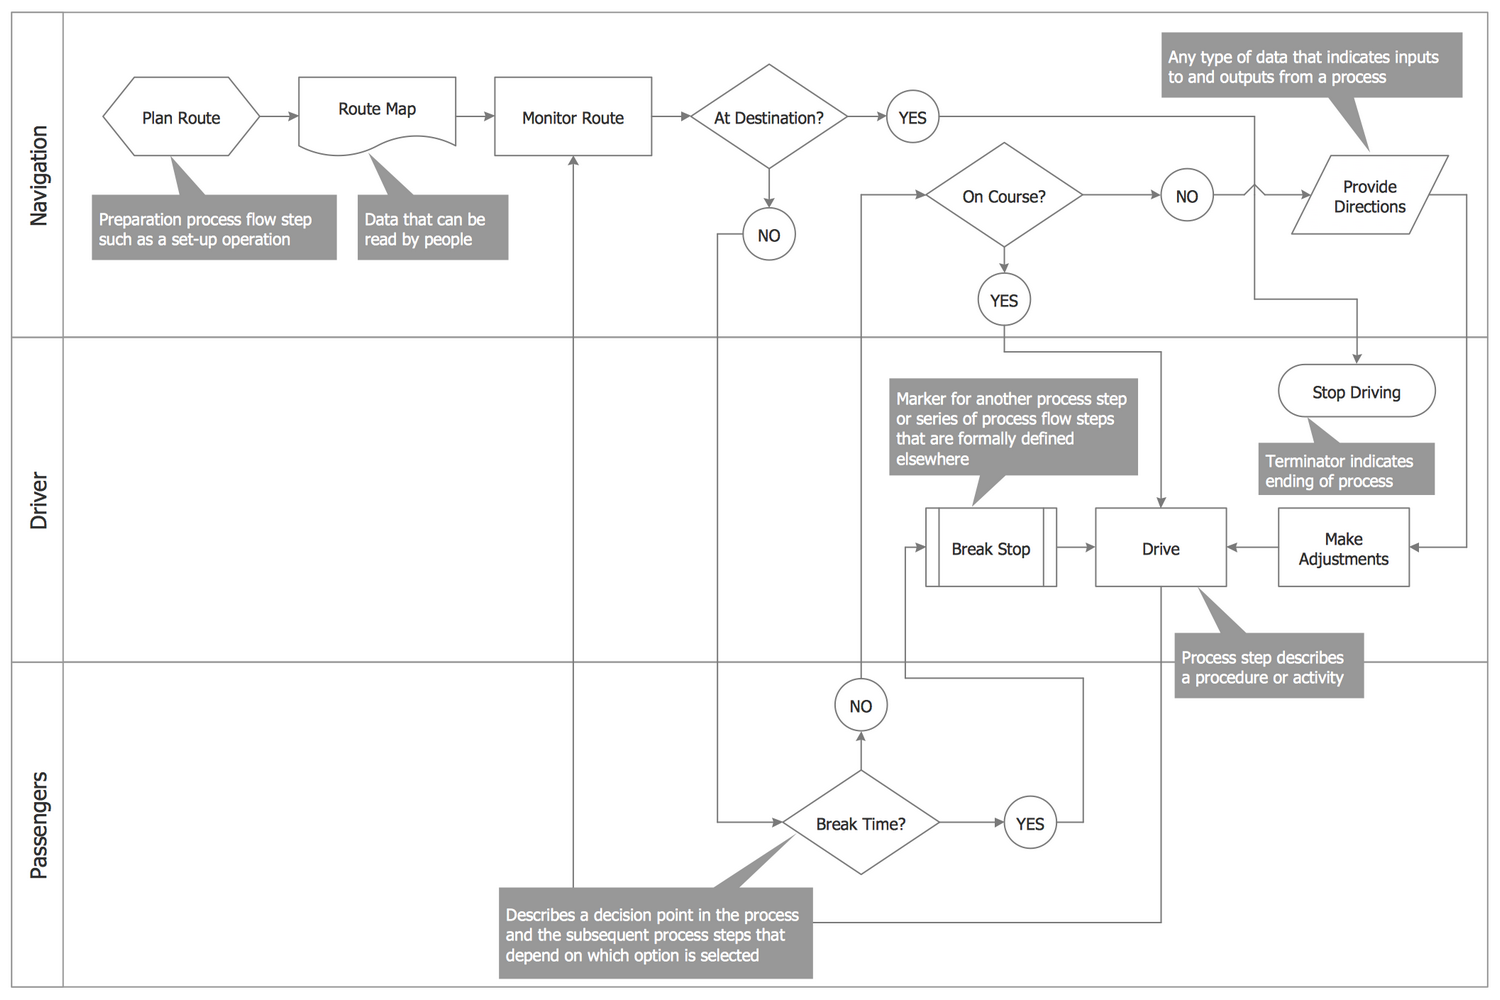
Example 1: Process Flowchart — Providing Telecom Services
This diagram was created in ConceptDraw DIAGRAM using the Process Flowcharts library from the Process Flowcharts Solution. An experienced user spent 15 minutes creating this sample.
This sample shows the Process Flowchart representing the process of providing the telecommunication services. The services in a telecommunication field are typically offered by the communications companies or telecommunications providers and are intended for ensuring the communication at the distance by means of modern telecommunication technologies and equipment. To be successfully realized and introduced, the process of providing the telecom services needs to be well defined and represented in a simple form. The Process Flow Chart ideally suits for this goal, it lets specify the repeating steps needed to be taken for a given process realization and to represent them visually. Besides, it can be then analyzed to improve the process effectiveness and to diagnose the quality issues that require resolution. There are defined two horizontal lanes in this Process Flowchart: Customer and Customer Service Representative, the process steps are visually distributed within them. The diagram is read from the top down in the direction indicated by arrows.

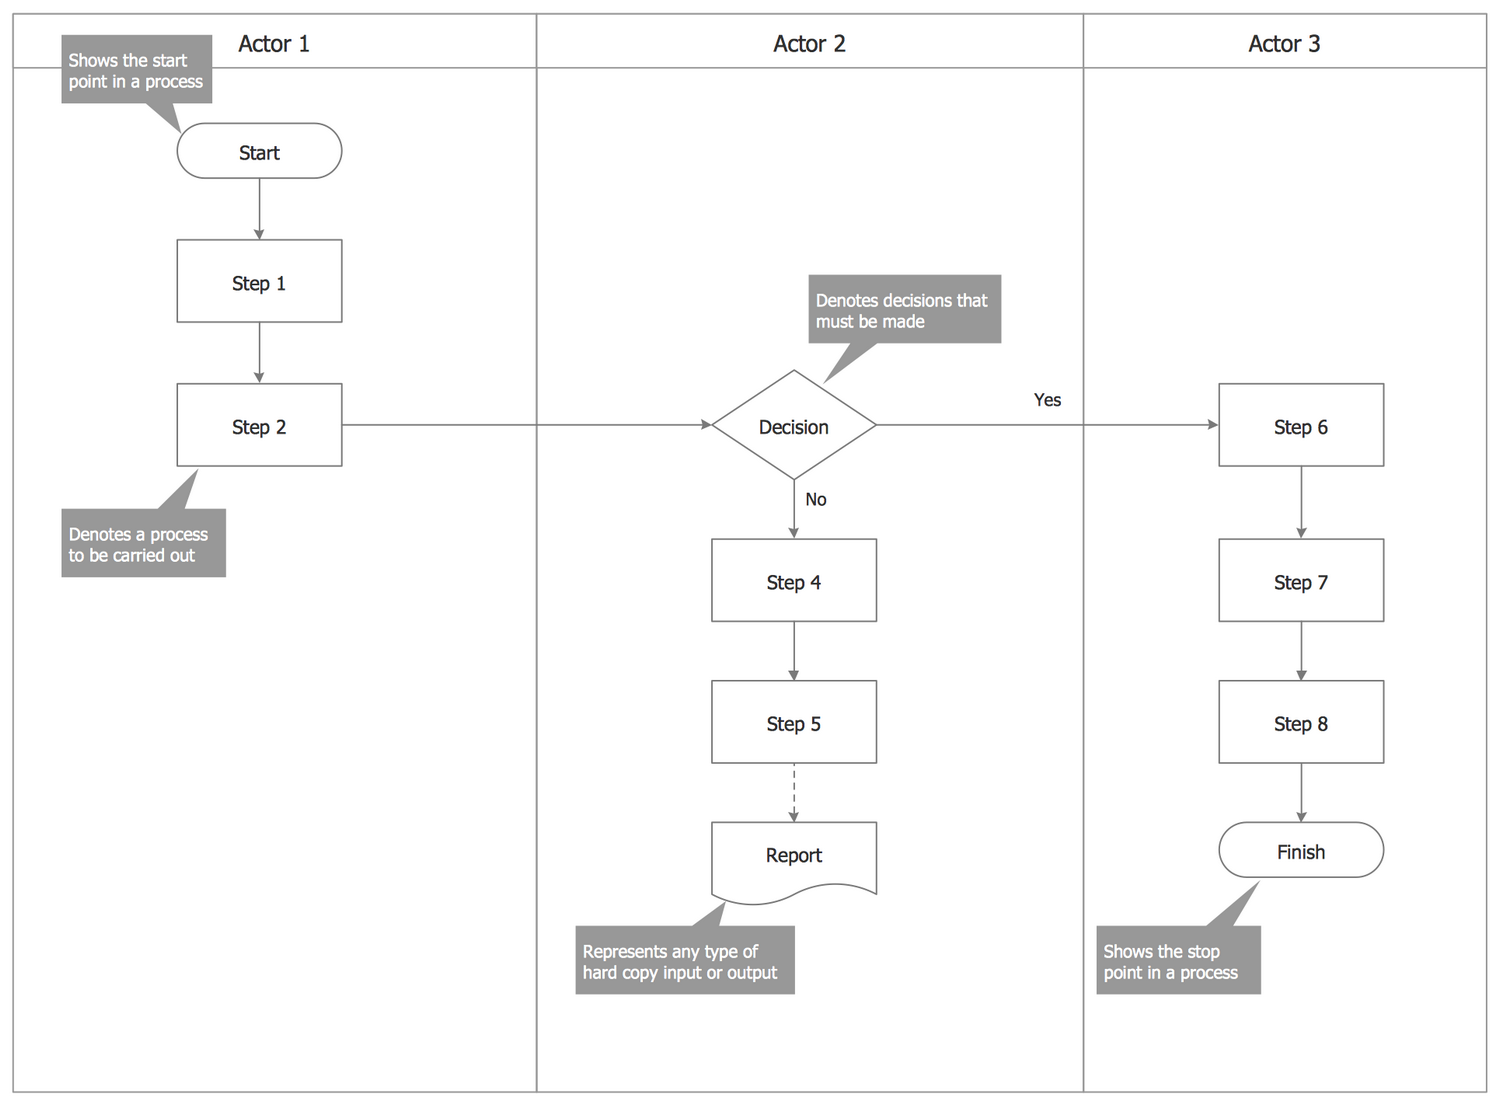
Example 2: Process Flow — Credit Approval Process
This diagram was created in ConceptDraw DIAGRAM using the Process Flowcharts library from the Process Flowcharts solution. An experienced user spent 5 minutes creating this sample.
This Process Flowchart sample shows the credit approval process, which is a process needed to be passed by an individual or a business (debtor or borrower) for receiving permission from the creditor (lender) to take the credit (loan) with defined goal or to pay for the goods or services with delay on a limited period. The credit approval process involves a number of stages and several participants, responsible persons and departments: Customer, Sales, Management, and Credit Department. In connection with the distribution of actions and responsibilities between the participants of a process, the steps are placed at the different swim lanes, that in this case is very convenient, clear and easily readable. You can observe the names of responsible at the caption of the diagram. The ConceptDraw DIAGRAM software and the Process Flowcharts solution, in particular, can effectively help you to construct the Process Flowcharts of any complexity with the aid of ready-made vector objects.

Example 3: Process Flowchart — Trading Process
This diagram was created in ConceptDraw DIAGRAM using the Process Flowcharts library from the Process Flowcharts solution. An experienced user spent 20 minutes creating this sample.
This Process Flow Diagram sample depicts the trading process flow. The trade is a kind of business activity associated with sale and purchase of goods and services. In other words, it is a commerce transaction, when the buyer gets certain goods at the property in return for anything by agreement (money, securities, etc.). The trading process involves the step-by-step execution of the algorithm. It is convenient, when the algorithm is presented in a clear and visually comprehensible view, as in this diagram. The swim lanes positioned horizontally and in a quantity of five, represent Ship Officer, Buyer Agent, Superintended, Vendor, and Receiving Agent. The process steps are represented by rectangular objects. Meeting the diamond object, you need to make a decision and depending on it move in one or another direction. The use of ConceptDraw DIAGRAM connectors to create the Cross-functional flowchart diagrams and Process flowcharts is an intuitive and time-saving solution.

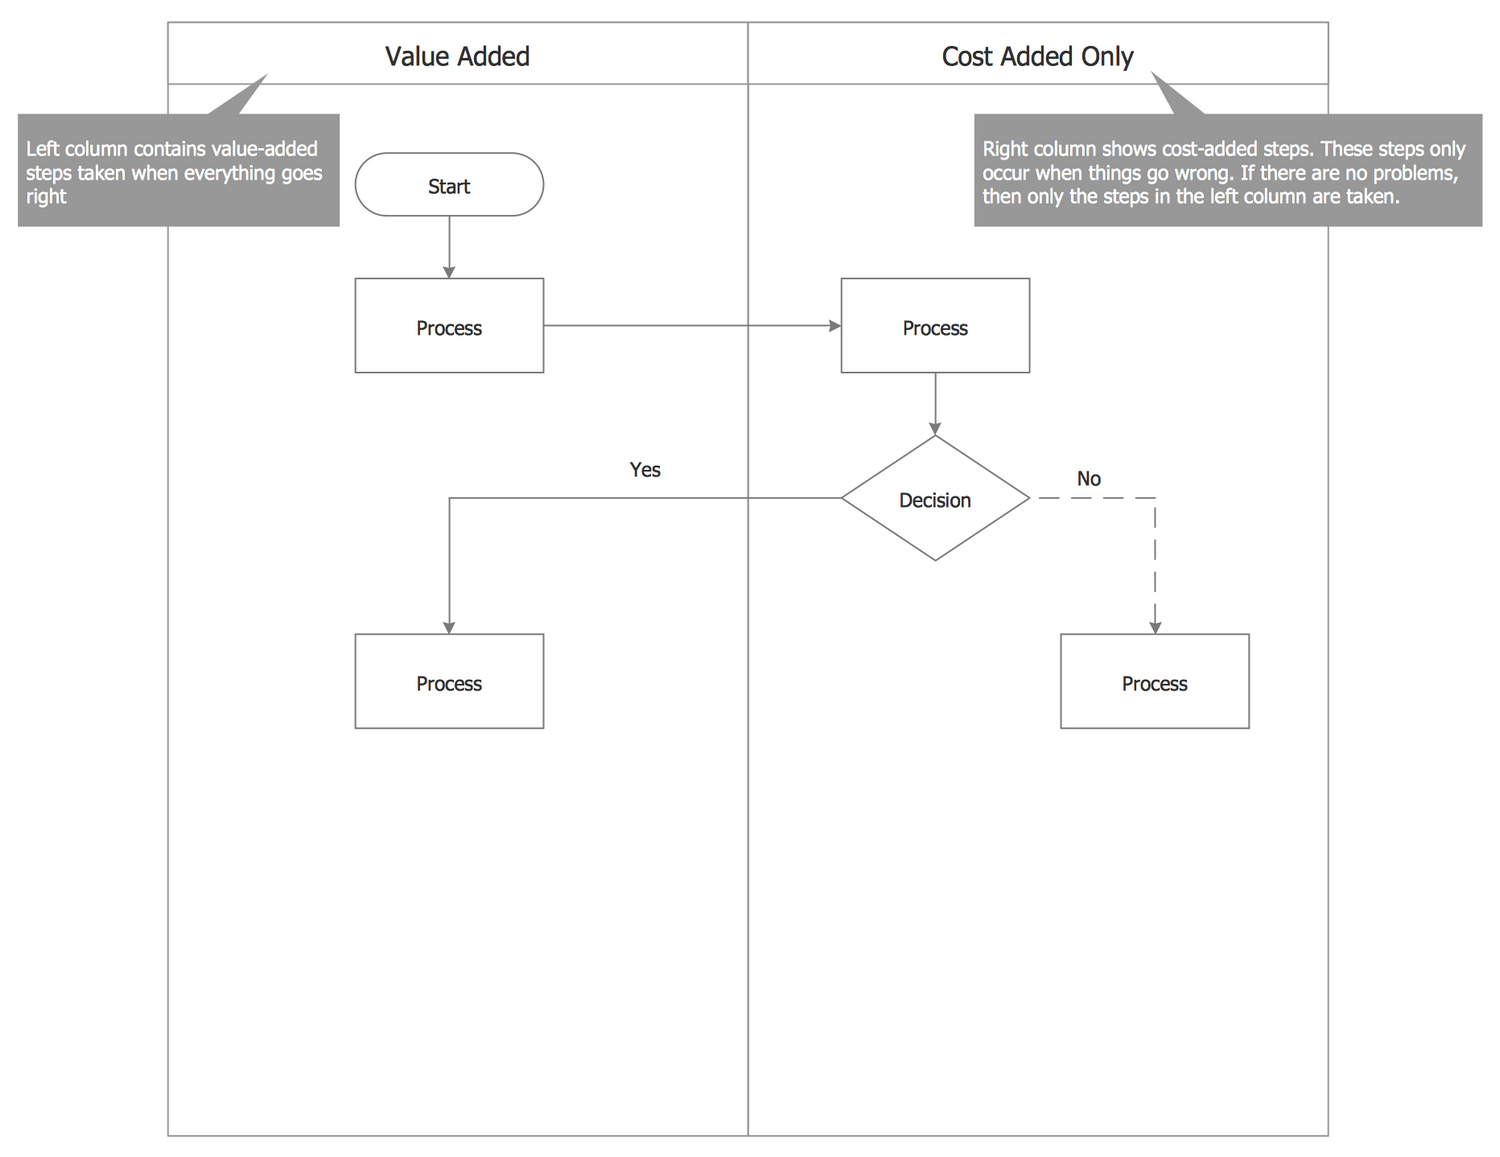
Example 4: Process Flowchart — Replacing Engine Oil
This diagram was created in ConceptDraw DIAGRAM using the Process Flowcharts library from the Process Flowcharts solution. An experienced user spent 15 minutes creating this sample.
This Opportunity Process Flowchart sample shows the steps involved in a process of replacing the engine oil. The Opportunity Flowcharts are widespread and used in a business process improvement to identify and to optimize the process steps that need be improved. It is a quite simple Flowchart with little quantity of steps, which are represented accurately from the top down and can be passed step-by-step from the Start point when an idea to change the engine oil appears, to the Finish point where is taken decision to change the engine oil. The swim lanes can be placed vertically or horizontally in the flowchart, in this case we have a vertical arrangement. All steps apart one are arranged within a Value Added swim lane, the 'Buy Engine Oil and Oil Filter' step is requiring expenses and placed within a Cost Added swim lane. This example shows a Process Flowchart that can be used for the explanation the process, analysis, re-engineering, presentation or documentation needs.

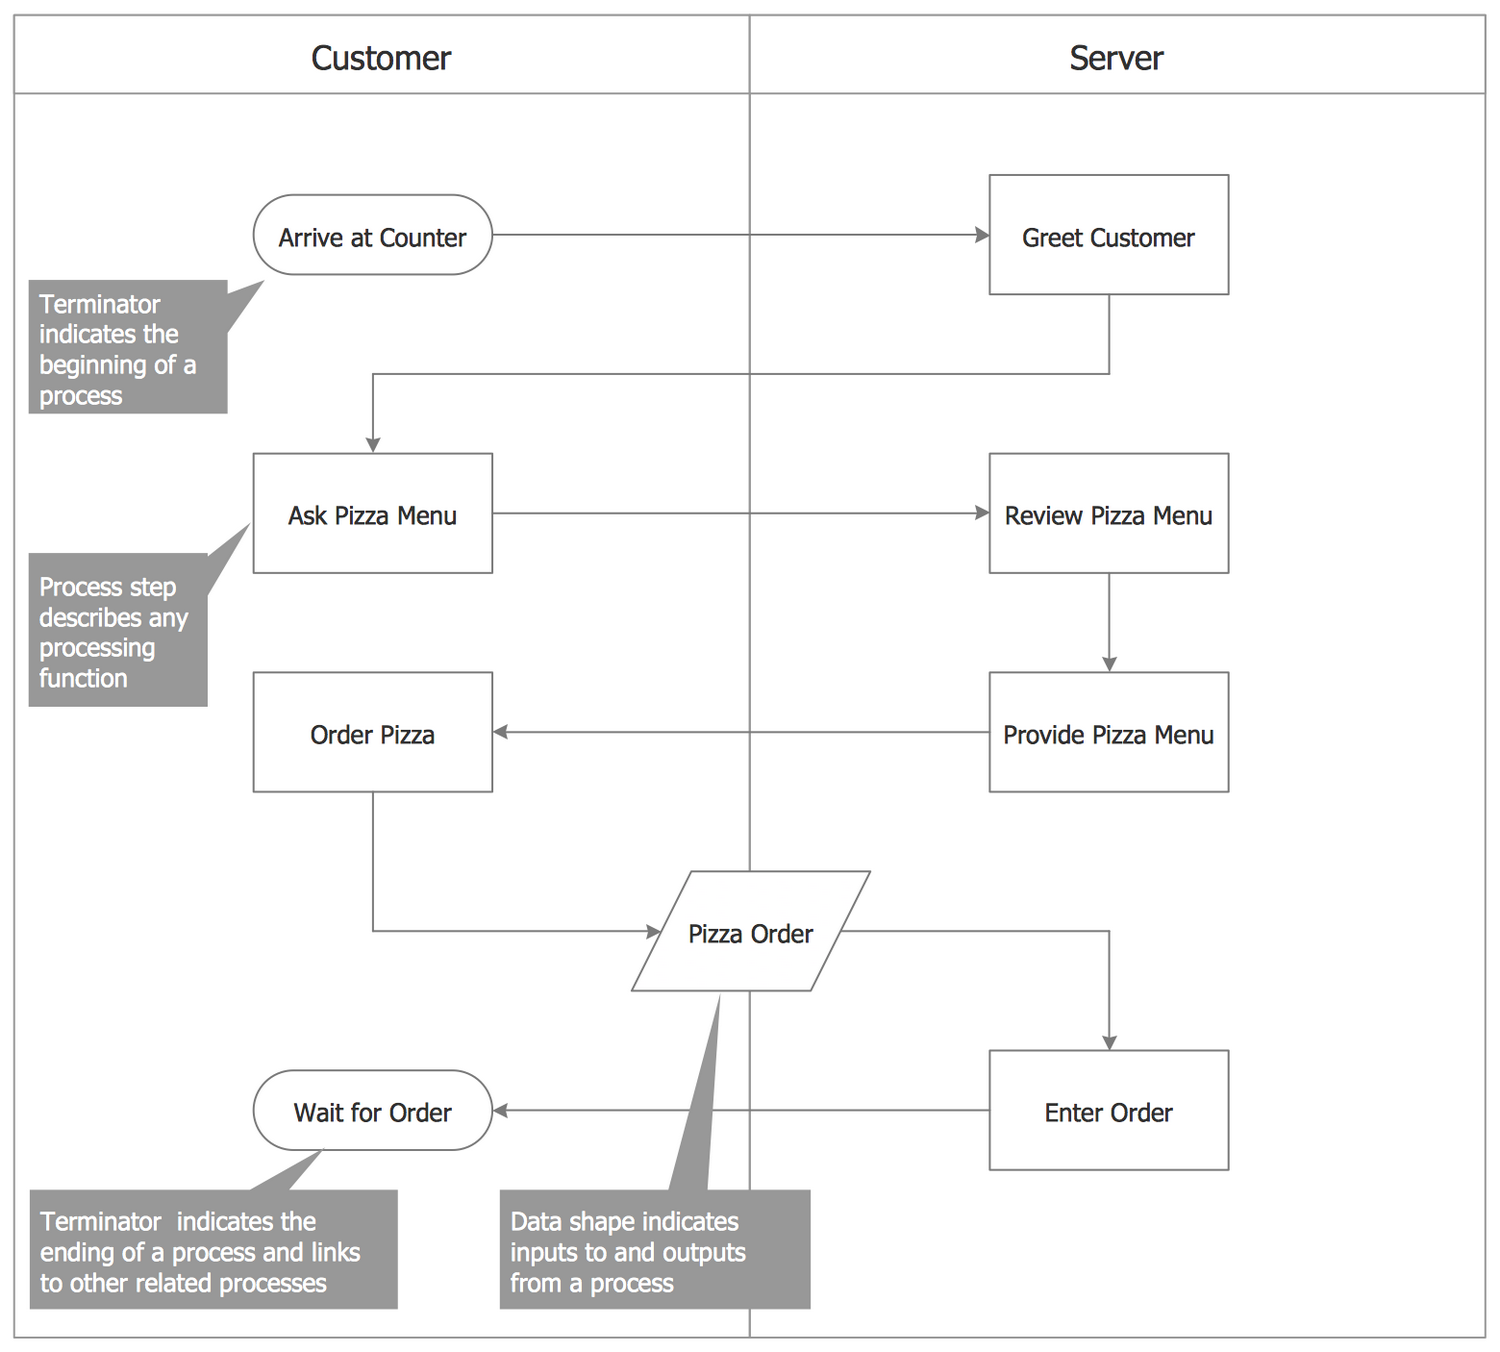
Example 5: Process Flowchart — Order Processing
This diagram was created in ConceptDraw DIAGRAM using the Process Flowcharts library from the Process Flowcharts solution. An experienced user spent 15 minutes creating this sample.
This example shows a Process Workflow diagram describing an order processing flow. There are identified the main steps of the ordering process and represented as a chain on the flowchart, with beginning at the Start point and finishing at the End point. The process steps are divided on the value-added steps and cost-added-only steps, and separated between two corresponding columns. The first ones are the steps used for making the product or service and executed from the top down when everything works ideally, and the second ones represent the actions of checking and fixing problems or inefficiencies. Trying to find the best tool to construct the Process Flowchart, pay your attention to the ConceptDraw DIAGRAM software and powerful tools of the Process Flowcharts solution. This Process Flowchart made the ordering process clear and visible, so it can be successfully used for documenting and analysis, for future automation of the process or any process-building actions inside of the company.

Example 6: Process Flowchart — CH-1 Diagram
This diagram was created in ConceptDraw DIAGRAM using the CH-1 Symbols library from the Process Flowcharts solution. An experienced user spent 15 minutes creating this sample.
This CH-1 diagram models the business process of repairing the household devices by the service center. This process includes the defined list of steps and particularities, which are represented in the diagram. The repair works are executed at the client’s place after receiving the prior telephone request by a call center operator, which takes calls every day from 8-00 until 20-00. For each request in a writing view is formalized the repair order that is delivered to the corresponding service engineer. He needs to contact with a client to clarify the details of a failure, to estimate the repair cost, to reach an agreement for the suitable time of arrival, to take the needed details on a warehouse and then repair the broken device. This Business Process Flowchart explains all steps in a clear and visual manner using the symbols predefined by the CH-1 notation, and can be used for educational needs or as detailed instruction for workers of a service center.

Inside


What I Need to Get Started
Both ConceptDraw DIAGRAM diagramming and drawing software and the Process Flowcharts solution can help creating the business processes diagrams you need. The Process Flowcharts solution can be found in the Business Processes area of ConceptDraw STORE application that can be downloaded from this site. Make sure that both ConceptDraw DIAGRAM and ConceptDraw STORE applications are installed on your computer before you get started.
How to install
After ConceptDraw STORE and ConceptDraw DIAGRAM are downloaded and installed, you can install the Process Flowcharts solution from the ConceptDraw STORE.

Start using
To make sure that you are doing it all right, use the pre-designed symbols from the stencil libraries from the solution to make your drawings look smart and professional. Also, the pre-made examples from this solution can be used as drafts so your own drawings can be based on them. Using the samples, you can always change their structures, colors and data.

Process Flowcharts
The process flowcharts are the commonly-known diagrams that may be used for business process modeling. The “flow charting methods” and related notations may be used for creating such illustrations. The business process itself is simply one of the business methods which is known to be a collection of the structured activities. Such activities may lead to producing some particular service or product. Any business process may be visualized as a flowchart. With the help of the ConceptDraw DIAGRAM application, it can be done within minutes. Mentioning a sequence of activities which have their interleaving decision points, the smart-looking business process flowcharts may be designed in order to be used for websites, presentations, and documents.
Any business process flowchart may be also visualized as a process matrix of a sequence of different activities. Such activities have the so-called “relevance rules” based on data in the process. There are many benefits of using business processes. Having the mentioned benefits leads to improving customer satisfaction as well as improving an agility for reacting to so many rapid market changes nowadays.
In general, business process flowcharts are used for analyzing, designing, managing or documenting some process, whether a general one or a particular one within a project. There may be many other names in order to describe a flowchart, such as simply a flow chart, a process chart, a process flowchart, a process map, a functional process chart, a functional flowchart, a business process model, a process model, a work flow diagram, a business flow diagram or a process flow diagram.
As already mentioned, there are many different process flowchart types. The process ones (also called as the “process flow diagrams”), deployment flowcharts (that may be horizontal or vertical cross functional flowcharts) and swim lane flowcharts (or “swim-lane diagrams”) are among them. Also, business process maps, workflow diagrams or CH-1 notation business process modeling diagrams may be considered as the business process flowcharts. All mentioned can be created in the ConceptDraw DIAGRAM diagramming and drawing software by using the Process Flowcharts solution.
The mentioned tool is intended for managing different business processes, such as methodologies of business process mapping, business process modeling, business process discovery, business process reengineering, workflow modeling and business analysis.
Business analysis is known to be a research discipline of identifying numerous business needs. It may be also used for determining the needed solutions to many business problems. Such solutions often include a so-called software-systems development component. At the same time, they may also consist of the processes improvement, organizational changes or strategic planning techniques as well as policy developments. Business analysts are known to be responsible for investigating business systems, evaluating the needed actions for improving the operations of some business system, taking a holistic view of the situation, documenting the needed business requirements for the IT system support by using the needed documentation standards, etc.
Business process discovery is another useful term to know. It is known to be related to the business processes management as well as process mining. It is a set of different techniques that either automatically or manually construct a representation of an organizations' current business processes. It also normally considers such organization’s main process variations.
The Process Flowcharts solution also help one manage the quality of the service or product, including usage of the methodology of total quality management, Six Sigma and lean manufacturing, and continual improvement process.
Apart from already described benefits from using the mentioned solution, it also assists in solving the business problems and making the decisions.
BDM is an abbreviation for the “business decision mapping”, being one of the techniques used for making decisions, mainly the business ones. Involving diagrams usage for helping articulate and work through the decision problems, BDM is also known to be designed for use in making the so-called “deliberative decisions”. Such decisions are being made based on weighing up the arguments after canvassing.
There are many advantages of using the ConceptDraw DIAGRAM software extended with the Process Flowcharts solution for designing business process flowcharts. As it includes the vector stencils libraries containing the pre-designed business process flowchart symbols, it becomes simpler to create the needed drawings having no more need for making all the design elements yourself. The libraries are: “Process flowcharts” and “CH-1 symbols” ones.
Apart from the mentioned tools, there are also the pre-made examples and templates of the professionally-looking Business process flowcharts in the solution. They all may be used as a base for creating something new — unique and also smart-looking. The Learning media contributes to using ConceptDraw DIAGRAM making sure all their products’ possibilities are being utilized.
Offering the stencil libraries full of design elements, such as the “Design Elements — Process Flowcharts” and “Design Elements — CH-1 Symbols”. The pre-made templates and examples of the business-related drawings are also available from the Business Process Flowcharts solution. They may allow simplifying the work of creating the business process flow-related drawings. Having the mentioned tools, any ConceptDraw DIAGRAM user can draw a professionally-looking business process flowchart based on the already created templates getting a smart-looking result.