- Electric and Telecom Plans Free
- Fire and Emergency Plans Free
- Floor Plans Free
- Plant Layout Plans Free
- School and Training Plans Free
- Seating Plans Free
- Security and Access Plans Free
- Site Plans Free
- Sport Field Plans Free
- Business Process Diagrams Free
- Business Process Mapping Free
- Classic Business Process Modeling Free
- Cross-Functional Flowcharts Free
- Event-driven Process Chain Diagrams Free
- IDEF Business Process Diagrams Free
- Logistics Flow Charts Free
- Workflow Diagrams Free
- ConceptDraw Dashboard for Facebook Free
- Mind Map Exchange Free
- MindTweet Free
- Note Exchange Free
- Project Exchange Free
- Social Media Response Free
- Active Directory Diagrams Free
- AWS Architecture Diagrams Free
- Azure Architecture Free
- Cisco Network Diagrams Free
- Cisco Networking Free
- Cloud Computing Diagrams Free
- Computer Network Diagrams Free
- Google Cloud Platform Free
- Interactive Voice Response Diagrams Free
- Network Layout Floor Plans Free
- Network Security Diagrams Free
- Rack Diagrams Free
- Telecommunication Network Diagrams Free
- Vehicular Networking Free
- Wireless Networks Free
- Comparison Dashboard Free
- Composition Dashboard Free
- Correlation Dashboard Free
- Frequency Distribution Dashboard Free
- Meter Dashboard Free
- Spatial Dashboard Free
- Status Dashboard Free
- Time Series Dashboard Free
- Basic Circle-Spoke Diagrams Free
- Basic Circular Arrows Diagrams Free
- Basic Venn Diagrams Free
- Block Diagrams Free
- Concept Maps Free
- Family Tree Free
- Flowcharts Free
- Basic Area Charts Free
- Basic Bar Graphs Free
- Basic Divided Bar Diagrams Free
- Basic Histograms Free
- Basic Line Graphs Free
- Basic Picture Graphs Free
- Basic Pie Charts Free
- Basic Scatter Diagrams Free
- Aerospace and Transport Free
- Artwork Free
- Audio, Video, Media Free
- Business and Finance Free
- Computers and Communications Free
- Holiday Free
- Manufacturing and Maintenance Free
- Nature Free
- People Free
- Presentation Clipart Free
- Safety and Security Free
- Analog Electronics Free
- Audio and Video Connectors Free
- Basic Circuit Diagrams Free
- Chemical and Process Engineering Free
- Digital Electronics Free
- Electrical Engineering Free
- Electron Tube Circuits Free
- Electronic Block Diagrams Free
- Fault Tree Analysis Diagrams Free
- GHS Hazard Pictograms Free
- Home Automation and Wiring Free
- Mechanical Engineering Free
- One-line Diagrams Free
- Power Сircuits Free
- Specification and Description Language (SDL) Free
- Telecom and AV Circuits Free
- Transport Hazard Pictograms Free
- Data-driven Infographics Free
- Pictorial Infographics Free
- Spatial Infographics Free
- Typography Infographics Free
- Calendars Free
- Decision Making Free
- Enterprise Architecture Diagrams Free
- Fishbone Diagrams Free
- Organizational Charts Free
- Plan-Do-Check-Act (PDCA) Free
- Seven Management and Planning Tools Free
- SWOT and TOWS Matrix Diagrams Free
- Timeline Diagrams Free
- Australia Map Free
- Continent Maps Free
- Directional Maps Free
- Germany Map Free
- Metro Map Free
- UK Map Free
- USA Maps Free
- Customer Journey Mapping Free
- Marketing Diagrams Free
- Matrices Free
- Pyramid Diagrams Free
- Sales Dashboard Free
- Sales Flowcharts Free
- Target and Circular Diagrams Free
- Cash Flow Reports Free
- Current Activities Reports Free
- Custom Excel Report Free
- Knowledge Reports Free
- MINDMAP Reports Free
- Overview Reports Free
- PM Agile Free
- PM Dashboards Free
- PM Docs Free
- PM Easy Free
- PM Meetings Free
- PM Personal Time Management Free
- PM Planning Free
- PM Presentations Free
- PM Response Free
- Resource Usage Reports Free
- Visual Reports Free
- House of Quality Free
- Quality Mind Map Free
- Total Quality Management TQM Diagrams Free
- Value Stream Mapping Free
- Astronomy Free
- Biology Free
- Chemistry Free
- Language Learning Free
- Mathematics Free
- Physics Free
- Piano Sheet Music Free
- Android User Interface Free
- Class Hierarchy Tree Free
- Data Flow Diagrams (DFD) Free
- DOM Tree Free
- Entity-Relationship Diagram (ERD) Free
- EXPRESS-G data Modeling Diagram Free
- IDEF0 Diagrams Free
- iPhone User Interface Free
- Jackson Structured Programming (JSP) Diagrams Free
- macOS User Interface Free
- Object-Role Modeling (ORM) Diagrams Free
- Rapid UML Free
- SYSML Free
- Website Wireframe Free
- Windows 10 User Interface Free
With Business Processes solutions, we support business process management projects with visualization tools for to assist in developing, improving and optimizing business workflows and methods.
The solutions from Business Processes area extend ConceptDraw DIAGRAM capabilities with a variety of icons, samples and templates relating to process diagrams, cross-functional flowcharts, and workflow diagrams.
|
12 solutions |
Last update: 2020-02-13 |
|
|
||||
|
|
||||
|
|
||||
|
|
Business process modeling with Business Process Model and Notation (BPMN) v2.0 diagrams
The key to an effective and smoothly run business is the efficiency and cohesive integration of its business processes. A business process describes the steps taken to complete any objective, task or service within a business. Processes can be divided into three distinct categories:
- Management processes - processes that describe business strategy and organizational structure.
- Operational processes - interaction between business and customer, core business activity.
- Supporting processes - e.g. health and safety, accounting, recruitment.
Business processes are born from business process management (BPM) strategy, which is the overall strategy for all company operations. BPM is responsible for a business process from its design, through to modeling, to execution. It also covers optimization or re-engineering of current processes.
The most effective method of creating or analyzing a business process is to visually interpret the steps using a business process diagram, flowchart or workflow. This is known as business process modeling, and will be performed within a company by a team who have detailed knowledge of company process, and analysts with expertise in the modeling discipline. The objective is often to increase production or lower costs - by modeling the process initially using a flowchart, inefficiencies and problems can be spotted before committing to a decision or strategy.
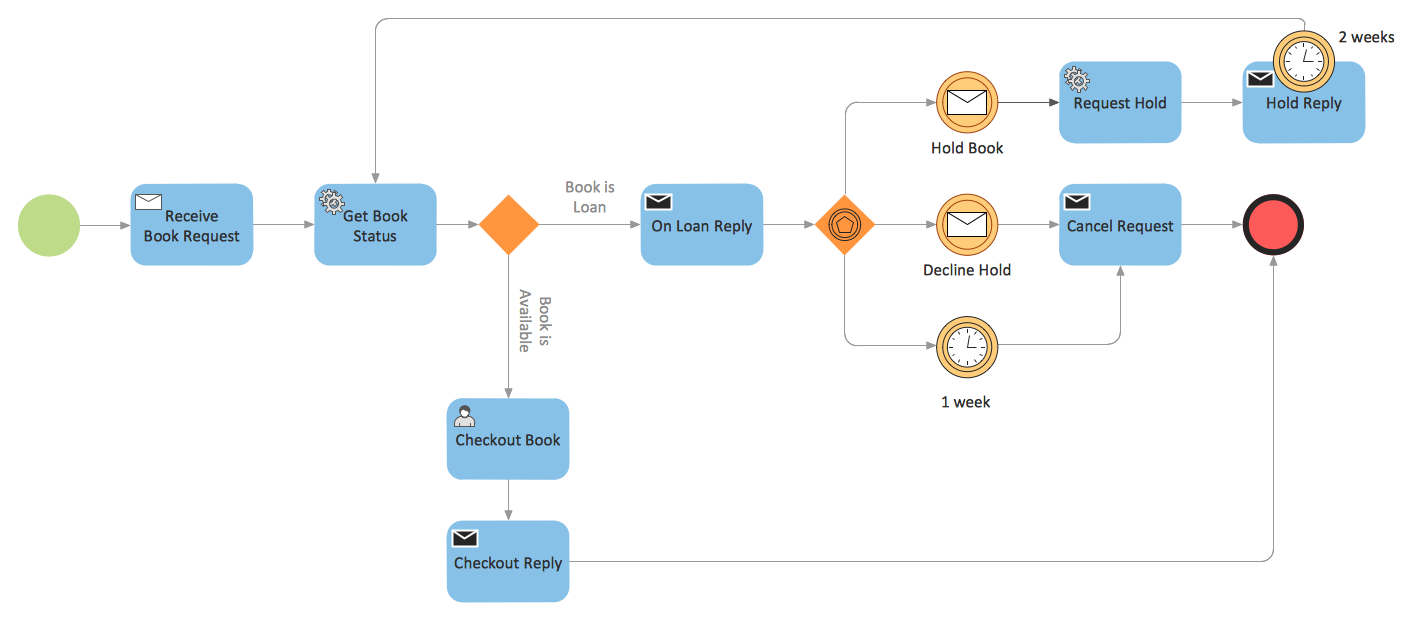
Example 1. BPMN 2.0 - Booking
Given the fluid, global nature of business at present, it is perhaps a necessity to have a standardized notation system with which to describe the steps that make up different business processes. Business Process Model and Notation (BPMN) v2.0 is a method for visualizing information in a way that's intuitive for business analysts, and also allows existing processes within a business to be compared and integrated effectively.
The aim of BPMN is assist in creating a diagram that is immediately understandable to all business stakeholders, with graphic elements that can be adapted to represent any form of function, decision, work or data flow. The symbols and structure it uses to do this can be divided into a number of categories:
- Flow objects - includes Events, which are parts of a process that happen automatically, denoted by a circle; Activities show work that needs to be done, shown as a round-cornered rectangle; Gateways show a splitting or merging of paths, using a diamond shape.
- Connecting objects - used to connect flow objects, either as Sequence Flow, which indicated the order of activities; Message Flow, a dashed line that shows interaction between organizational boundaries, shown on diagrams as 'Pools'; Association is a dotted line used to connect an 'Artifact' or text to an activity.
- Swim lanes - the widest possible overview of a process involving different organizations is known as a Pool. Different organizations each have their own Lane within the Pool, and are connected using Message Flow connecting objects.
- Artifacts - Artifacts are pieces of information added to certain Activity flow objects to giver better understanding to those viewing the process diagram. They can be data required or produces, extra activities, or simply explanatory text.
- Choreographies - These symbols allow the opportunity to show an activity or step that describes the behavior between business participants.
- Expanded objects - these symbols can be used to expand one area of a process, and see an activity or function at a higher level of detail.
ConceptDraw have designed a solution that combines BPMN v2.0 methodology and graphical notification into one powerful package. The Business Process Diagrams solution from ConceptDraw Solution Park provides a comprehensive collection of vector stencil libraries that contain pre-designed, standardized BPMN v2.0 symbols, as well as a number of templates that help you map out business processes and strategy in a variety of styles.
ConceptDraw DIAGRAM is the ideal software solution when working with process diagrams or flowcharts. Thanks to the intuitive and powerful RapidDraw interface, activity and workflow shapes and symbols can be generated on the page with a single click of a button, allowing you to map your process as quick as it comes to mind. If you get stuck at any stage, help is at hand from our tutorial videos, that can be found in our help section.
To create professional looking, informative workflow diagrams, and obtain a full library of BPMN v2.0 graphics, download and use the Business Process Diagrams solution from ConceptDraw.