- Electric and Telecom Plans Free
- Fire and Emergency Plans Free
- Floor Plans Free
- Plant Layout Plans Free
- School and Training Plans Free
- Seating Plans Free
- Security and Access Plans Free
- Site Plans Free
- Sport Field Plans Free
- Business Process Diagrams Free
- Business Process Mapping Free
- Classic Business Process Modeling Free
- Cross-Functional Flowcharts Free
- Event-driven Process Chain Diagrams Free
- IDEF Business Process Diagrams Free
- Logistics Flow Charts Free
- Workflow Diagrams Free
- ConceptDraw Dashboard for Facebook Free
- Mind Map Exchange Free
- MindTweet Free
- Note Exchange Free
- Project Exchange Free
- Social Media Response Free
- Active Directory Diagrams Free
- AWS Architecture Diagrams Free
- Azure Architecture Free
- Cisco Network Diagrams Free
- Cisco Networking Free
- Cloud Computing Diagrams Free
- Computer Network Diagrams Free
- Google Cloud Platform Free
- Interactive Voice Response Diagrams Free
- Network Layout Floor Plans Free
- Network Security Diagrams Free
- Rack Diagrams Free
- Telecommunication Network Diagrams Free
- Vehicular Networking Free
- Wireless Networks Free
- Comparison Dashboard Free
- Composition Dashboard Free
- Correlation Dashboard Free
- Frequency Distribution Dashboard Free
- Meter Dashboard Free
- Spatial Dashboard Free
- Status Dashboard Free
- Time Series Dashboard Free
- Basic Circle-Spoke Diagrams Free
- Basic Circular Arrows Diagrams Free
- Basic Venn Diagrams Free
- Block Diagrams Free
- Concept Maps Free
- Family Tree Free
- Flowcharts Free
- Basic Area Charts Free
- Basic Bar Graphs Free
- Basic Divided Bar Diagrams Free
- Basic Histograms Free
- Basic Line Graphs Free
- Basic Picture Graphs Free
- Basic Pie Charts Free
- Basic Scatter Diagrams Free
- Aerospace and Transport Free
- Artwork Free
- Audio, Video, Media Free
- Business and Finance Free
- Computers and Communications Free
- Holiday Free
- Manufacturing and Maintenance Free
- Nature Free
- People Free
- Presentation Clipart Free
- Safety and Security Free
- Analog Electronics Free
- Audio and Video Connectors Free
- Basic Circuit Diagrams Free
- Chemical and Process Engineering Free
- Digital Electronics Free
- Electrical Engineering Free
- Electron Tube Circuits Free
- Electronic Block Diagrams Free
- Fault Tree Analysis Diagrams Free
- GHS Hazard Pictograms Free
- Home Automation and Wiring Free
- Mechanical Engineering Free
- One-line Diagrams Free
- Power Сircuits Free
- Specification and Description Language (SDL) Free
- Telecom and AV Circuits Free
- Transport Hazard Pictograms Free
- Data-driven Infographics Free
- Pictorial Infographics Free
- Spatial Infographics Free
- Typography Infographics Free
- Calendars Free
- Decision Making Free
- Enterprise Architecture Diagrams Free
- Fishbone Diagrams Free
- Organizational Charts Free
- Plan-Do-Check-Act (PDCA) Free
- Seven Management and Planning Tools Free
- SWOT and TOWS Matrix Diagrams Free
- Timeline Diagrams Free
- Australia Map Free
- Continent Maps Free
- Directional Maps Free
- Germany Map Free
- Metro Map Free
- UK Map Free
- USA Maps Free
- Customer Journey Mapping Free
- Marketing Diagrams Free
- Matrices Free
- Pyramid Diagrams Free
- Sales Dashboard Free
- Sales Flowcharts Free
- Target and Circular Diagrams Free
- Cash Flow Reports Free
- Current Activities Reports Free
- Custom Excel Report Free
- Knowledge Reports Free
- MINDMAP Reports Free
- Overview Reports Free
- PM Agile Free
- PM Dashboards Free
- PM Docs Free
- PM Easy Free
- PM Meetings Free
- PM Personal Time Management Free
- PM Planning Free
- PM Presentations Free
- PM Response Free
- Resource Usage Reports Free
- Visual Reports Free
- House of Quality Free
- Quality Mind Map Free
- Total Quality Management TQM Diagrams Free
- Value Stream Mapping Free
- Seven Basic Tools of Quality $25
- Astronomy Free
- Biology Free
- Chemistry Free
- Language Learning Free
- Mathematics Free
- Physics Free
- Piano Sheet Music Free
- Android User Interface Free
- Class Hierarchy Tree Free
- Data Flow Diagrams (DFD) Free
- DOM Tree Free
- Entity-Relationship Diagram (ERD) Free
- EXPRESS-G data Modeling Diagram Free
- IDEF0 Diagrams Free
- iPhone User Interface Free
- Jackson Structured Programming (JSP) Diagrams Free
- macOS User Interface Free
- Object-Role Modeling (ORM) Diagrams Free
- Rapid UML Free
- SYSML Free
- Website Wireframe Free
- Windows 10 User Interface Free
Seven Basic Tools of Quality
The Seven Basic Tools of Quality are known to be a designation that is given to some fixed set of graphical techniques. Such techniques may be identified as the ones that are the most helpful in solving the troubleshooting quality-related issues. Being suitable for people with only some formal training in statistics, the Seven Basic Tools of Quality can be used for solving many quality-related issues, including the most important ones.
The mentioned seven tools are Ishikawa diagram, Check sheet, Histogram, Pareto chart, Control chart, Scatter diagram, and Stratification. They are known to be standing in contrast to more advanced statistical methods. Such methods are a survey sampling, statistical hypothesis testing, acceptance sampling, design of experiments, multivariate analysis as well as many other methods that are being developed in such field of business activity as an operations research.
Seven Basic Tools of Quality solution can be used by any ConceptDraw DIAGRAM user, giving them a particular set of different graphical techniques helping on focus on such activity as identifying the root cause of many quality-related issues.
This solution offers the well-known visual tools that can be helpful in representing all the data that relates to many different quality initiatives. Some of such tools are the pre-made templates that can be used for making different fishbone diagrams, Pareto charts, and histograms. Helping to visualize data from every department across an entire organization, the mentioned examples that were previously created by the IT specialists may be useful for making the unique-looking drawings. There are also the pre-designed icon libraries in the Seven Basic Tools of Quality solution that can be used by all the ConceptDraw DIAGRAM application’s users who want to manage quality control throughout an organization by using a modern tool.
The Seven Basic Tools of Quality solution must be useful for many quality assurance engineers, quality managers, and other quality-related specialists, as well as project managers and other projects’ participants.
-
Buy this solution $25 -
Solution Requirements - This solution requires the following products to be installed:
ConceptDraw DIAGRAM v17 - This solution requires the following products to be installed:
-
Compatibility - Monterey (12), Ventura (13), Sonoma (14)
MS Windows 8.1, 10 - Monterey (12), Ventura (13), Sonoma (14)
-
Support for this Solution -
Helpdesk
There are 9 libraries containing 78 vector objects in the Seven Basic Tools of Quality solution.
Design Elements — Cause-and-Effect Diagram

Design Elements — Check Sheet

Design Elements — Control Chart

Design Elements — Histogram

Design Elements — Pareto Chart

Design Elements — Process Flowchart

Design Elements — Run Chart

Design Elements — Scatterplot

Design Elements — Stratification Diagram

Examples
There are a few samples that you see on this page which were created in the ConceptDraw DIAGRAM application by using the Seven Basic Tools of Qualityg solution. Some of the solution's capabilities as well as the professional results which you can achieve are all demonstrated here on this page.
All source documents are vector graphic documents which are always available for modifying, reviewing and/or converting to many different formats, such as MS PowerPoint, PDF file, MS Visio, and many other graphic ones from the ConceptDraw Solution Park or ConceptDraw STORE. The Seven Basic Tools of Quality solution is available to all ConceptDraw DIAGRAM users to get installed and used while working in the ConceptDraw DIAGRAM diagramming and drawing software.
Example 1: Cause-and-Effect Diagram
This diagram was created in ConceptDraw DIAGRAM using the Cause-and-Effect Diagram library from the Seven Basic Tools of Quality solution. An experienced user spent 10 minutes creating this sample.
Cause-and-effect diagrams (also known as fishbone diagrams) provide the opportunity to look at the various causes of a specific event. In quality control, they are commonly used to prevent defects in product design, by identifying potential factors that could result in output variance.

Example 2: Frequency Allocation Histogram
This diagram was created in ConceptDraw DIAGRAM using the Histogram library from the Seven Basic Tools of Quality solution. An experienced user spent 10 minutes creating this sample.
A histogram shows the distribution of numerical data. For instance, in this example we can show the most commonly reached wind speeds in a certain area, and this allows you to take an overall look at the data in a relative format.

Example 3: Histogram Example — Age of Presidential Ascension
This diagram was created in ConceptDraw DIAGRAM using the Histogram library from the Seven Basic Tools of Quality solution. An experienced user spent 15 minutes creating this sample.
Plotting the age of US presidents results in a symmetric histogram. Charts of this type make it easy to establish patterns (or the lack thereof), and to work out average results or identify outliers.

Example 4: Pareto Chart — Titanium Investment Casting Defects
This diagram was created in ConceptDraw DIAGRAM using the Pareto Chart library from the Seven Basic Tools of Quality solution. An experienced user spent 15 minutes creating this sample.
A Pareto chart combines elements of a line chart and bar graph, where individual values are shown as bars in descending numerical order, and the line represents the cumulative total of these values. In quality control, a Pareto chart commonly identifies the most common source of defects.

Example 5: Process Flowchart — QA Processes in HSRU
This diagram was created in ConceptDraw DIAGRAM using the Process Flowchart library from the Seven Basic Tools of Quality solution. An experienced user spent 20 minutes creating this sample.
Flow charts are an ideal solution for mapping any form of repeatable action or process within a business. They are versatile enough to show management processes, steps for product design, or data flow within a system.


Inside


What I Need to Get Started
After ConceptDraw DIAGRAM is installed, the Seven Basic Tools of Quality solution can be purchased either from the Quality Management area of ConceptDraw STORE itself or from our online store. Thus, you will be able to use the Seven Basic Tools of Quality solution straight after.

How to install
First of all, make sure that both ConceptDraw STORE and ConceptDraw DIAGRAM applications are downloaded and installed on your computer. Next, install the Seven Basic Tools of Quality solution from the ConceptDraw STORE to use it in the ConceptDraw DIAGRAM application.

Start using
Start using the Seven Basic Tools of Quality solution to make the professionally looking quality control diagrams by adding the design elements taken from the stencil libraries and editing the pre-made examples that can be found there.

The Seven Basic Tools of Quality
Every business wants to run at its most efficient equilibrium, with maximum productivity from its workers, cost effective product design and manufacture, and smart strategic decision making regarding managements and HR processes. For this to occur there must be a constant monitoring of business activity, a way of breaking down an organization into its component parts in such a way that they can be analyzed and refined, where any faults, inefficiencies, or redundant processes can be determined and dealt with.
This is the essence of defining quality in the workplace, and the Seven Basic Tools of Quality were conceived as a generic, visual form of tackling these issues. They comprise of seven forms of diagram that are varied enough to be applied to any industry troubleshooting scenario, but simple enough that workers of all types can intuitively understand and implement them.
Despite the title, there are 3 possible options for the last diagram, making 9 in total:
Fishbone diagram
So named because they resemble the bone structure of a fish, fishbone diagrams are also known as Ishikawa diagrams, after their creator and quality control pioneer, Kaoru Ishikawa. Yet another name is a cause-and-effect diagram, and this better explains their purpose — you start with an identified problem, or effect, and work backwards to figure out every causal influence on that effect.
Check sheet
Check sheets are a simple way of making sure that a quality process is followed and standards are followed. They take the form of a grid, where each row is a step that must be checked off in real time as data is gathered.

A check sheet made using ConceptDraw DIAGRAM, that takes note of faulty car parts
Control chart
A control sheet records a certain statistic at different times throughout the day, and applies to it a mean data range. If data values fall well outside that range, it could be a sign of an inefficiency or some flaw in a business process.
Histogram
A histogram is used to show the frequency distribution of a specific variable. Visually, they are arranged something like bar charts, but differ in that they don't compare disparate sets of data against each other — instead they take one value, and show its frequency within predefined intervals.
Pareto chart
Pareto charts combines both a bar chart and a line graph, where the bar chart shows individual data values, and a cumulative total represented by the line. In quality control, it is a way of spotting the largest source of defects, complaints, flaws and so on.
This ConceptDraw DIAGRAM designed Pareto chart shows the frequency of each type of defect
Scatter diagram
By plotting against an X and Y axis, a scatter graph can show two variables of a set of data. You can then ascertain the relationship between the variables by how the data points are clustered on the diagram.
Stratification diagram
Stratification is a means of taking data from different sources, and instead of viewing it as a single group, the data is separated by source so as better to identify patterns. To make the data even more representative, the sample size changes according to source.
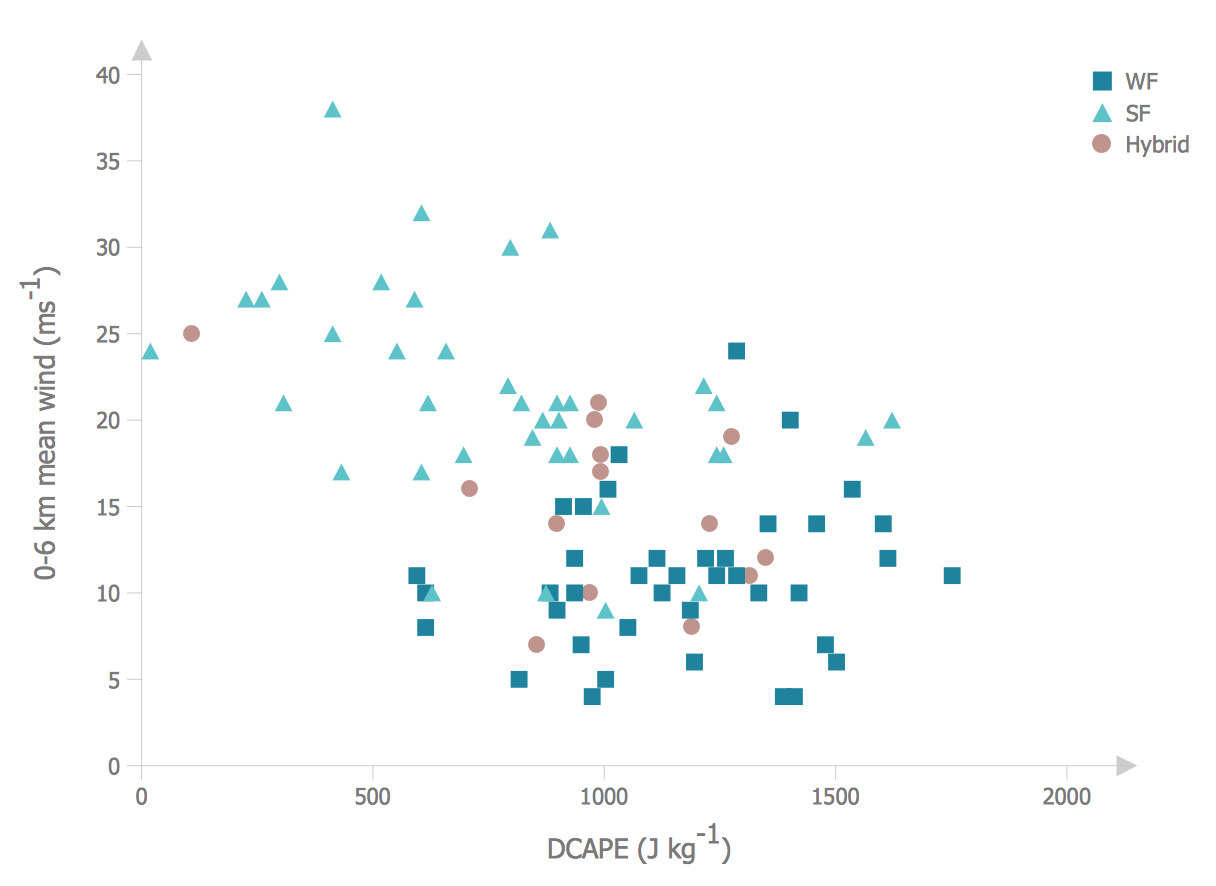
Made using ConceptDraw DIAGRAM, this stratification chart distinguishes sources by icon shape
Flow chart
Flow charts are common throughout business, as a way of representing steps in a process or workflow, shown on the page as boxes containing actions, instructions or decisions.
Run chart
A run chart displays recorded data over a certain time period, where the X axis shows the passage of time, and data points are plotted along the graph as they are observed. The often show some form of measurable manufacturing output, making it possible to quickly identify outliers and shifts in scale and frequency.
These diagram tools have become invaluable to modern business, and with so many cases for their use, it's important that workers of all experience levels can produce clear and effective examples that can be shared across a team and understood at a glance.
CS Odessa are the first to bring all these techniques together under one office solution, and further extend the performance of their diagramming software, ConceptDraw DIAGRAM. The Seven Basic Tools of Quality solution provides an extensive set of vector stencil libraries and individual sample templates for each form of quality control diagram, allowing workers to chose which diagram works best for their situation without switching software or searching for multiple add-ons. To compliment the solution, CS Odessa have a dedicated online help resource, referencing specific quality diagram examples, teaching new users how to get started with their design, and offering tips and tricks to more experienced workers.
A company's success relies on quality assurance and quality output. With the Seven Basic Tools of Quality solution for ConceptDraw DIAGRAM, you have the diagramming power to reach that standard.