- Electric and Telecom Plans Free
- Fire and Emergency Plans Free
- Floor Plans Free
- Plant Layout Plans Free
- School and Training Plans Free
- Seating Plans Free
- Security and Access Plans Free
- Site Plans Free
- Sport Field Plans Free
- Business Process Diagrams Free
- Business Process Mapping Free
- Classic Business Process Modeling Free
- Cross-Functional Flowcharts Free
- Event-driven Process Chain Diagrams Free
- IDEF Business Process Diagrams Free
- Logistics Flow Charts Free
- Workflow Diagrams Free
- ConceptDraw Dashboard for Facebook Free
- Mind Map Exchange Free
- MindTweet Free
- Note Exchange Free
- Project Exchange Free
- Social Media Response Free
- Active Directory Diagrams Free
- AWS Architecture Diagrams Free
- Azure Architecture Free
- Cisco Network Diagrams Free
- Cisco Networking Free
- Cloud Computing Diagrams Free
- Computer Network Diagrams Free
- Google Cloud Platform Free
- Interactive Voice Response Diagrams Free
- Network Layout Floor Plans Free
- Network Security Diagrams Free
- Rack Diagrams Free
- Telecommunication Network Diagrams Free
- Vehicular Networking Free
- Wireless Networks Free
- Comparison Dashboard Free
- Composition Dashboard Free
- Correlation Dashboard Free
- Frequency Distribution Dashboard Free
- Meter Dashboard Free
- Spatial Dashboard Free
- Status Dashboard Free
- Time Series Dashboard Free
- Basic Circle-Spoke Diagrams Free
- Basic Circular Arrows Diagrams Free
- Basic Venn Diagrams Free
- Block Diagrams Free
- Concept Maps Free
- Family Tree Free
- Flowcharts Free
- Basic Area Charts Free
- Basic Bar Graphs Free
- Basic Divided Bar Diagrams Free
- Basic Histograms Free
- Basic Line Graphs Free
- Basic Picture Graphs Free
- Basic Pie Charts Free
- Basic Scatter Diagrams Free
- Aerospace and Transport Free
- Artwork Free
- Audio, Video, Media Free
- Business and Finance Free
- Computers and Communications Free
- Holiday Free
- Manufacturing and Maintenance Free
- Nature Free
- People Free
- Presentation Clipart Free
- Safety and Security Free
- Analog Electronics Free
- Audio and Video Connectors Free
- Basic Circuit Diagrams Free
- Chemical and Process Engineering Free
- Digital Electronics Free
- Electrical Engineering Free
- Electron Tube Circuits Free
- Electronic Block Diagrams Free
- Fault Tree Analysis Diagrams Free
- GHS Hazard Pictograms Free
- Home Automation and Wiring Free
- Mechanical Engineering Free
- One-line Diagrams Free
- Power Сircuits Free
- Specification and Description Language (SDL) Free
- Telecom and AV Circuits Free
- Transport Hazard Pictograms Free
- Data-driven Infographics Free
- Pictorial Infographics Free
- Spatial Infographics Free
- Typography Infographics Free
- Calendars Free
- Decision Making Free
- Enterprise Architecture Diagrams Free
- Fishbone Diagrams Free
- Organizational Charts Free
- Plan-Do-Check-Act (PDCA) Free
- Seven Management and Planning Tools Free
- SWOT and TOWS Matrix Diagrams Free
- Timeline Diagrams Free
- Australia Map Free
- Continent Maps Free
- Directional Maps Free
- Germany Map Free
- Metro Map Free
- UK Map Free
- USA Maps Free
- Customer Journey Mapping Free
- Marketing Diagrams Free
- Matrices Free
- Pyramid Diagrams Free
- Sales Dashboard Free
- Sales Flowcharts Free
- Target and Circular Diagrams Free
- Cash Flow Reports Free
- Current Activities Reports Free
- Custom Excel Report Free
- Knowledge Reports Free
- MINDMAP Reports Free
- Overview Reports Free
- PM Agile Free
- PM Dashboards Free
- PM Docs Free
- PM Easy Free
- PM Meetings Free
- PM Personal Time Management Free
- PM Planning Free
- PM Presentations Free
- PM Response Free
- Resource Usage Reports Free
- Visual Reports Free
- House of Quality Free
- Quality Mind Map Free
- Total Quality Management TQM Diagrams Free
- Value Stream Mapping Free
- Astronomy Free
- Biology Free
- Chemistry Free
- Language Learning Free
- Mathematics Free
- Physics Free
- Piano Sheet Music Free
- Android User Interface Free
- Class Hierarchy Tree Free
- Data Flow Diagrams (DFD) Free
- DOM Tree Free
- Entity-Relationship Diagram (ERD) Free
- EXPRESS-G data Modeling Diagram Free
- IDEF0 Diagrams Free
- iPhone User Interface Free
- Jackson Structured Programming (JSP) Diagrams Free
- macOS User Interface Free
- Object-Role Modeling (ORM) Diagrams Free
- Rapid UML Free
- SYSML Free
- Website Wireframe Free
- Windows 10 User Interface Free
Management Infographics
Being the administration of an organization, management is known as including different activities of setting the strategy of an organization and coordinating the efforts of its employees. All this is implemented in order to accomplish the objectives of the organization and at the application of available resources (e.g., financial, technological, human resources and natural ones).
Management may involve the process of identifying the objective, the mission, the procedures, the rules, and the manipulation of the human capital of an enterprise in order to contribute to the success of the enterprise, implying effective communication in this way. An enterprise environment can imply both human motivation and whether some kind of successful progress or system outcome.
Being an essential function used for improving someone's life and relationships, management has a wide range of applications involving humans in its processes. Both communication and a positive endeavor are main aspects of any management activity. Different measurements, plans, motivational psychological goals, economic measures, and tools are either needed or not as essential components within any management activity. Henri Fayol is known to be considering any management to be consisting of six functions: forecasting, planning, organizing, commanding, coordinating, and controlling.
The Management Infographics solution is an extension for the ConceptDraw DIAGRAM diagramming and drawing software. Manage the pre-made drawing tools, use them to make professional and smart-looking management infographic drawings. This solution contains the pre-designed examples for drawing the management infographics, useful templates to help to get started, and the stencil libraries with the management-related design elements. They allow creating any marketing diagram, chart, map, matrix and text block within only a few minutes.
The Management Infographics solution is useful for managers involved in different business activities to create their own professional-looking infographics and visually explain all the needed management concepts.
-
Buy this solution $25 -
Solution Requirements - This solution requires the following products to be installed:
ConceptDraw DIAGRAM v17 - This solution requires the following products to be installed:
-
Compatibility - Monterey (12), Ventura (13), Sonoma (14)
MS Windows 8.1, 10 - Monterey (12), Ventura (13), Sonoma (14)
-
Support for this Solution -
Helpdesk
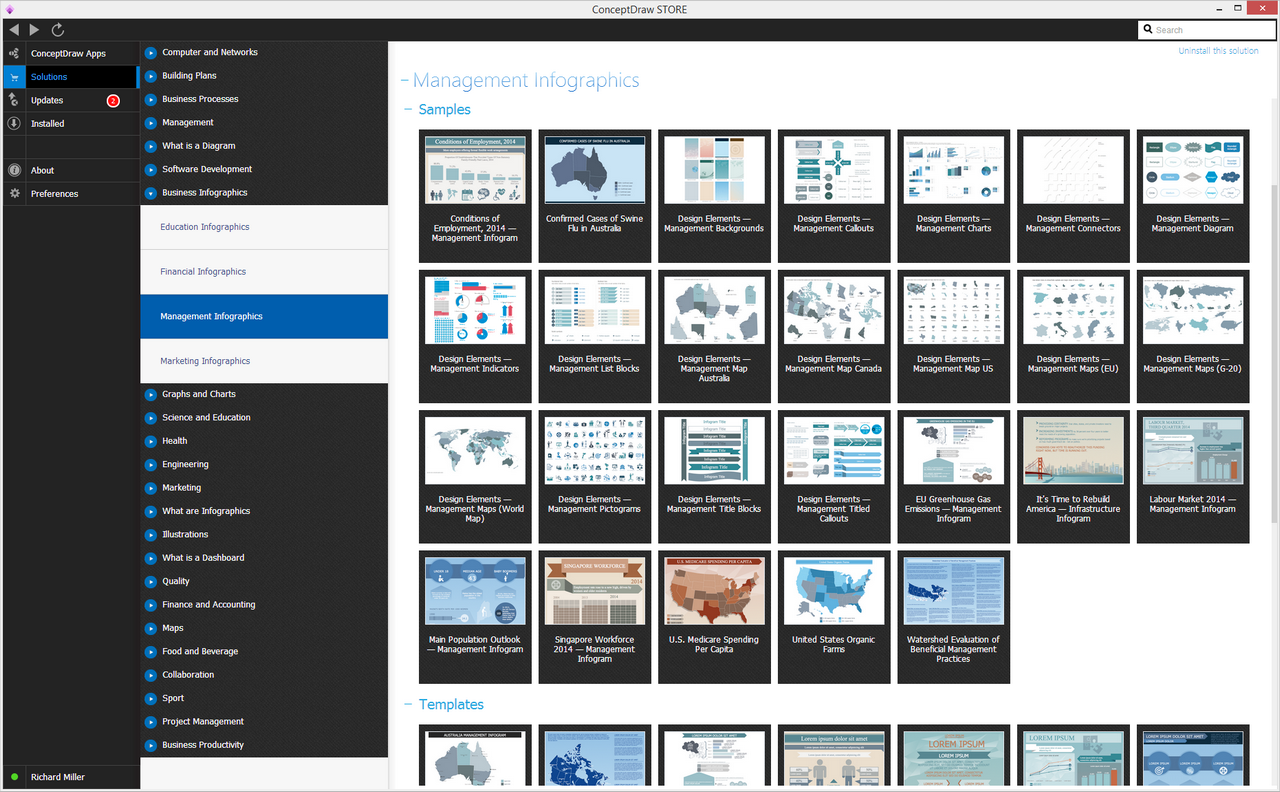
There are 14 stencil libraries containing 364 vector objects and 10 examples in the Management Infographics solution.
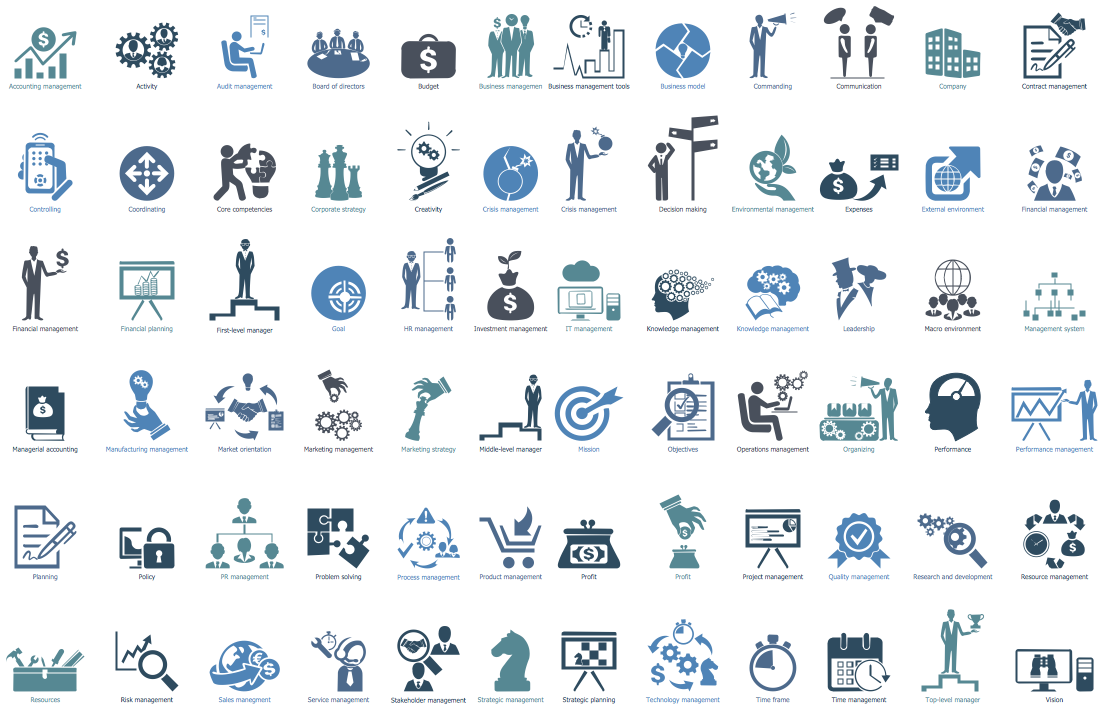
Design Elements — Management Pictograms
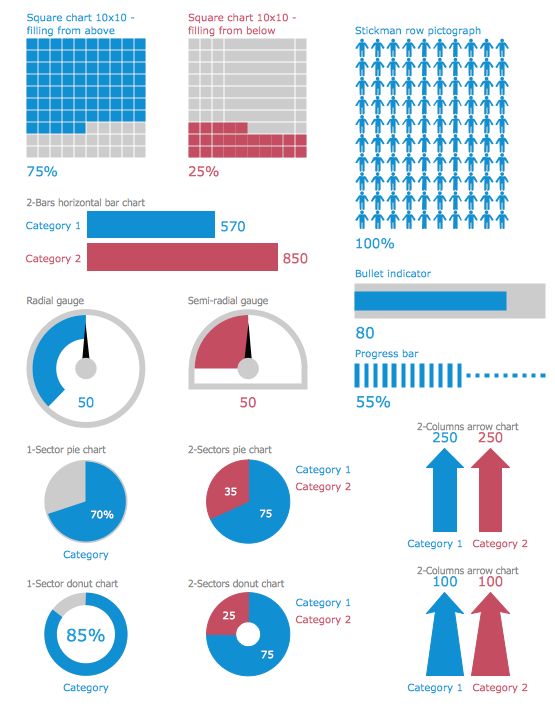
Design Elements — Management Indicators
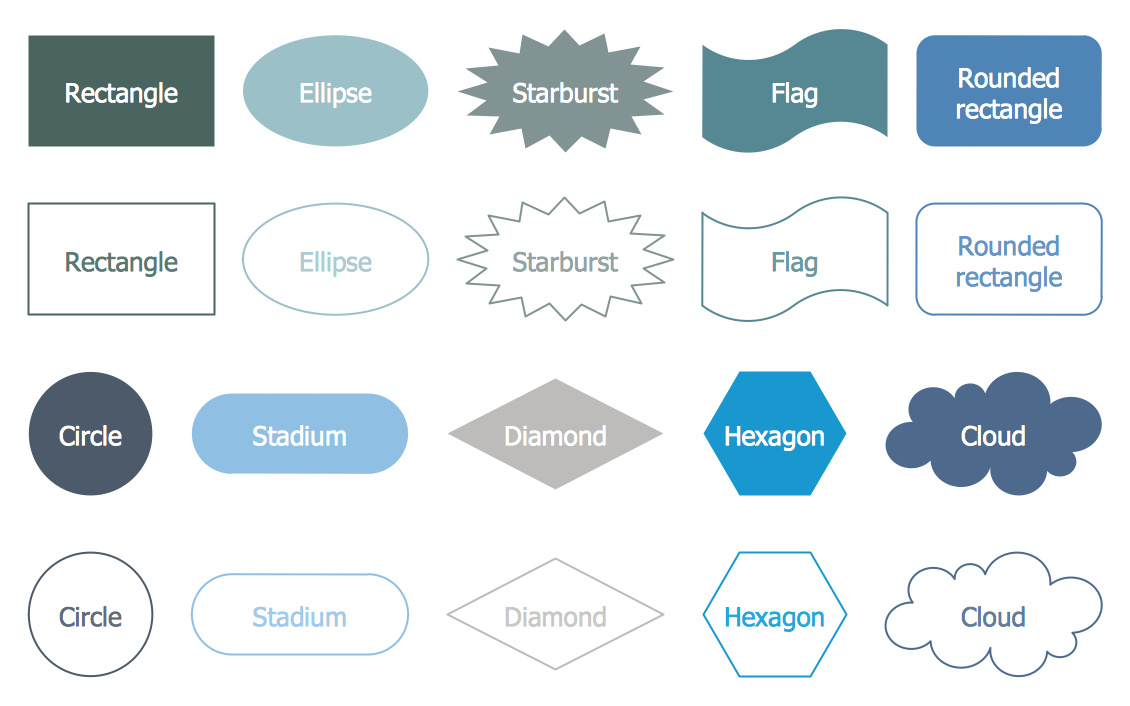
Design Elements — Management Diagram
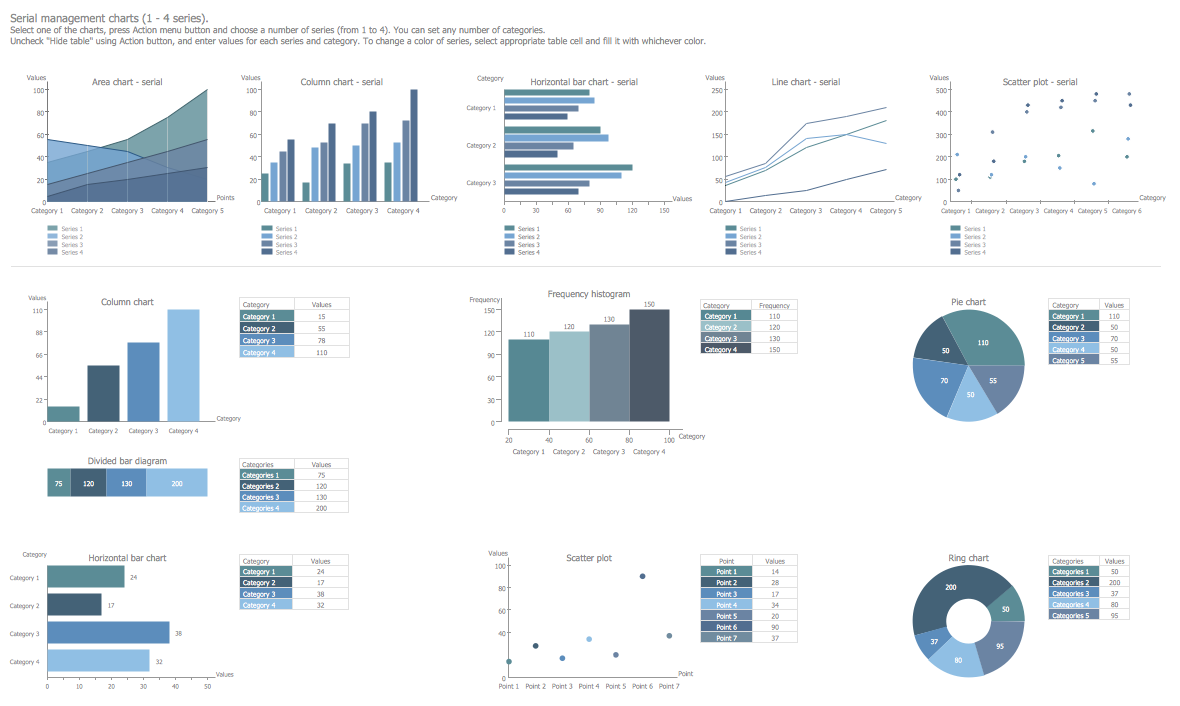
Design Elements — Management Charts
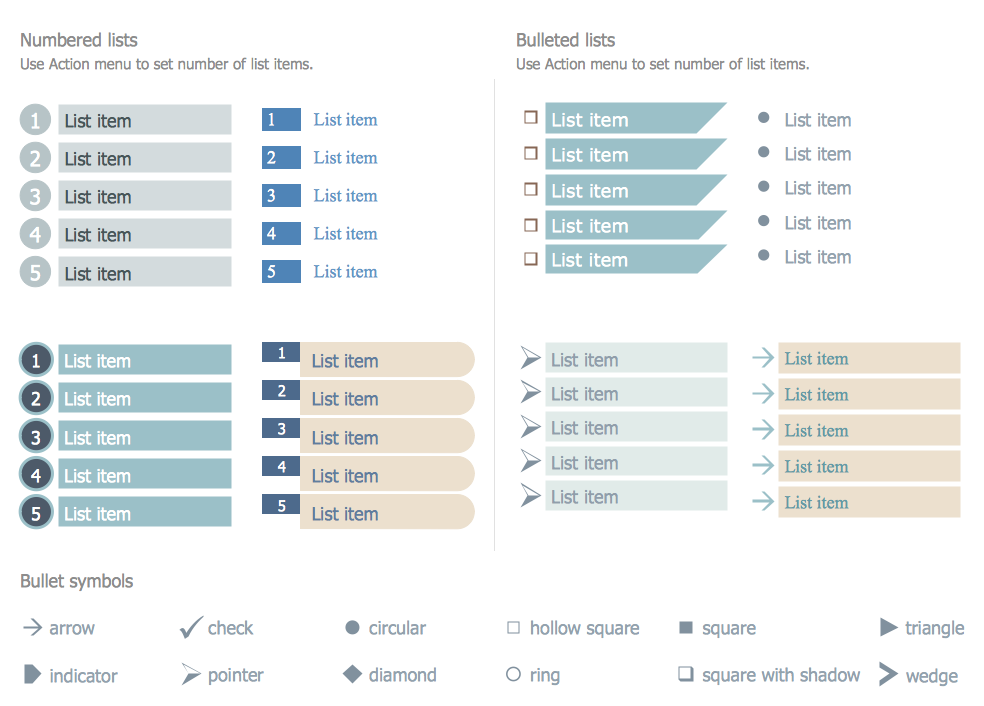
Design Elements — List Blocks
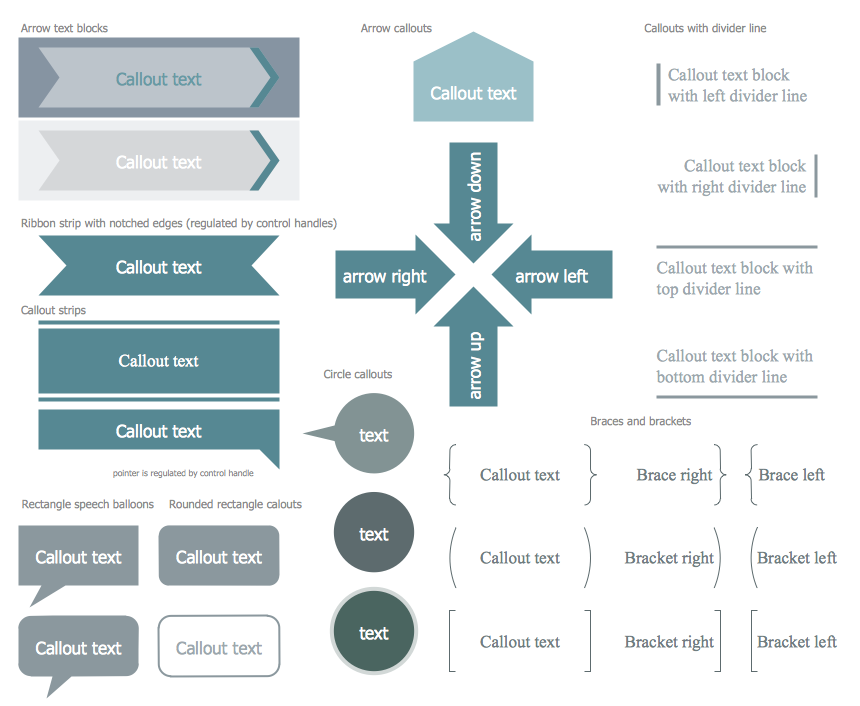
Design Elements — Callouts
Design Elements — Management Maps (World Map)

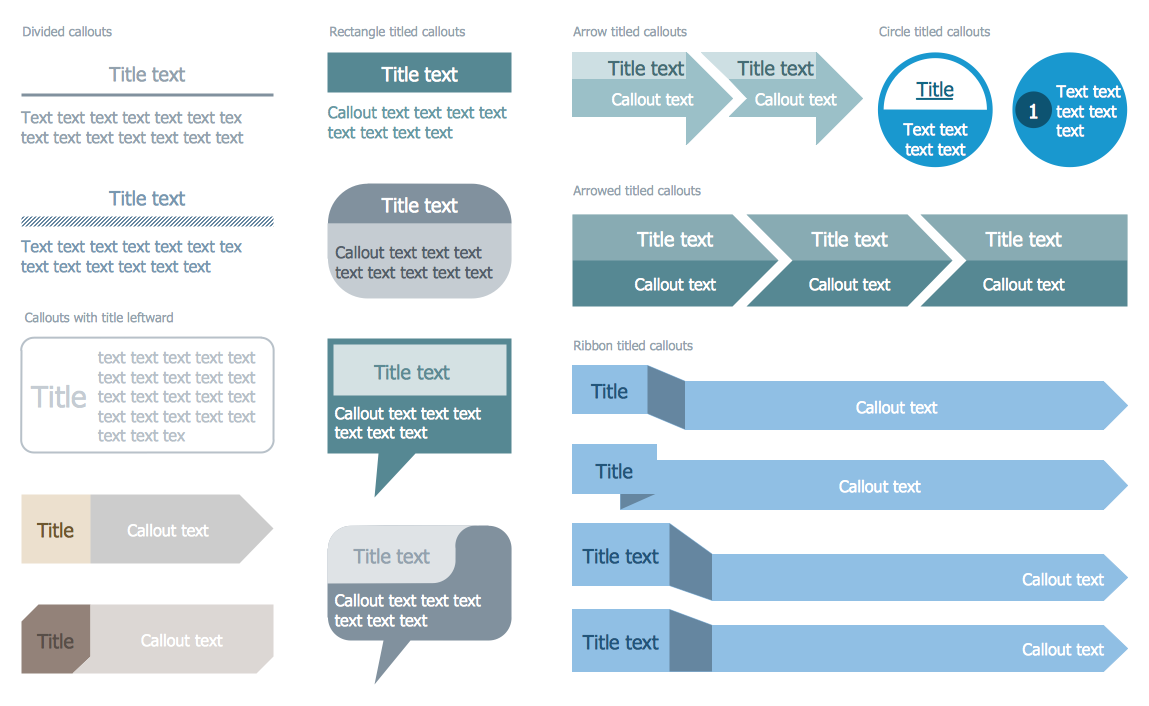
Design Elements — Titled Callouts
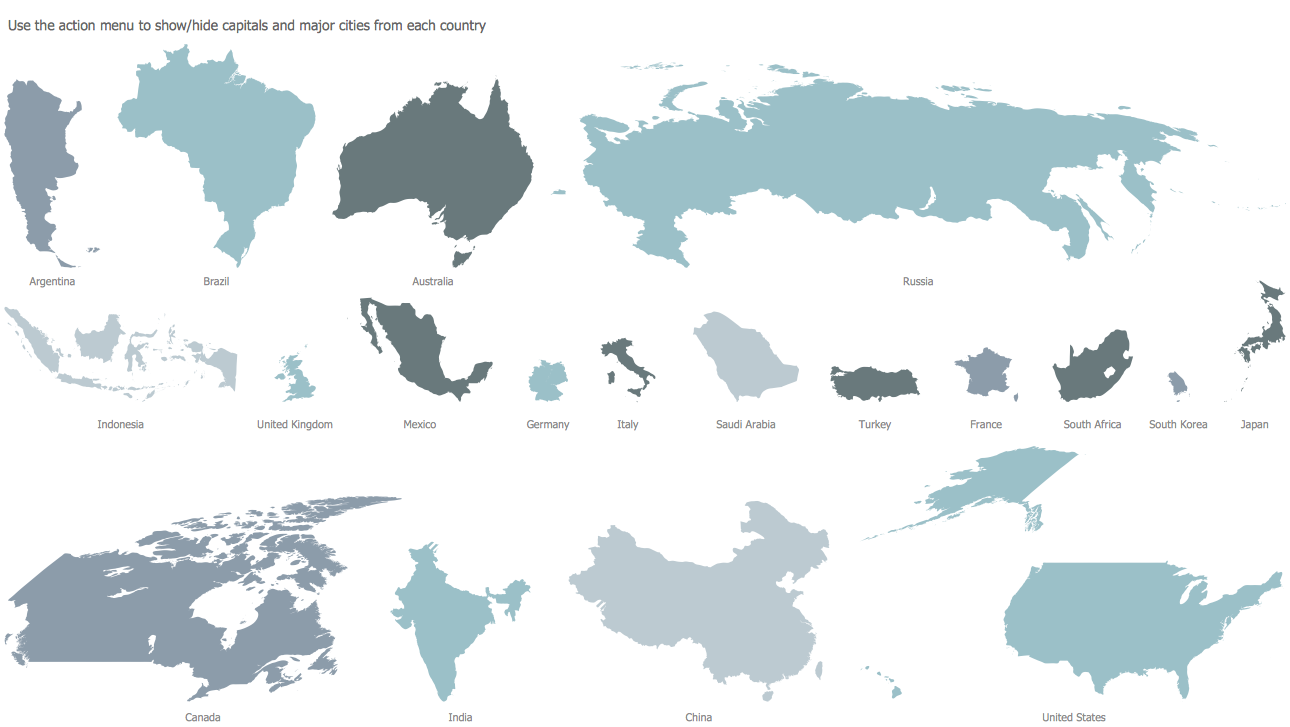
Design Elements — Maps (G20)
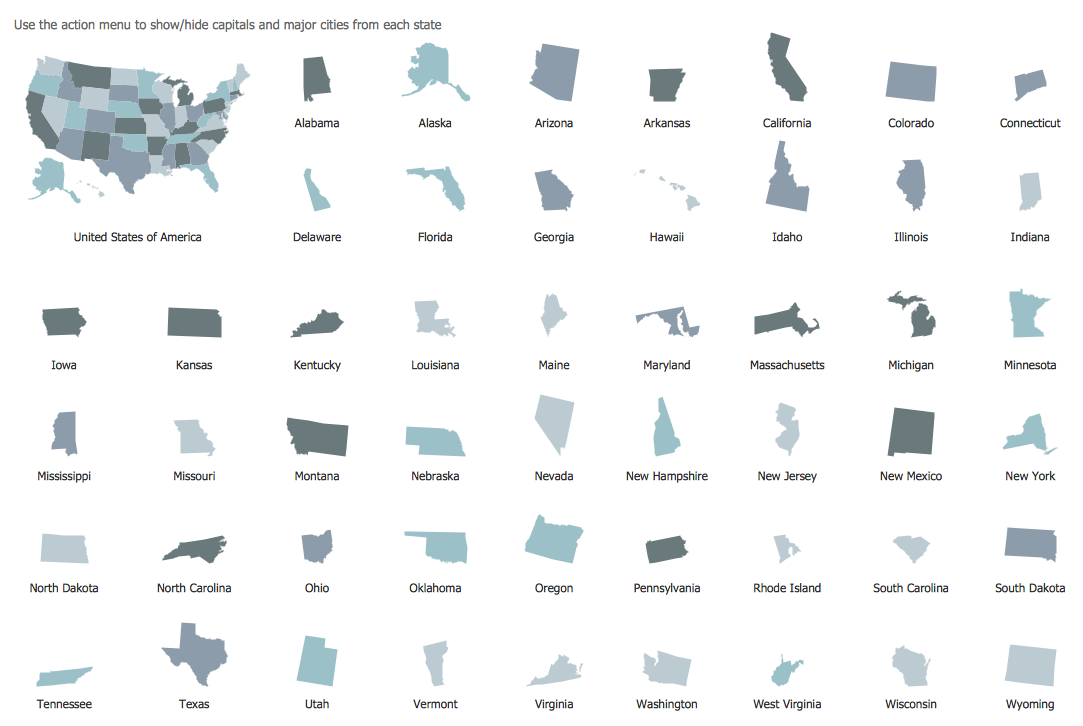
Design Elements — Map US
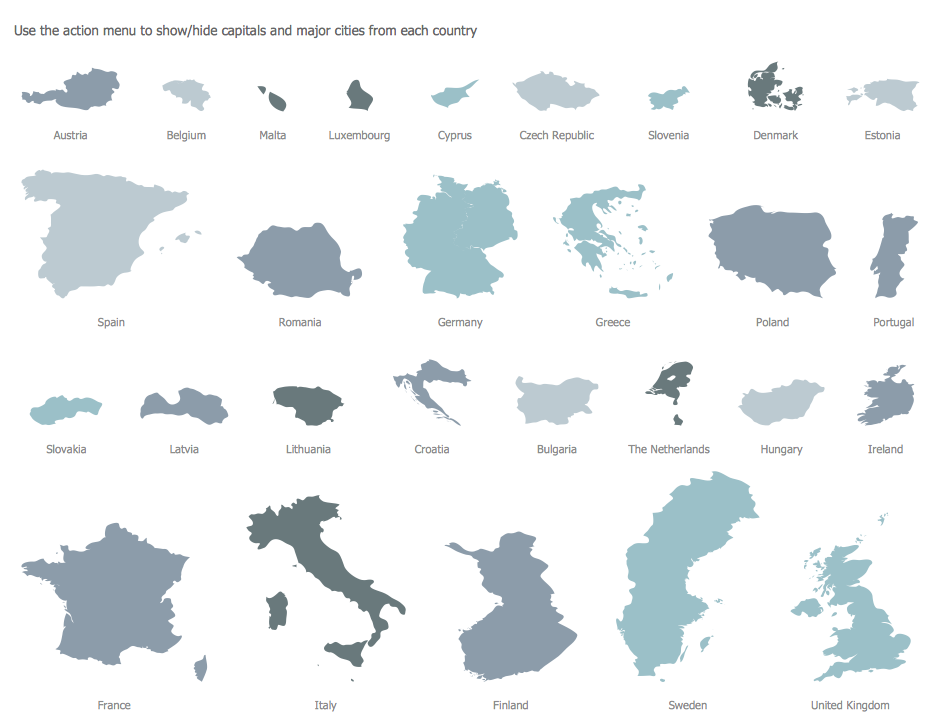
Design Elements — Maps (EU)
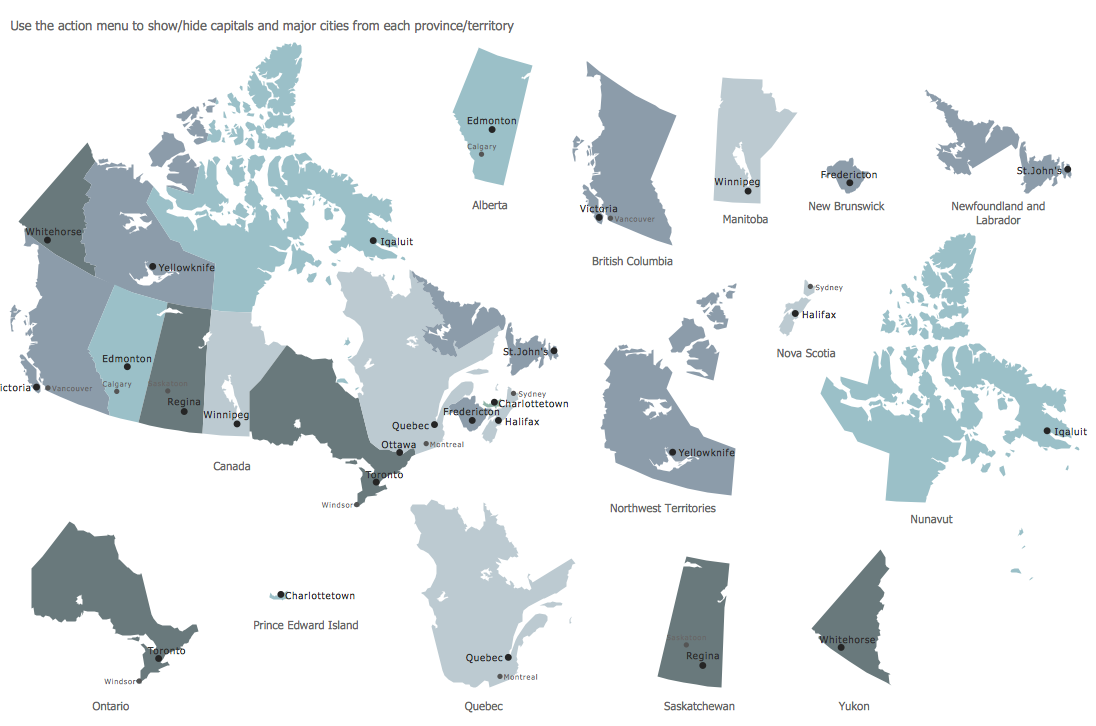
Design Elements — Map Canada
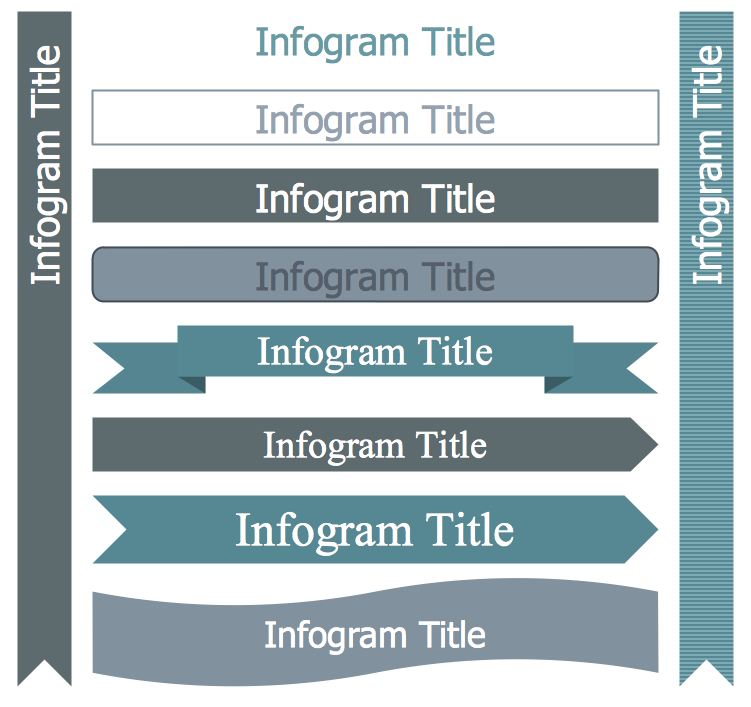
Design Elements — Title Blocks
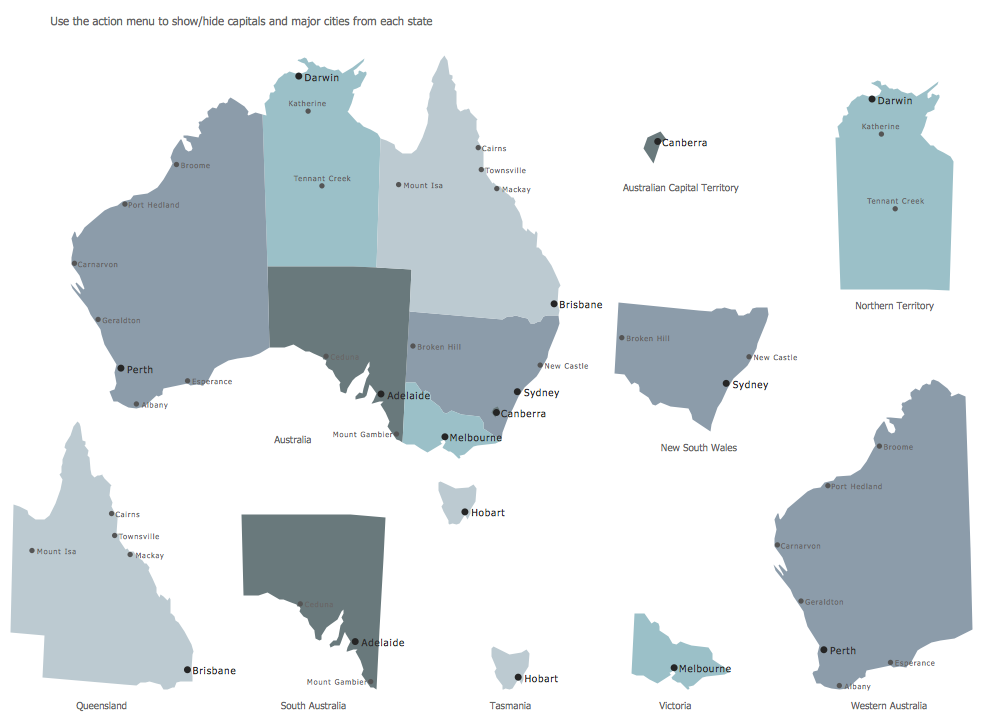
Design Elements — Map Australia
Design Elements — Management Backgrounds
Management Infographics Examples
There are a few samples that you see on this page which were created in the ConceptDraw DIAGRAM application by using the Management Infographics solution. Some of the solution's capabilities as well as the professional results which you can achieve are all demonstrated here on this page.
All source documents are vector graphic documents which are always available for modifying, reviewing and/or converting to many different formats, such as MS PowerPoint, PDF file, MS Visio, and many other graphic ones from the ConceptDraw Solution Park or ConceptDraw STORE. The Management Infographics solution is available to all ConceptDraw DIAGRAM users to get installed and used while working in the ConceptDraw DIAGRAM diagramming and drawing software.
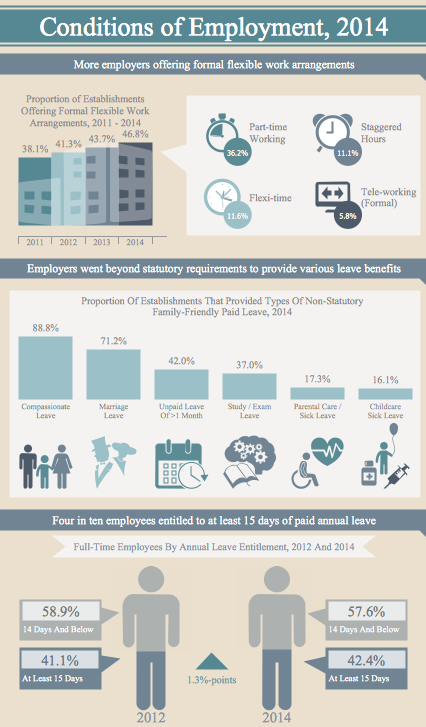
Example 1: Conditions of Employment, 2014 - Management Infogram
This diagram was created in ConceptDraw DIAGRAM using the Management Pictograms, Callouts and Titled Callouts libraries from the Management Infographics solution. An experienced user spent 15 minutes creating this sample.
Look at how much information it is possible to display using the design elements from the Management Infographics solution. The three areas of this sample highlight various workplace conditions, including flexible work arrangements, annual leave and leave benefits.
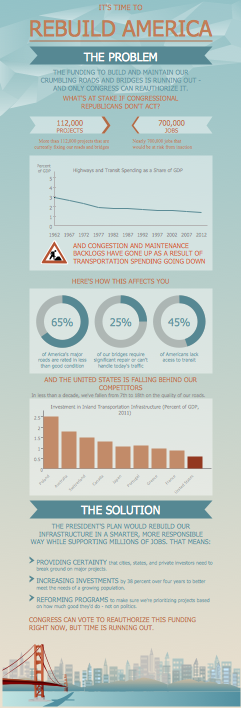
Example 2: It's Time to Rebuild America - Infrastructure Infogram
This diagram was created in ConceptDraw DIAGRAM using the Callouts, Management Indicators and Management Backgrounds libraries from the Management Infographics solution. An experienced user spent 15 minutes creating this sample.
All these infographic examples were created quickly and easily using ConceptDraw's Management Infographics solution. This sample works through a problem using a variety of techniques, including graphs, charts and supporting text.
Example 3: Labour Market 2014 — Management Infogram
This diagram was created in ConceptDraw DIAGRAM using the Callouts, Management Indicators and Management Charts libraries from the Management Infographics solution. An experienced user spent 20 minutes creating this sample.
This sample gives an overview of the ups and downs of the job market through a specific time period. Notice how clear and well integrated the various design elements are - this is the benefit of having a dedicated solution working for you as an inforgraphic generator.

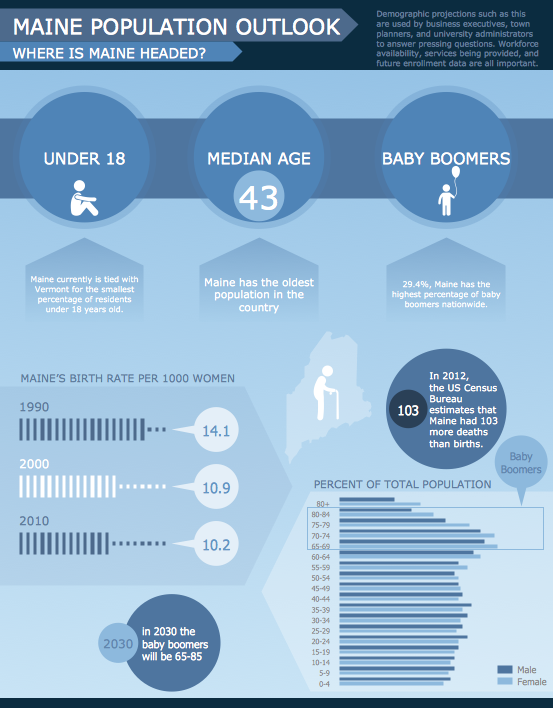
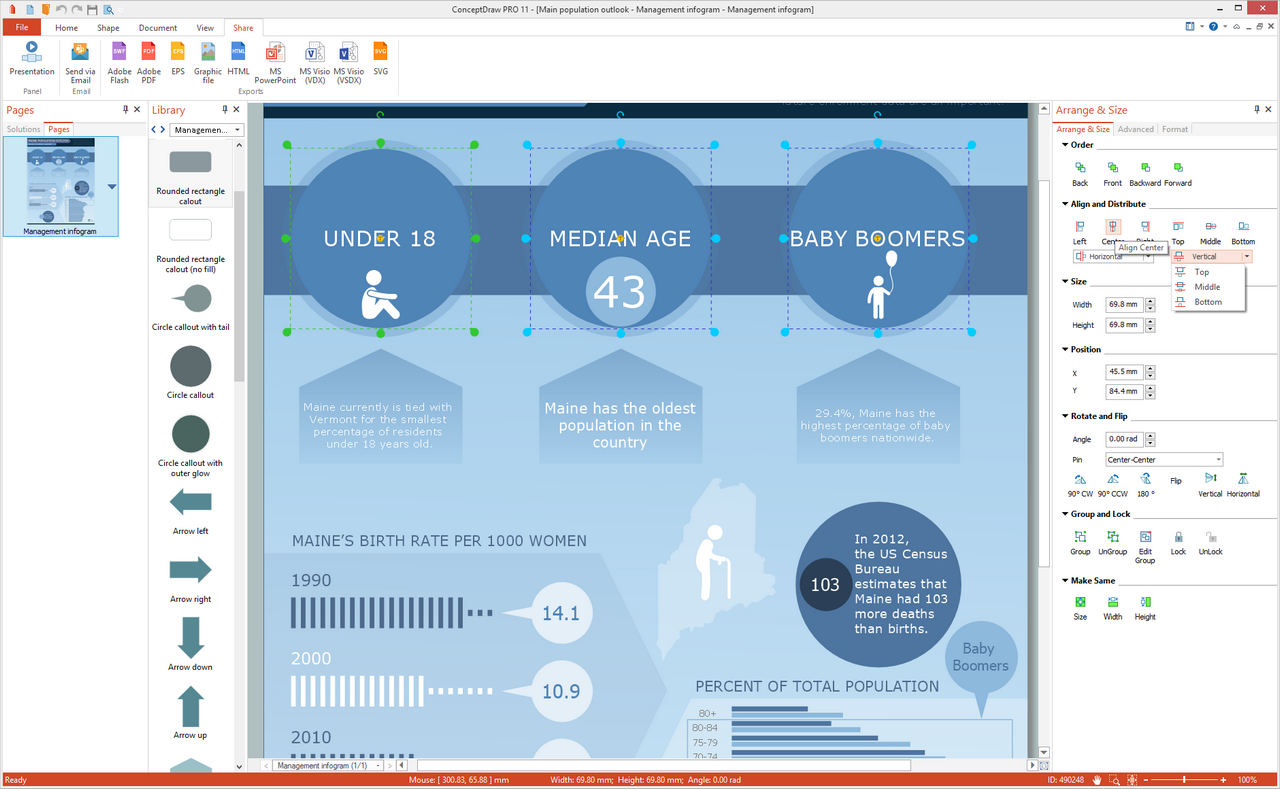
Example 4: Main Population Outlook — Management Infogram
This diagram was created in ConceptDraw DIAGRAM using the Management Pictograms, Management Charts and Maps libraries from the Management Infographics solution. An experienced user spent 20 minutes creating this sample.
Ever wondered how the population of Maine is faring? Even the most obscure subjects are catered for when using solutions from ConceptDraw. The Management Infographics solution contains maps and other images to give your design context.
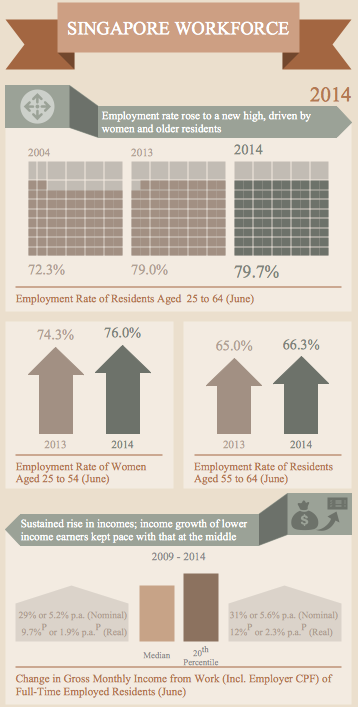
Example 5: Singapore Workforce 2014 — Management Infogram
This diagram was created in ConceptDraw DIAGRAM using the Callouts and Management Indicators libraries from the Management Infographics solution. An experienced user spent 10 minutes creating this sample.
The Management Inforgraphic solution means you don't have to be an artist to create simple, effective infographics examples in a matter of moments. If you need to display stats, figures or any other info, our solutions will give you a way to make it possible.
Example 6: EU Greenhouse Gas Emissions — Management Infogram
This diagram was created in ConceptDraw DIAGRAM using the Callouts, Management Pictograms and Management Indicators libraries from the Management Infographics solution. An experienced user spent 15 minutes creating this sample.
If you have a lot of information to display, it is easy to make this informative and understandable using the icons and images from the Management Infographics solution. This example breaks down greenhouse gas emissions into sub-topics including source of emissions and which countries emit the most or least.

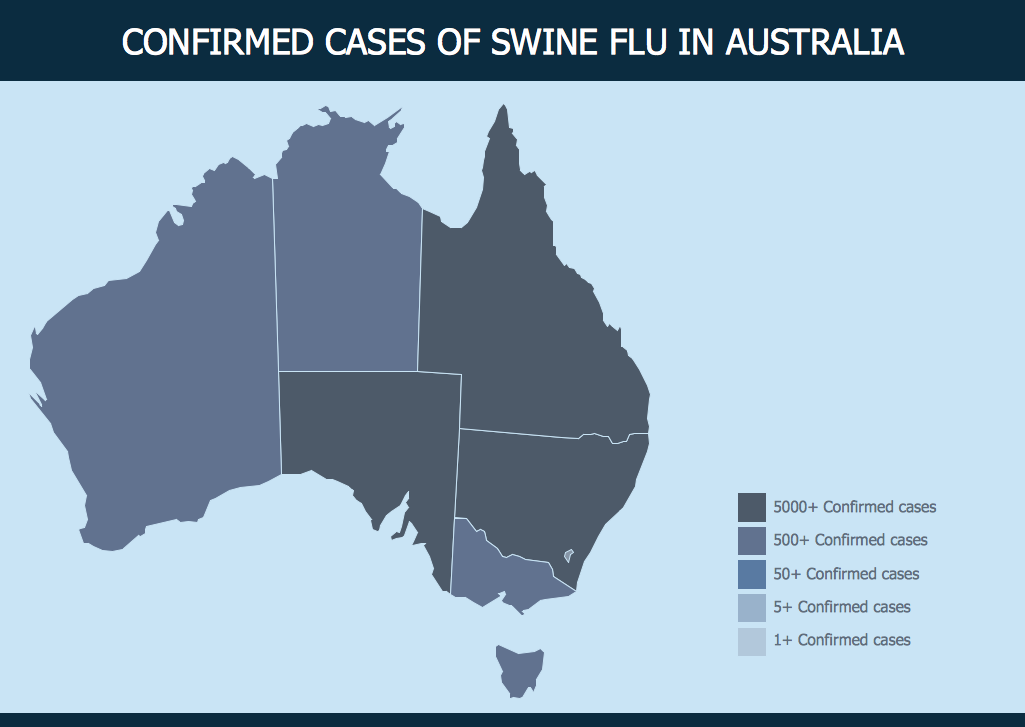
Example 7: Confirmed Cases of Swine Flu in Australia
This diagram was created in ConceptDraw DIAGRAM using the List Blocks and Map Australia libraries from the Management Infographics solution. An experienced user spent 5 minutes creating this sample.
This sample shows the spread of swine flu throughout Australia. Using the large collection of maps found in the libraries of the Management Infographics solution, you can create infographics featuring almost any geographical region.
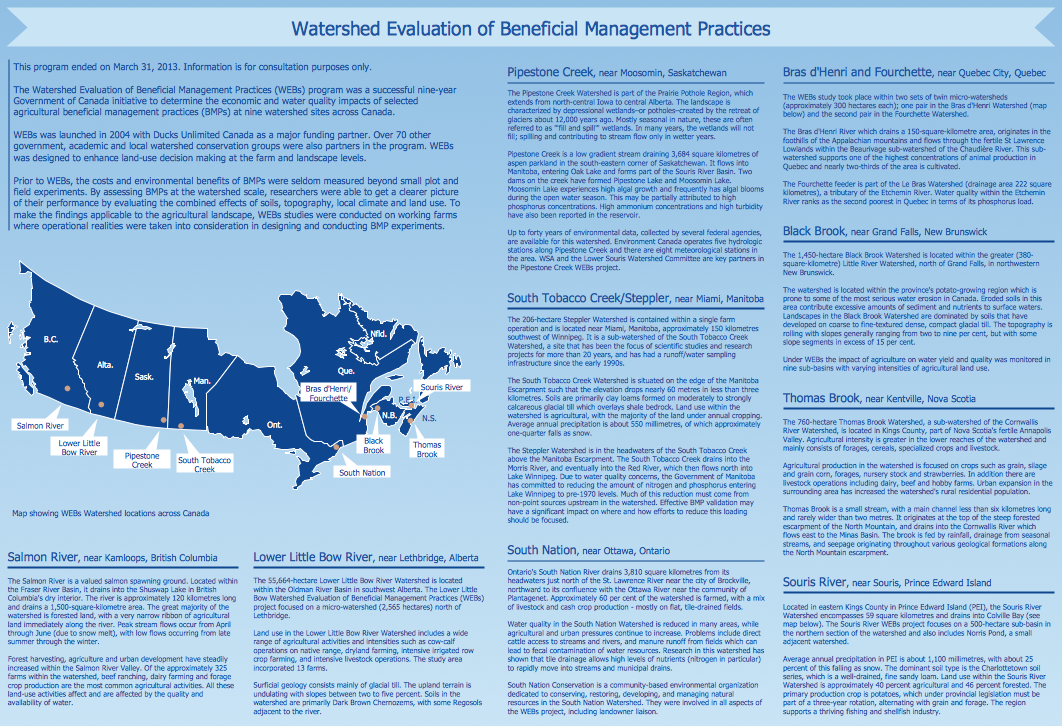
Example 8: Watershed Evaluation of Beneficial Management Practices
This diagram was created in ConceptDraw DIAGRAM using the Map Canada library from the Management Infographics solution. An experienced user spent 20 minutes creating this sample.
Your infographics can be used to convey all kinds of information; in this case the results of a study into the management practices of the watersheds throughout Canada. If you are a management consultant who needs to produce daily infographics, the Management Infographics solution is just the tool you need.
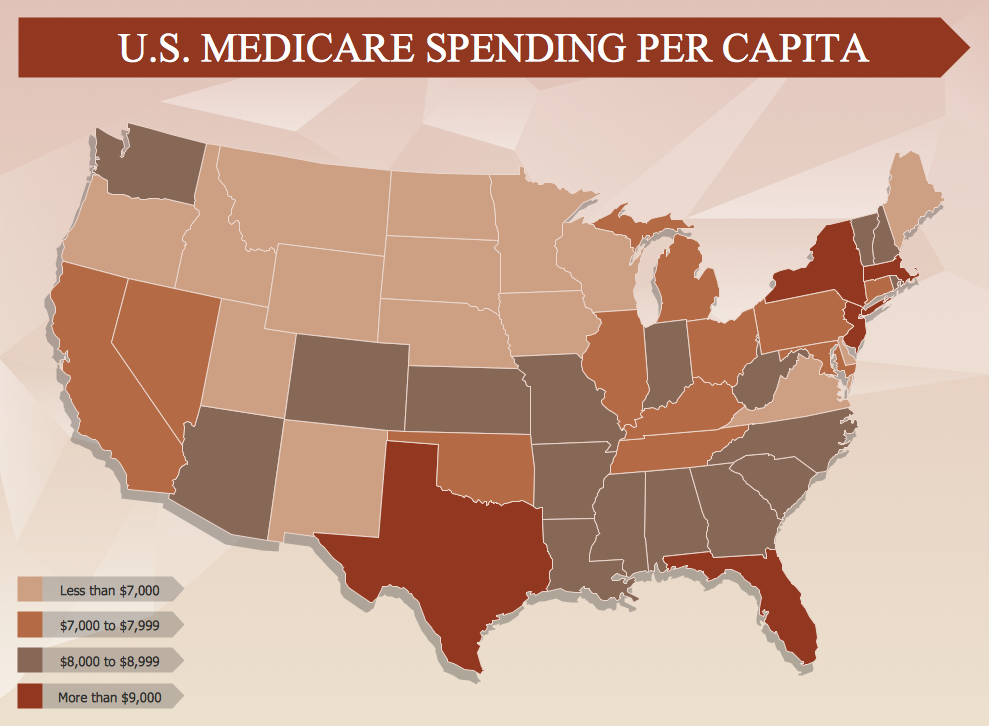
Example 9: U.S. Medicare Spending Per Capita
This diagram was created in ConceptDraw DIAGRAM using the List Blocks and Map US libraries from the Management Infographics solution. An experienced user spent 5 minutes creating this sample.
Medicare is a hot topic in the United States at the moment, and this sample shows how much each state spends on it. This solution acts as an infographics generator, allowing you to create simple and effective management infographics.
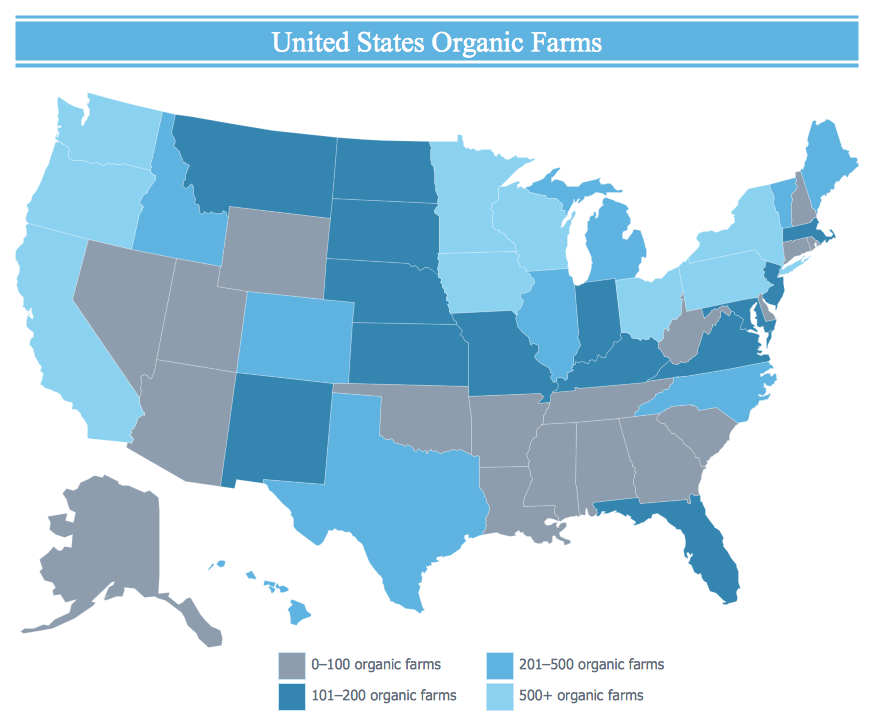
Example 10: United States Organic Farms
This diagram was created in ConceptDraw DIAGRAM using the List Blocks and Map US libraries from the Management Infographics solution. An experienced user spent 5 minutes creating this sample.
In recent times, many people have become more aware of ethical practices in farming and food production. This infographic shows which U.S. states are leading the way. Designs like this are quick and easy to create using the Management Infographics solution.
Inside
What I Need to Get Started
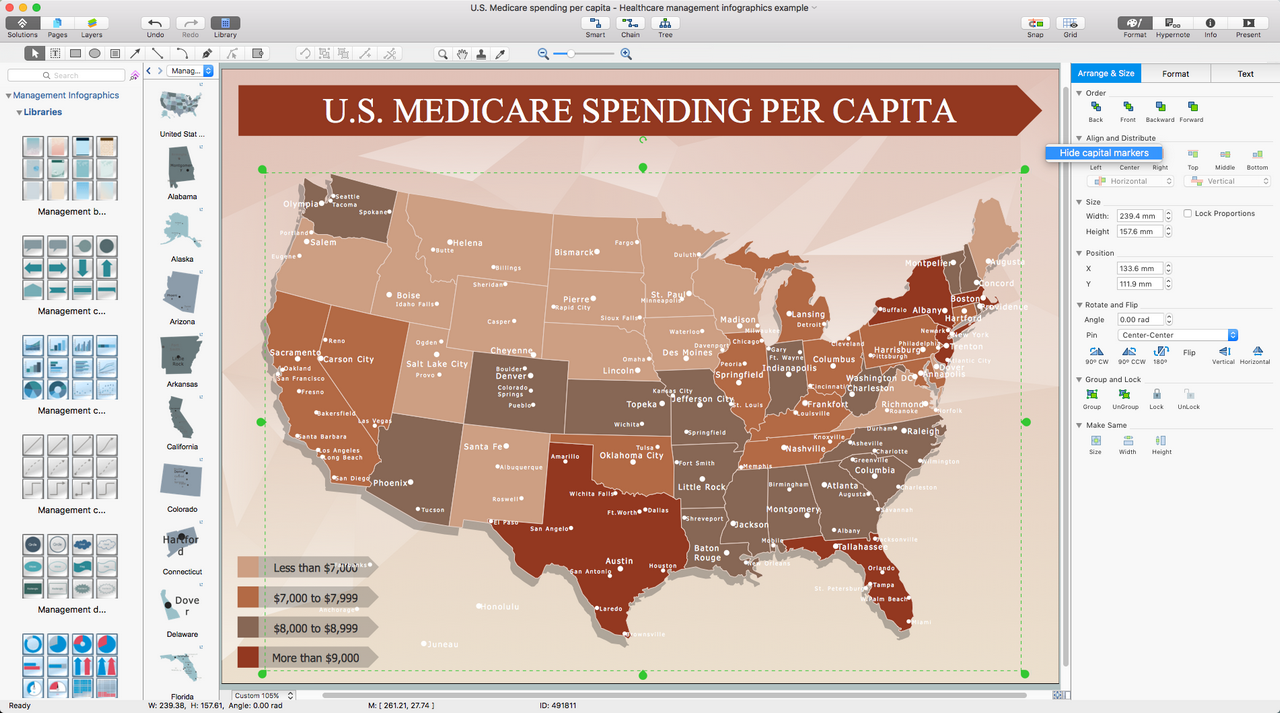
After ConceptDraw DIAGRAM is installed, the Management Infographics solution can be purchased either from the Business Infographics area of ConceptDraw STORE itself or from our online store. Thus, you will be able to use the Management Infographics solution straight after.
How to install
First of all, make sure that both ConceptDraw STORE and ConceptDraw DIAGRAM applications are downloaded and installed on your computer. Next, install the Management Infographics solution from the ConceptDraw STORE to use it in the ConceptDraw DIAGRAM application.
Start using
Start using the Management Infographics solution to make the professionally looking illustrations by adding the design elements taken from the stencil libraries and editing the pre-made examples that can be found there.
What are Business Infographics?
Infographics, in one form or another, have been around for many years. They are used by businesses, media, government or brands to convey information, data or knowledge in a visual manner. The basic premise of an infographic is as follows:
- Condense large amounts of information into an easily absorbable form
- Display data and information through use of visual elements
- Combine these elements to present an overriding message or insight
Two common examples of an infographic that you might see most days are a subway map, or the T.V. weather report. Both use graphical elements to represent things such as weather patterns and rail lines, and have an explicit, functional message they need to convey. They follow the archetype structure of the infographic, made up of three parts — the visual, the content, and the knowledge.
Visual
This covers the colours and graphics used on an infographic. Graphics can either represent specific pieces of data (theme graphics), or point towards particular areas of information (reference graphics).
Content
All the information you need to convey the main message. Facts, figures, and statistical breakdowns.
Knowledge
This is the message you want to convey to the reader. In the two examples previously mentioned, this would be informing viewers of the coming weather forecast, and instruct commuters on how to reach their destination.
Infographics have become ubiquitous with modern day communication. This can be understood as the internet and social media providing a great platform for a communication method that shows information quickly and simply in a visual manner; and also as a necessity due to a trend towards a lower attention span from internet users.
It is no surprise that this effective form of communication is used in all forms of business, for a variety of tasks. An infographic is suitable for whenever you need to convey data or a corporate message to the workforce.
A sales team might want to show their performance over a certain time period, with a breakdown of different products/divisions/locations. Charts, graphs, and other indicators can be used to display corporate data and statistics, and split information into clearly defined sub-sections.

Management might want to communicate a basic workflow for each division of the company, visualise business strategy and decision processes, or display a certain business training concept. In this case, an infographic can be more text heavy, and use illustrations to establish a timeline, process, or step-by-step sequence of events.

The marketing side of a business can use infographics to relay information and marketing strategies internally amongst the workforce, or as a tool to educate consumers about the business model or product.
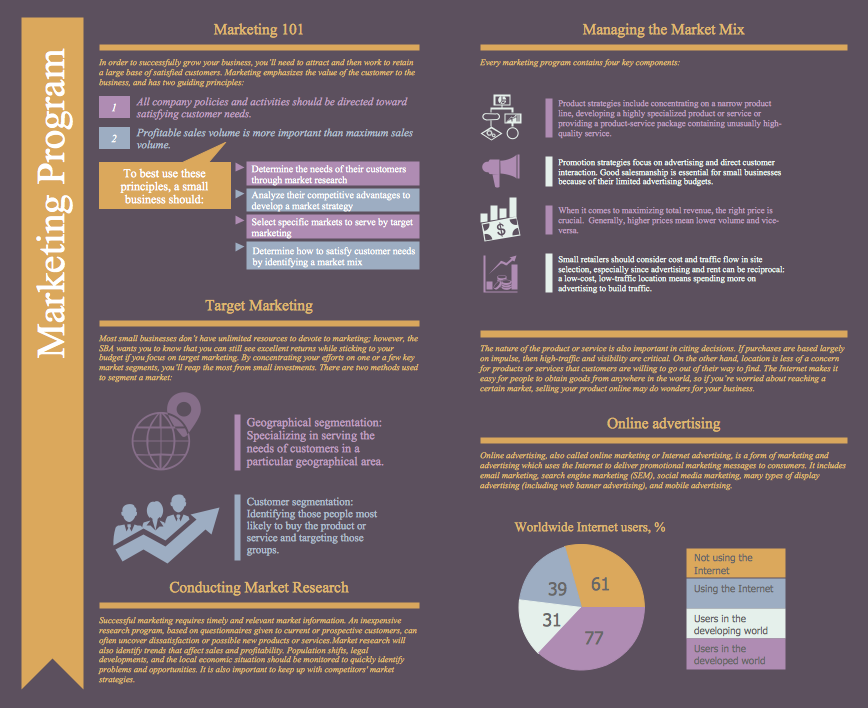
The benefits of using such a visual method to convey your business ideas are tied to what we know about human behaviour when learning or processing new information. The majority of people are termed as 'visual learners' — so infographics have a broader influence than other methods of communication. Vision is our dominant sense; we process images faster than text, and can much more easily retain information that is accompanied by a visual cue. So a well designed infographic has the power to be more persuasive and striking than a simple block of text. They are user friendly to design — large amounts of information can be divided and shown in a clean, effective manner. Graphics and icons are eye catching, and easy to understand without the need for too much context.