- Electric and Telecom Plans Free
- Fire and Emergency Plans Free
- Floor Plans Free
- Plant Layout Plans Free
- School and Training Plans Free
- Seating Plans Free
- Security and Access Plans Free
- Site Plans Free
- Sport Field Plans Free
- Business Process Diagrams Free
- Business Process Mapping Free
- Classic Business Process Modeling Free
- Cross-Functional Flowcharts Free
- Event-driven Process Chain Diagrams Free
- IDEF Business Process Diagrams Free
- Logistics Flow Charts Free
- Workflow Diagrams Free
- ConceptDraw Dashboard for Facebook Free
- Mind Map Exchange Free
- MindTweet Free
- Note Exchange Free
- Project Exchange Free
- Social Media Response Free
- Active Directory Diagrams Free
- AWS Architecture Diagrams Free
- Azure Architecture Free
- Cisco Network Diagrams Free
- Cisco Networking Free
- Cloud Computing Diagrams Free
- Computer Network Diagrams Free
- Google Cloud Platform Free
- Interactive Voice Response Diagrams Free
- Network Layout Floor Plans Free
- Network Security Diagrams Free
- Rack Diagrams Free
- Telecommunication Network Diagrams Free
- Vehicular Networking Free
- Wireless Networks Free
- Comparison Dashboard Free
- Composition Dashboard Free
- Correlation Dashboard Free
- Frequency Distribution Dashboard Free
- Meter Dashboard Free
- Spatial Dashboard Free
- Status Dashboard Free
- Time Series Dashboard Free
- Basic Circle-Spoke Diagrams Free
- Basic Circular Arrows Diagrams Free
- Basic Venn Diagrams Free
- Block Diagrams Free
- Concept Maps Free
- Family Tree Free
- Flowcharts Free
- Basic Area Charts Free
- Basic Bar Graphs Free
- Basic Divided Bar Diagrams Free
- Basic Histograms Free
- Basic Line Graphs Free
- Basic Picture Graphs Free
- Basic Pie Charts Free
- Basic Scatter Diagrams Free
- Aerospace and Transport Free
- Artwork Free
- Audio, Video, Media Free
- Business and Finance Free
- Computers and Communications Free
- Holiday Free
- Manufacturing and Maintenance Free
- Nature Free
- People Free
- Presentation Clipart Free
- Safety and Security Free
- Analog Electronics Free
- Audio and Video Connectors Free
- Basic Circuit Diagrams Free
- Chemical and Process Engineering Free
- Digital Electronics Free
- Electrical Engineering Free
- Electron Tube Circuits Free
- Electronic Block Diagrams Free
- Fault Tree Analysis Diagrams Free
- GHS Hazard Pictograms Free
- Home Automation and Wiring Free
- Mechanical Engineering Free
- One-line Diagrams Free
- Power Сircuits Free
- Specification and Description Language (SDL) Free
- Telecom and AV Circuits Free
- Transport Hazard Pictograms Free
- Data-driven Infographics Free
- Pictorial Infographics Free
- Spatial Infographics Free
- Typography Infographics Free
- Calendars Free
- Decision Making Free
- Enterprise Architecture Diagrams Free
- Fishbone Diagrams Free
- Organizational Charts Free
- Plan-Do-Check-Act (PDCA) Free
- Seven Management and Planning Tools Free
- SWOT and TOWS Matrix Diagrams Free
- Timeline Diagrams Free
- Australia Map Free
- Continent Maps Free
- Directional Maps Free
- Germany Map Free
- Metro Map Free
- UK Map Free
- USA Maps Free
- Customer Journey Mapping Free
- Marketing Diagrams Free
- Matrices Free
- Pyramid Diagrams Free
- Sales Dashboard Free
- Sales Flowcharts Free
- Target and Circular Diagrams Free
- Cash Flow Reports Free
- Current Activities Reports Free
- Custom Excel Report Free
- Knowledge Reports Free
- MINDMAP Reports Free
- Overview Reports Free
- PM Agile Free
- PM Dashboards Free
- PM Docs Free
- PM Easy Free
- PM Meetings Free
- PM Planning Free
- PM Presentations Free
- PM Response Free
- Resource Usage Reports Free
- Visual Reports Free
- House of Quality Free
- Quality Mind Map Free
- Total Quality Management TQM Diagrams Free
- Value Stream Mapping Free
- Astronomy Free
- Biology Free
- Chemistry Free
- Language Learning Free
- Mathematics Free
- Physics Free
- Piano Sheet Music Free
- Android User Interface Free
- Class Hierarchy Tree Free
- Data Flow Diagrams (DFD) Free
- DOM Tree Free
- Entity-Relationship Diagram (ERD) Free
- EXPRESS-G data Modeling Diagram Free
- IDEF0 Diagrams Free
- iPhone User Interface Free
- Jackson Structured Programming (JSP) Diagrams Free
- macOS User Interface Free
- Object-Role Modeling (ORM) Diagrams Free
- Rapid UML Free
- SYSML Free
- Website Wireframe Free
- Windows 10 User Interface Free
Venn Diagrams
A Venn diagram is a schematic diagram (special case of Euler diagram) which depicts a finite collection of the sets and all their possible mathematical and logical relations, their unions and intersections. Venn diagrams are constructed on the plane as the set of overlapping simple closed curves, commonly these are the circles. Points that lie inside different areas of the diagram represent the elements of the respective sets which are usually denoted with capital letters of the Latin alphabet. The circles are in a specific position relatively each to other, in the most cases there is an intersection. The overlapping areas are visually highlighted on the chart, usually using a hatch pattern or a bright color.
Venn Diagrams are actively used to illustrate simple set relationships in set theory and probability theory, logic and statistics, mathematics and computer science, linguistics, sociology, and marketing. Venn Diagrams are also often used to visually summarize the status and future viability of a project.
The Venn Diagrams solution extends ConceptDraw DIAGRAM with Venn diagram maker capabilities, templates, Venn diagram examples, samples, and library with variety of predesigned Venn diagrams vector shapes offered with different quantity of sets and in various color palettes.
-
Buy this solution $25 -
Solution Requirements - This solution requires the following products to be installed:
ConceptDraw DIAGRAM v18 - This solution requires the following products to be installed:
-
Compatibility - Sonoma (14), Sonoma (15)
MS Windows 10, 11 - Sonoma (14), Sonoma (15)
-
Support for this Solution -
Helpdesk
There is 1 library containing 12 vector objects in the Venn Diagrams solution.
Design Elements — Venn Diagrams

Examples
There are a few samples that you see on this page which were created in the ConceptDraw DIAGRAM application by using the Venn Diagrams solution. Some of the solution's capabilities as well as the professional results which you can achieve are all demonstrated here on this page.
All source documents are vector graphic documents which are always available for modifying, reviewing and/or converting to many different formats, such as MS PowerPoint, PDF file, MS Visio, and many other graphic ones from the ConceptDraw Solution Park or ConceptDraw STORE. The Venn Diagrams solution is available to all ConceptDraw DIAGRAM users to get installed and used while working in the ConceptDraw DIAGRAM diagramming and drawing software.
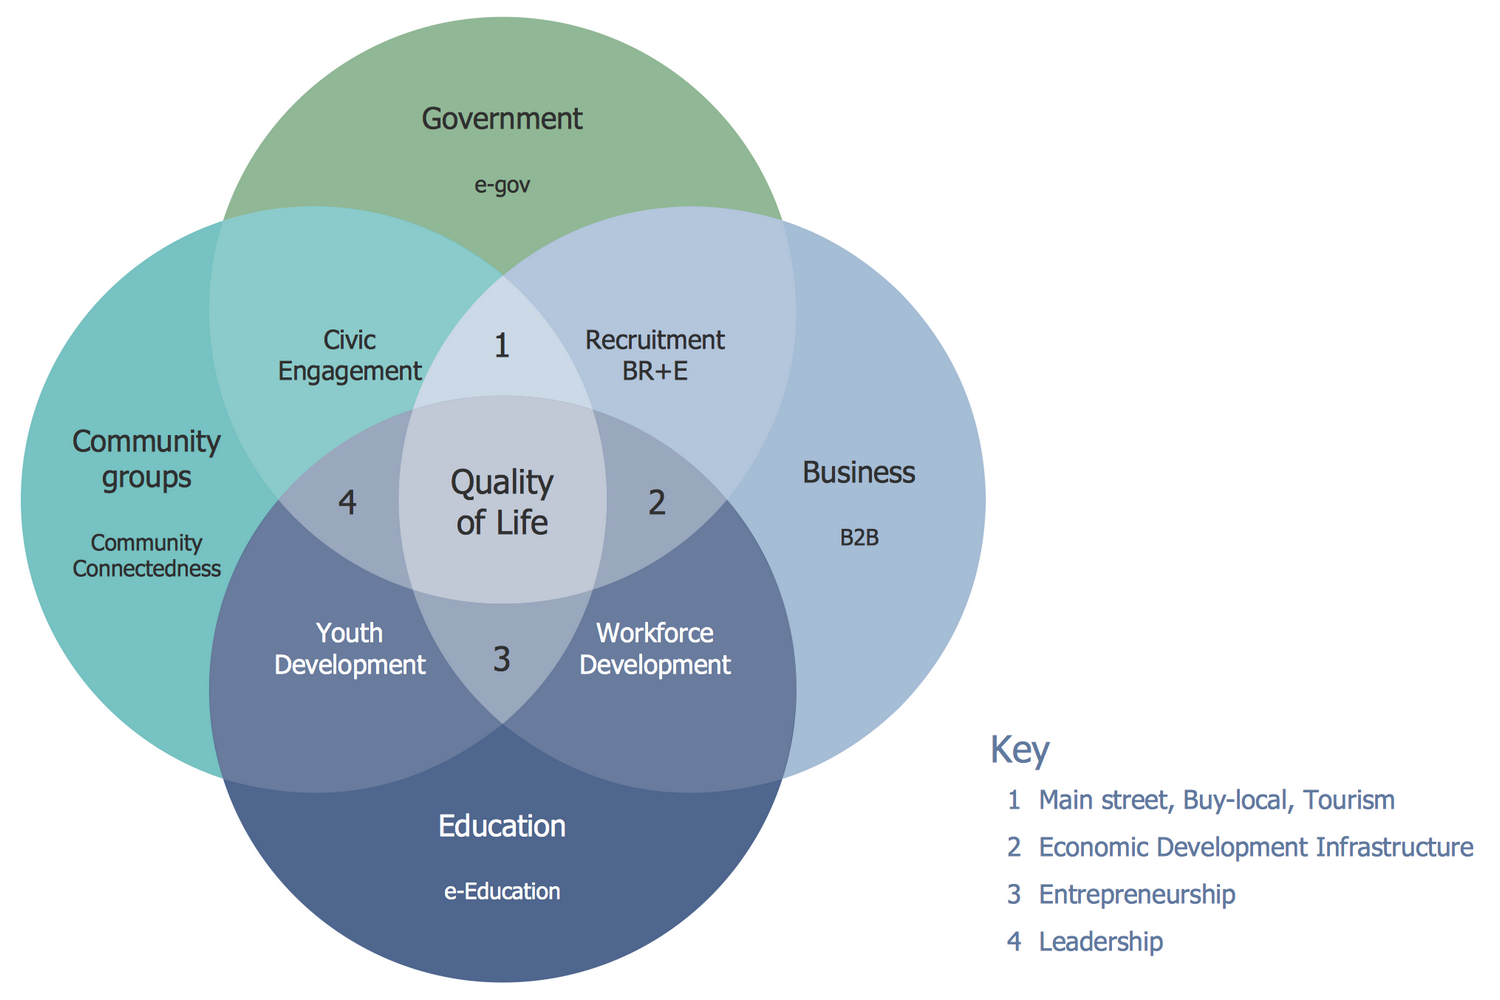
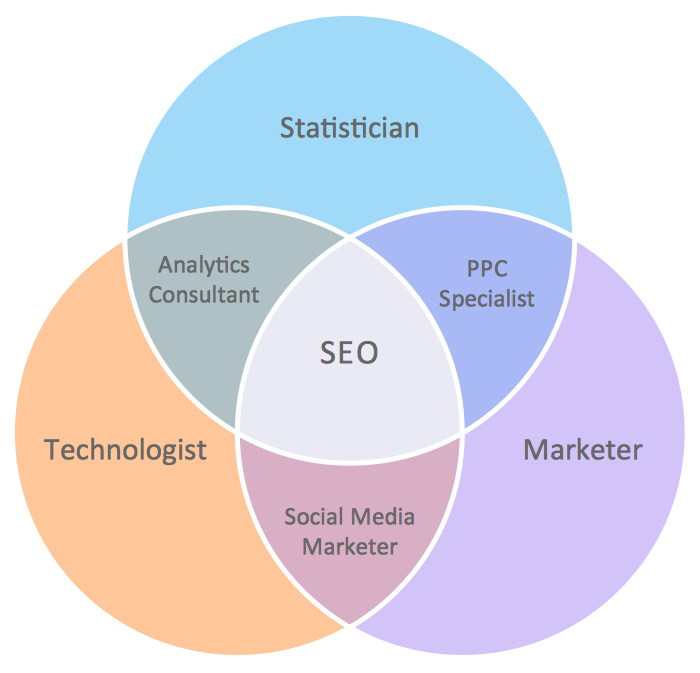
Example 1: Venn Diagram — Internet Marketing Professions
This diagram was created in ConceptDraw DIAGRAM using the Venn Diagrams Library from the Venn Diagrams Solution. An experienced user spent 5 minutes creating this sample.
This Venn Diagram shows the names of the professions that have important skill intersections for internet marketing. The Venn Diagrams are widely used because it is convenient tool to visualize all possible logical intersections between several sets.

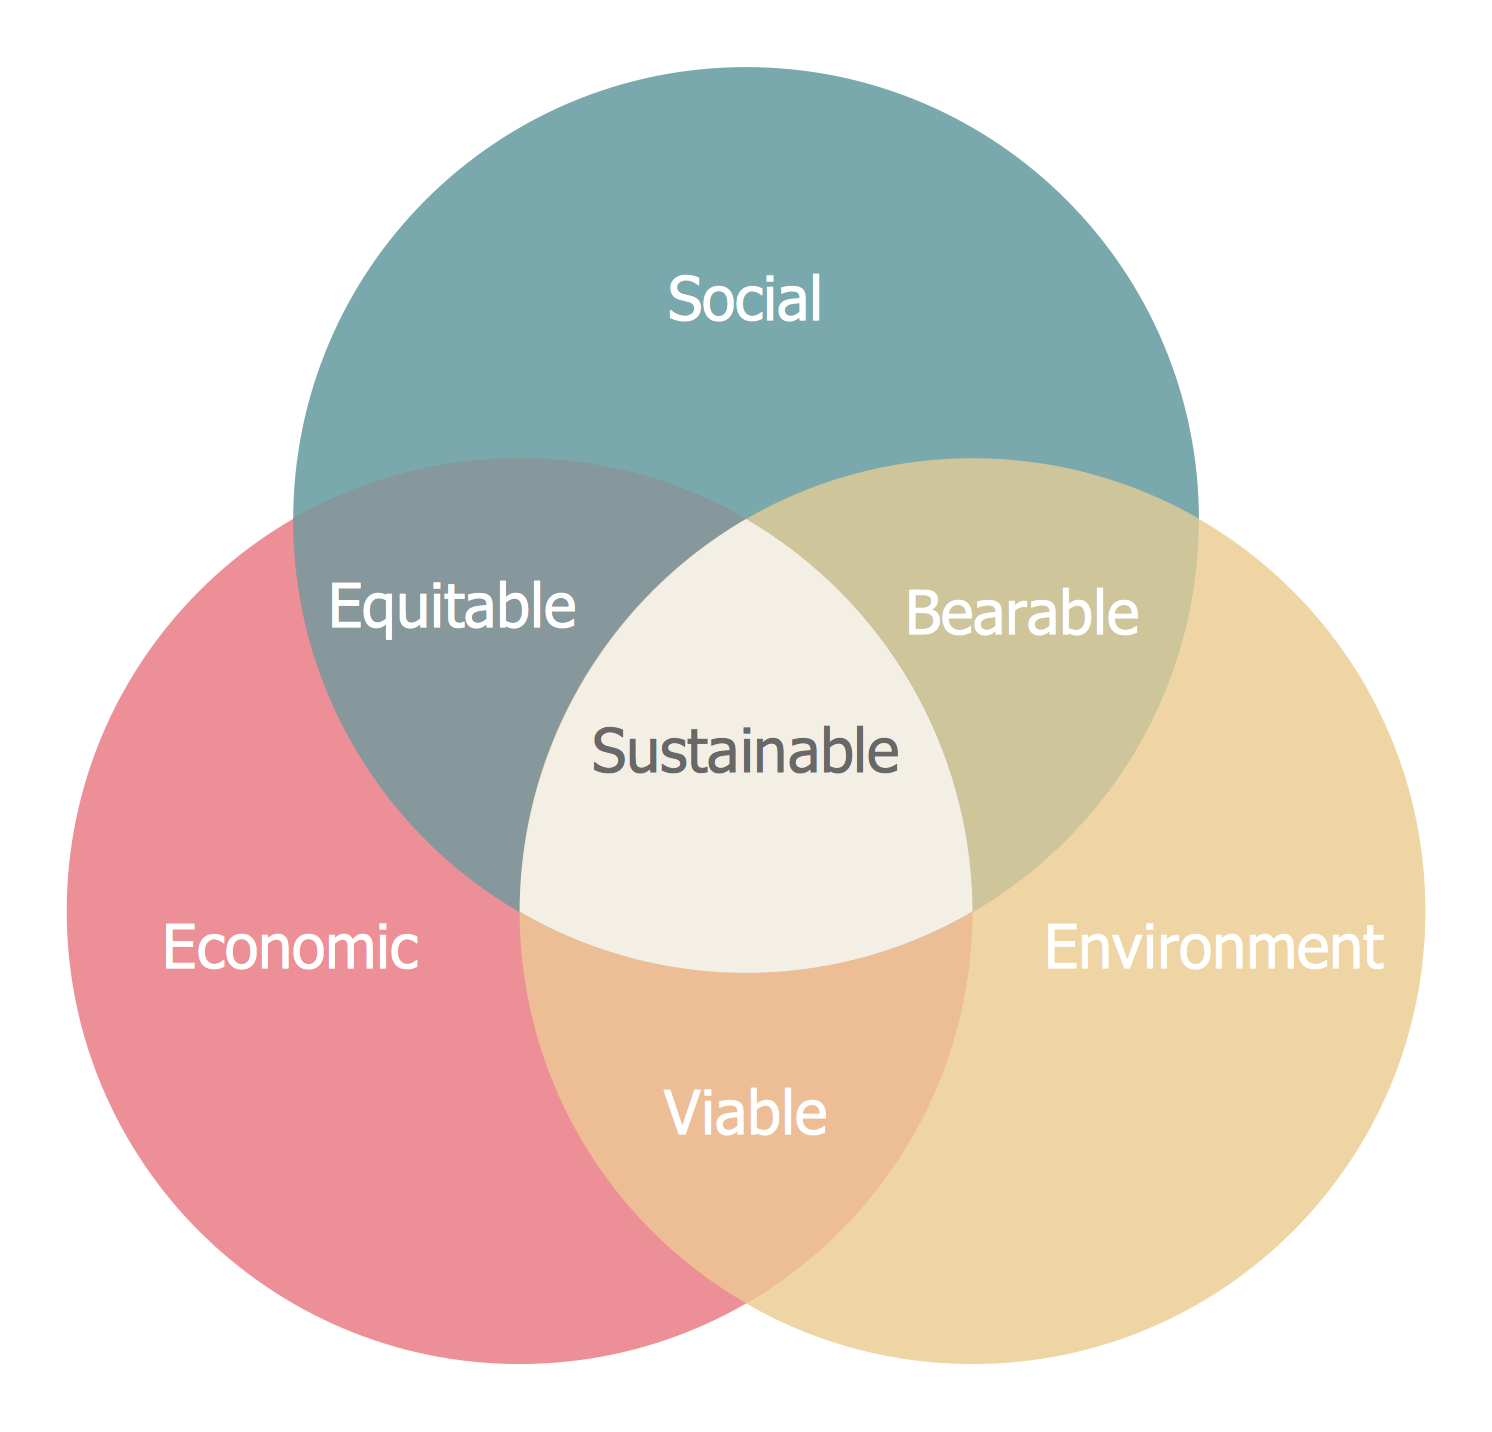
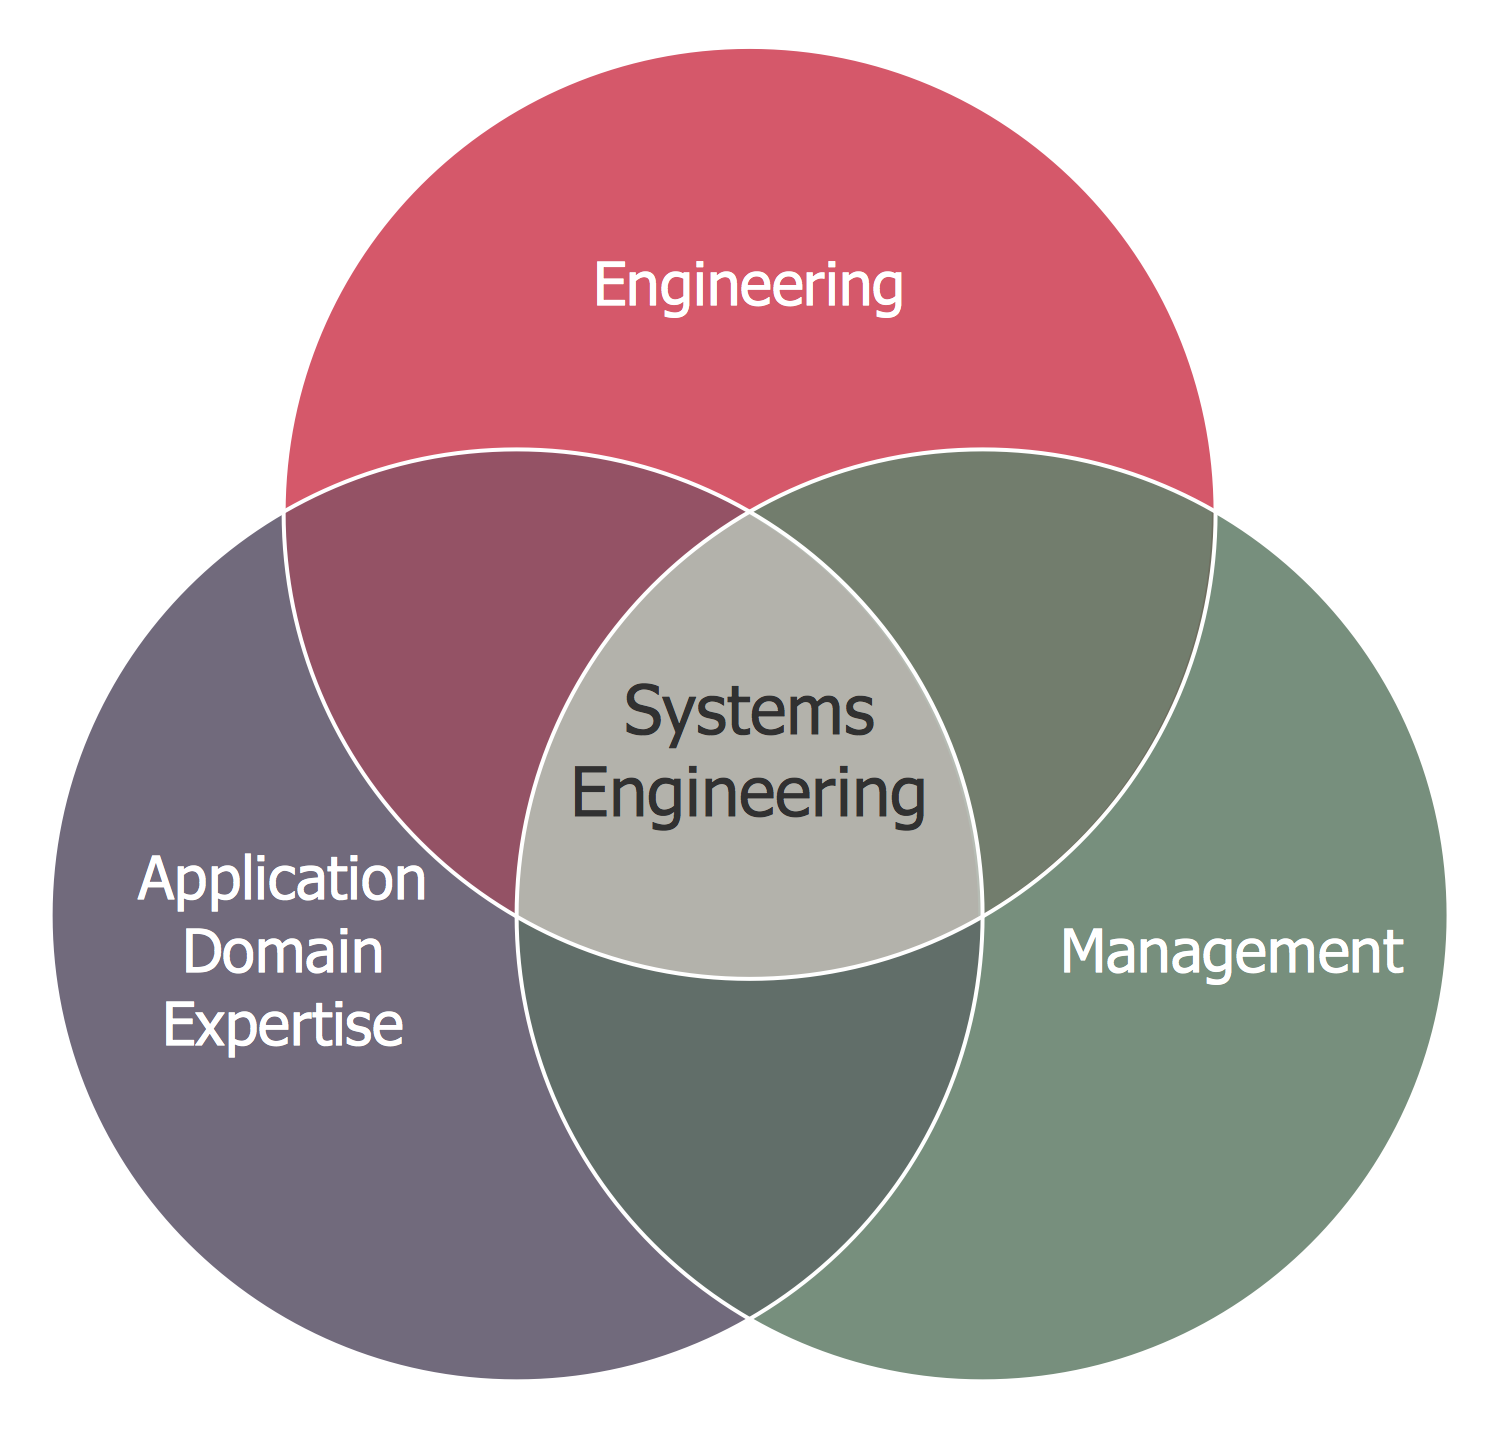
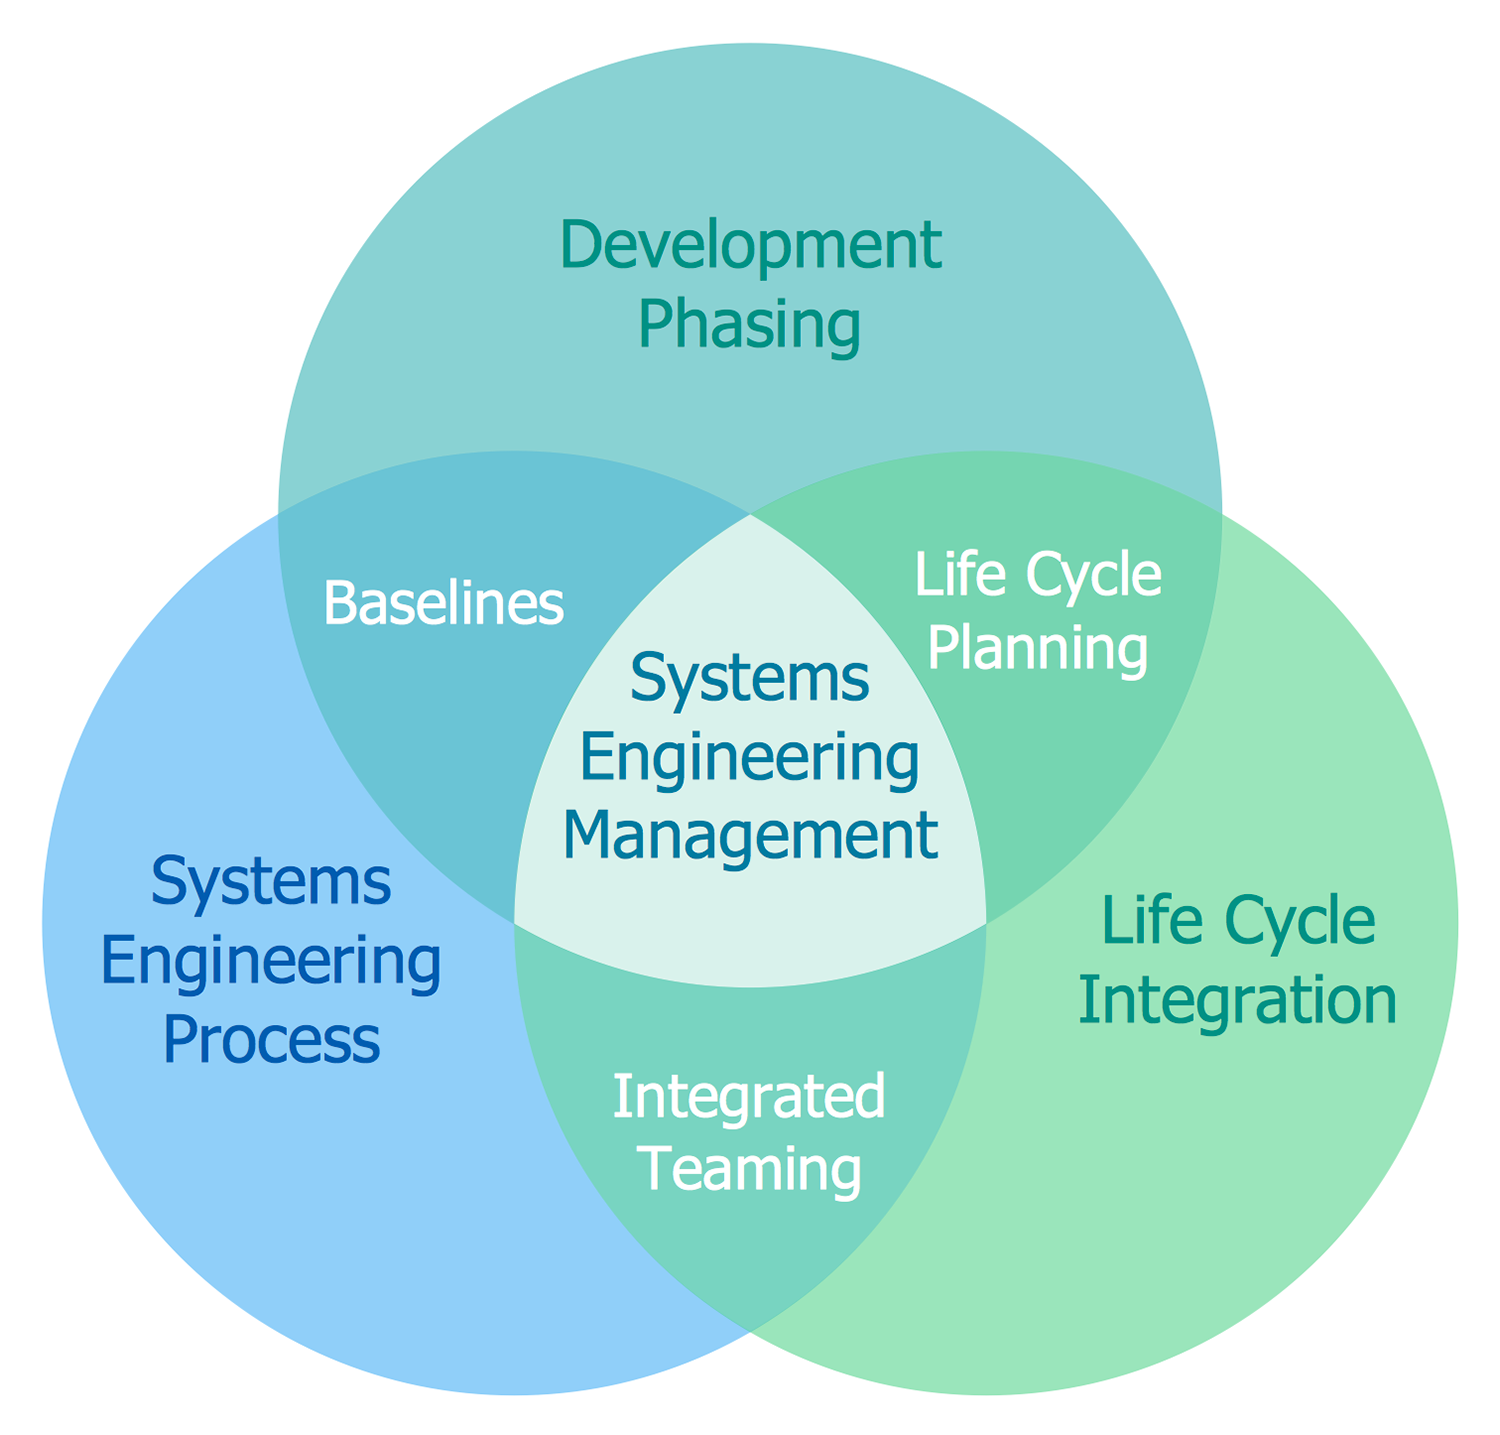
Example 2: Venn Diagram — Path to Sustainable Development
This diagram was created in ConceptDraw DIAGRAM using the Venn Diagrams Library from the Venn Diagrams Solution. An experienced user spent 10 minutes creating this sample.
This Venn Diagram shows the prerequisites for sustainable development, as it is influenced by economic, social and environmental factors. For clarity the circles have different colors. The intersection of three circles is brightly highlighted with the lightest color.

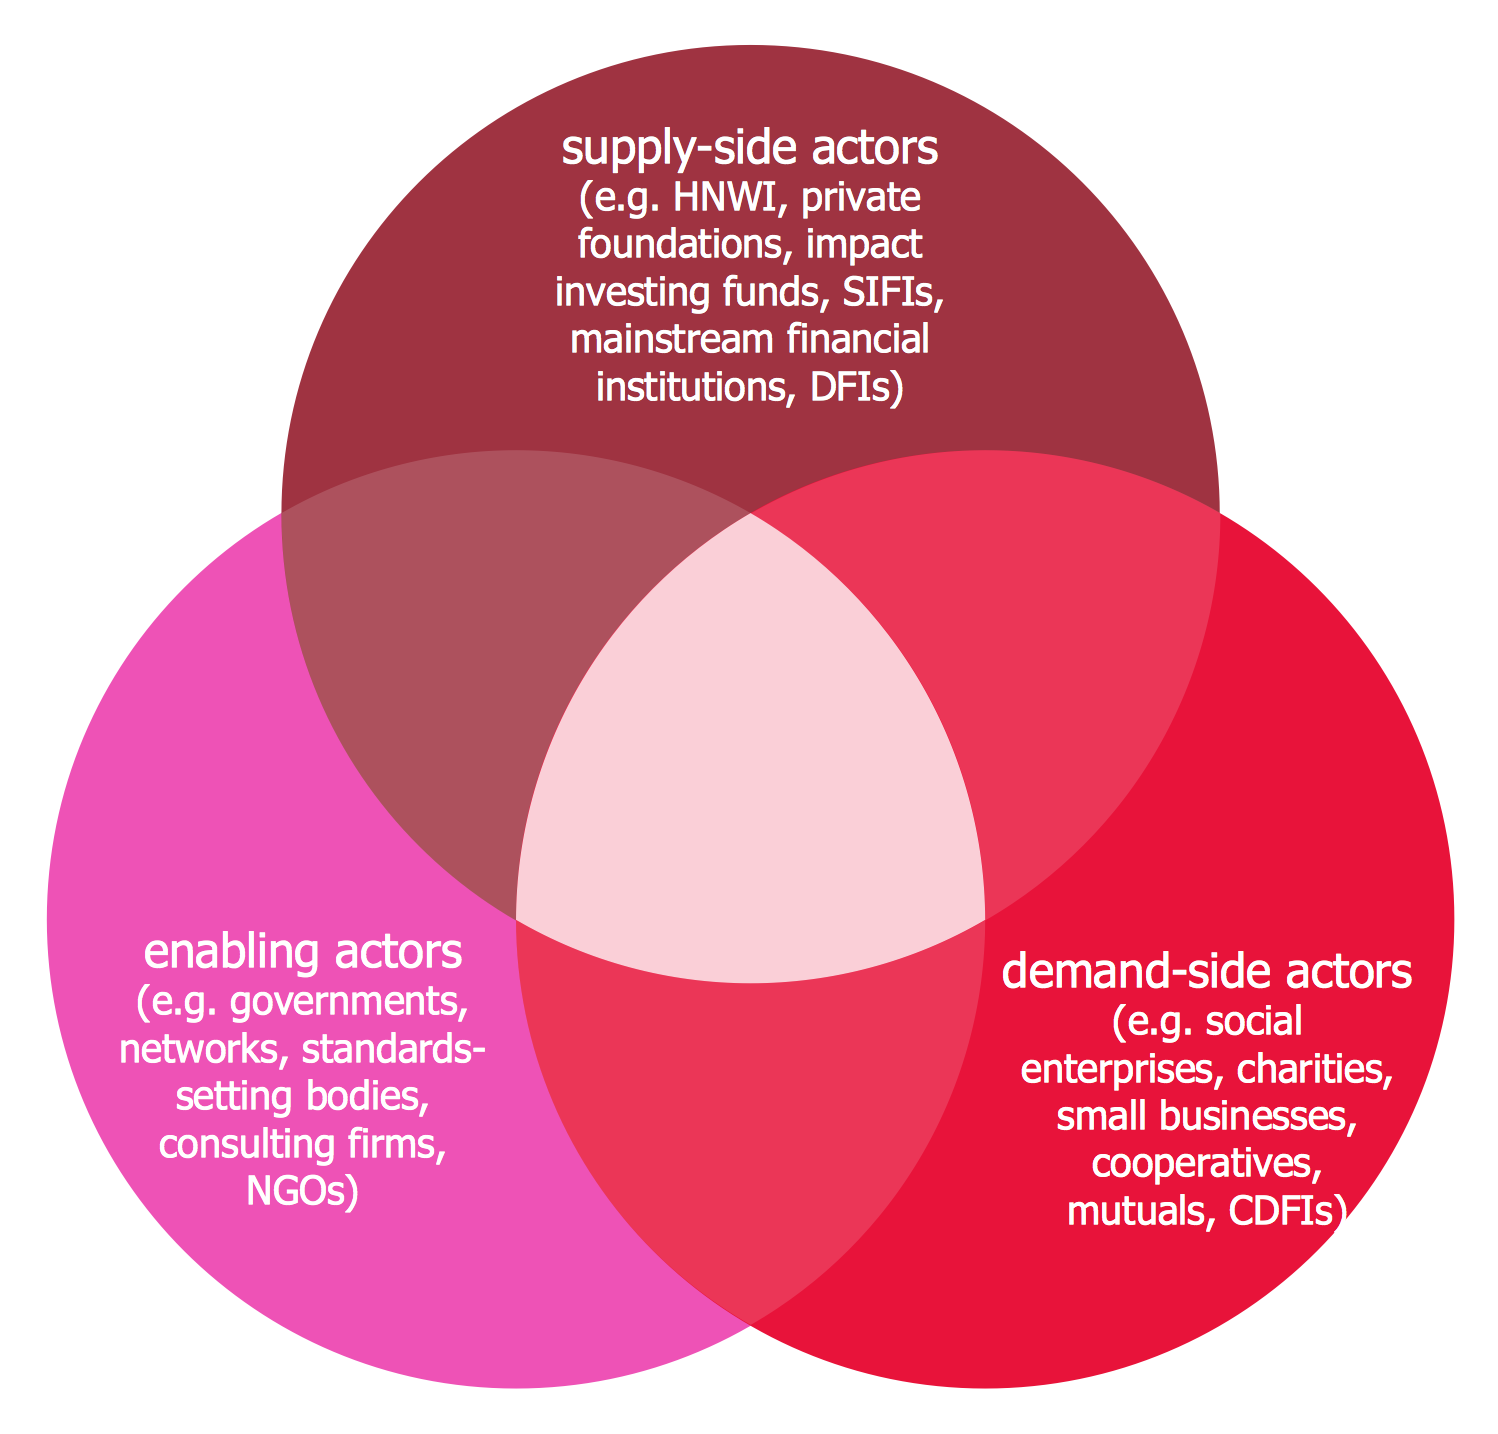
Example 3: Venn Diagram — Relationship Marketing
This diagram was created in ConceptDraw DIAGRAM using the Venn Diagrams Library from the Venn Diagrams Solution. An experienced user spent 5 minutes creating this sample.
This sample shows a Venn Diagram, which displays the components that make up relationship marketing. It’s incredibly convenient, simple, and quick to draw a Venn Diagram using ConceptDraw DIAGRAM with its predesigned objects.

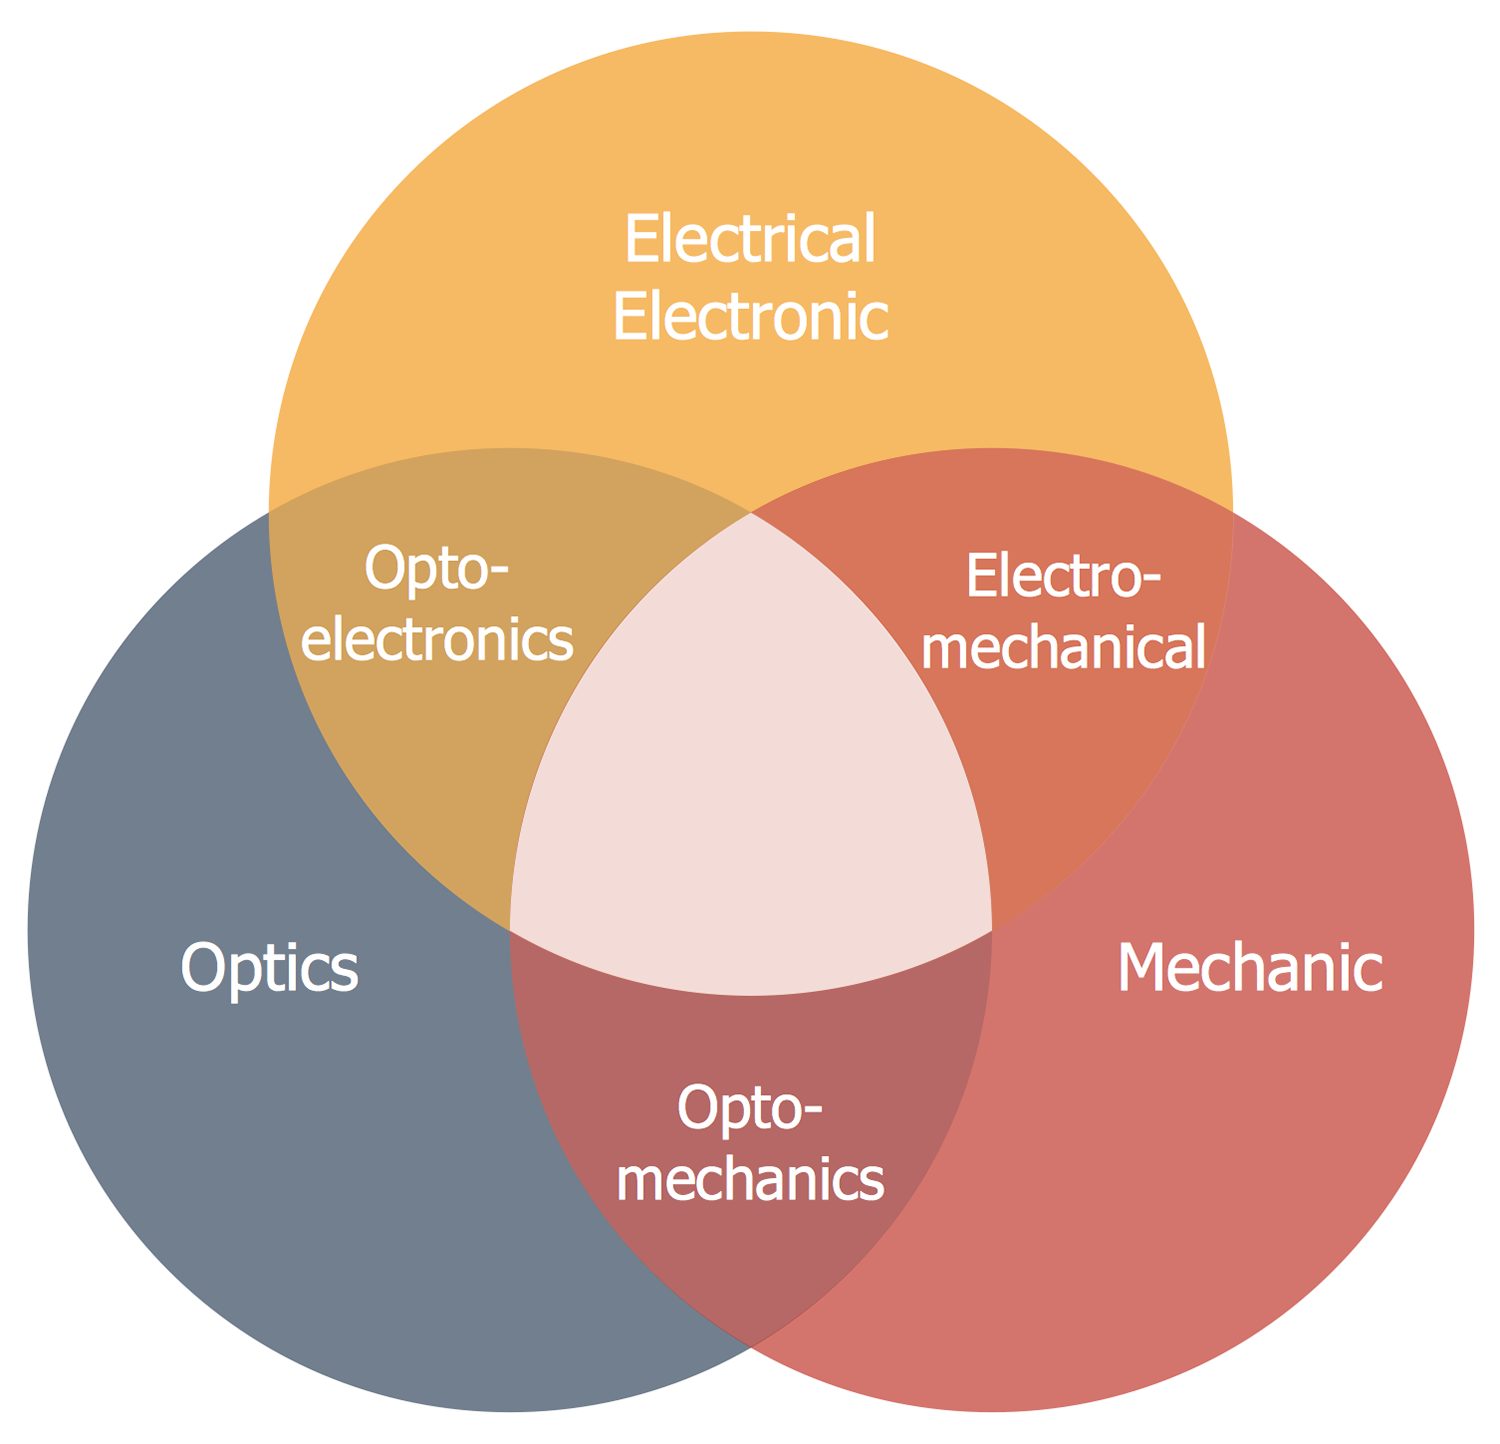
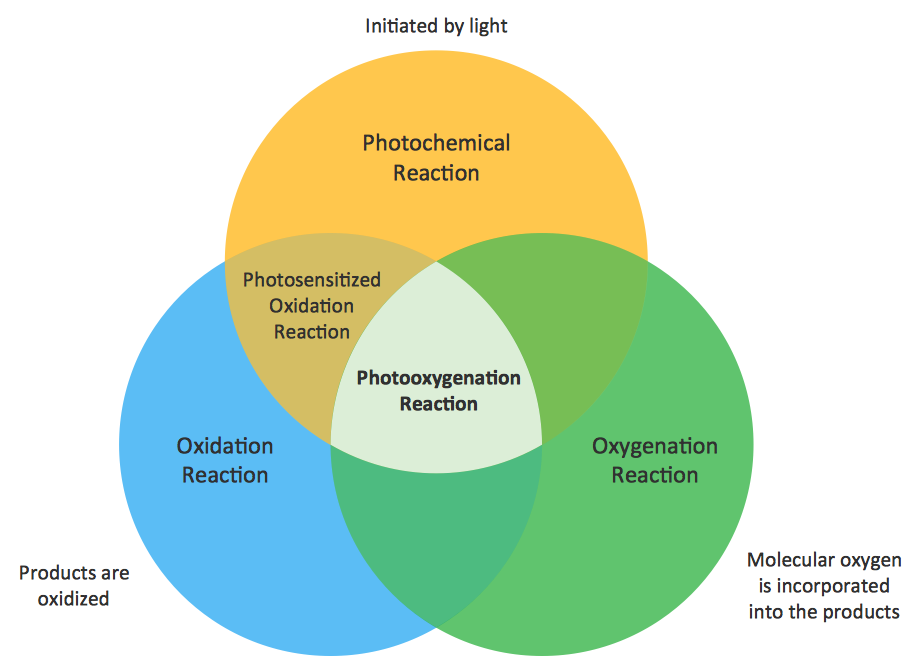
Example 4: Venn Diagram — Photooxygenation
This diagram was created in ConceptDraw DIAGRAM using the Venn Diagrams Library from the Venn Diagrams Solution. An experienced user spent 10 minutes creating this sample.
This Venn Diagram visually shows the attributes and components of a Photooxygenation reaction. This diagram is bright, attractive, and professional looking, so it can be used in presentations, reportages, reports, and scientific reviews.

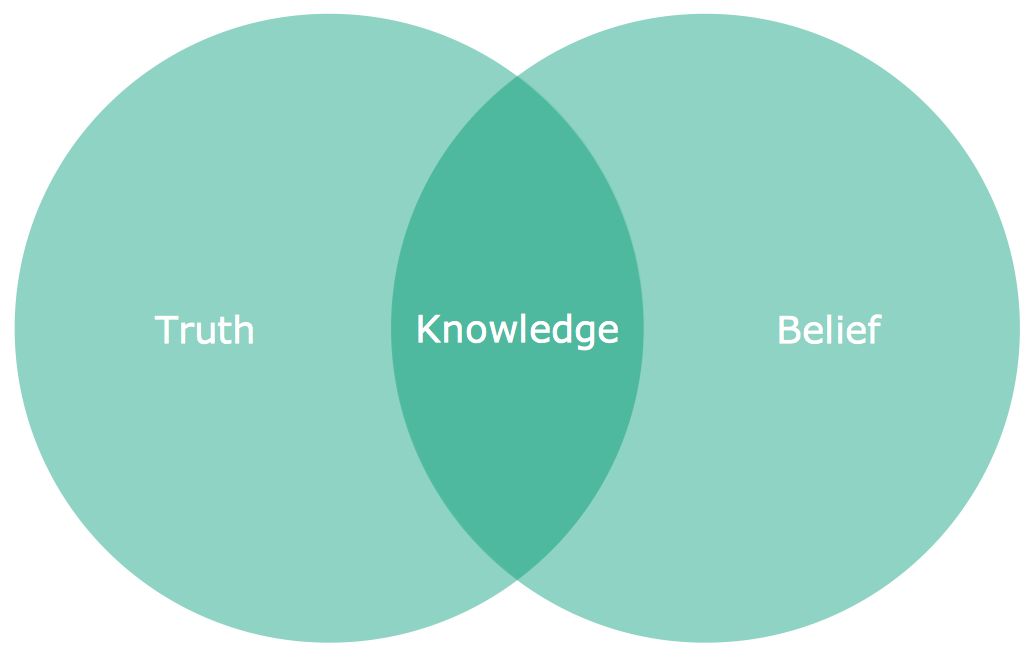
Example 5: Venn Diagram — Knowledge
This diagram was created in ConceptDraw DIAGRAM using the Venn Diagrams Library from the Venn Diagrams Solution. An experienced user spent 5 minutes creating this sample.
This sample shows a Venn Diagram that visualizes the intersection between two sets. The sets are equal in color value, but the intersection is visually highlighted to attract attention.

More Examples and Templates


Inside


What I Need to Get Started
After ConceptDraw DIAGRAM is installed, the Venn Diagrams solution can be purchased either from the Diagrams area of ConceptDraw STORE itself or from our online store. Thus, you will be able to use the Venn Diagrams solution straight after.

How to install
First of all, make sure that both ConceptDraw STORE and ConceptDraw DIAGRAM applications are downloaded and installed on your computer. Next, install the Venn Diagrams solution from the ConceptDraw STORE to use it in the ConceptDraw DIAGRAM application.

Start using
Start using the Venn Diagrams solution to make the professionally looking diagrams by adding the design elements taken from the stencil libraries and editing the pre-made examples that can be found there.

Venn Diagrams
A Venn diagram, sometimes referred to as a set diagram, is a diagramming style used to show all the possible logical relations between a finite amount of sets. In mathematical terms, a set is a collection of distinct objects gathered together into a group, which can then itself be termed as a single object. Venn diagrams represent these objects on a page as circles or ellipses, and their placement in relation to each other describes the relationships between them.
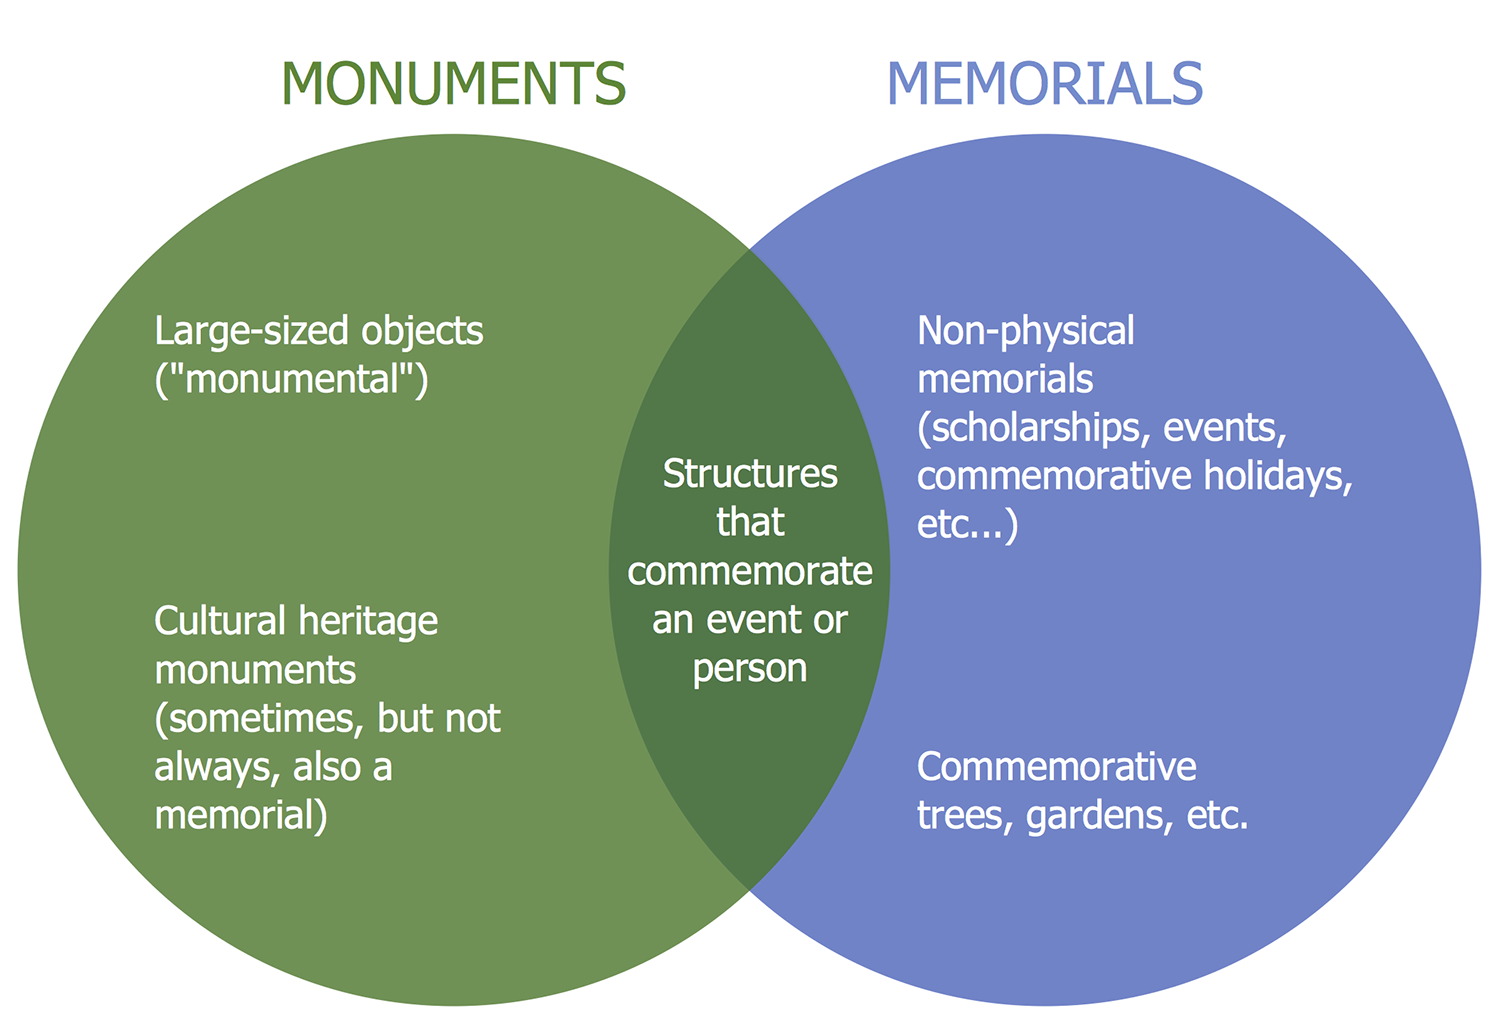
Simple Venn diagram showing two sets and their intersection made with ConceptDraw DIAGRAM
Commonly a Venn diagram will compare two sets with each other. In such a case, two circles will be used to represent the two sets, and they are placed on the page in such a way as that there is an overlap between them. This overlap, known as the intersection, represents the connection between sets — if for example the sets are 'mammals' and 'sea life', then the intersection will be 'marine mammals', e.g. dolphins or whales. Each set is taken to contain every instance possible of its class; everything outside the 'union' of sets (union is the term for the combined scope of all sets and intersections) is implicitly not any of those things — not a mammal, doesn't live underwater, etc.
The structure of this humble diagram was formally developed by the mathematician John Venn, but its roots go back as far as the 13th Century, and includes many stages of evolution dictated by a number of noted logicians and philosophers. The earliest indications of similar diagram theory came from the writer Ramon Llull, who's initial work would later inspire the German polymath Leibnez. Leibnez was exploring early ideas regarding computational sciences and diagrammatic reasoning, using a style of diagram that would eventually be formalized by another famous mathematician. This was Leonhard Euler, the creator of the Euler diagram.
Euler diagrams are similar to Venn diagrams, in that both compare distinct sets using logical connections. Where they differ is that a Venn diagram is bound to show every possible intersection between sets, whether objects fall into that class or not; a Euler diagram only shows actually possible intersections within the given context. Sets can exist entirely within another, termed as a subset, or as a separate circle on the page without any connections — this is known as a disjoint. Furthering the example outlined previously, if a new set was introduced — 'birds' — this would be shown as a circle entirely within the confines of the 'mammals' set (but not overlapping 'sea life'). A fourth set of 'trees' would be a disjoint — a circle without any connections or intersections.
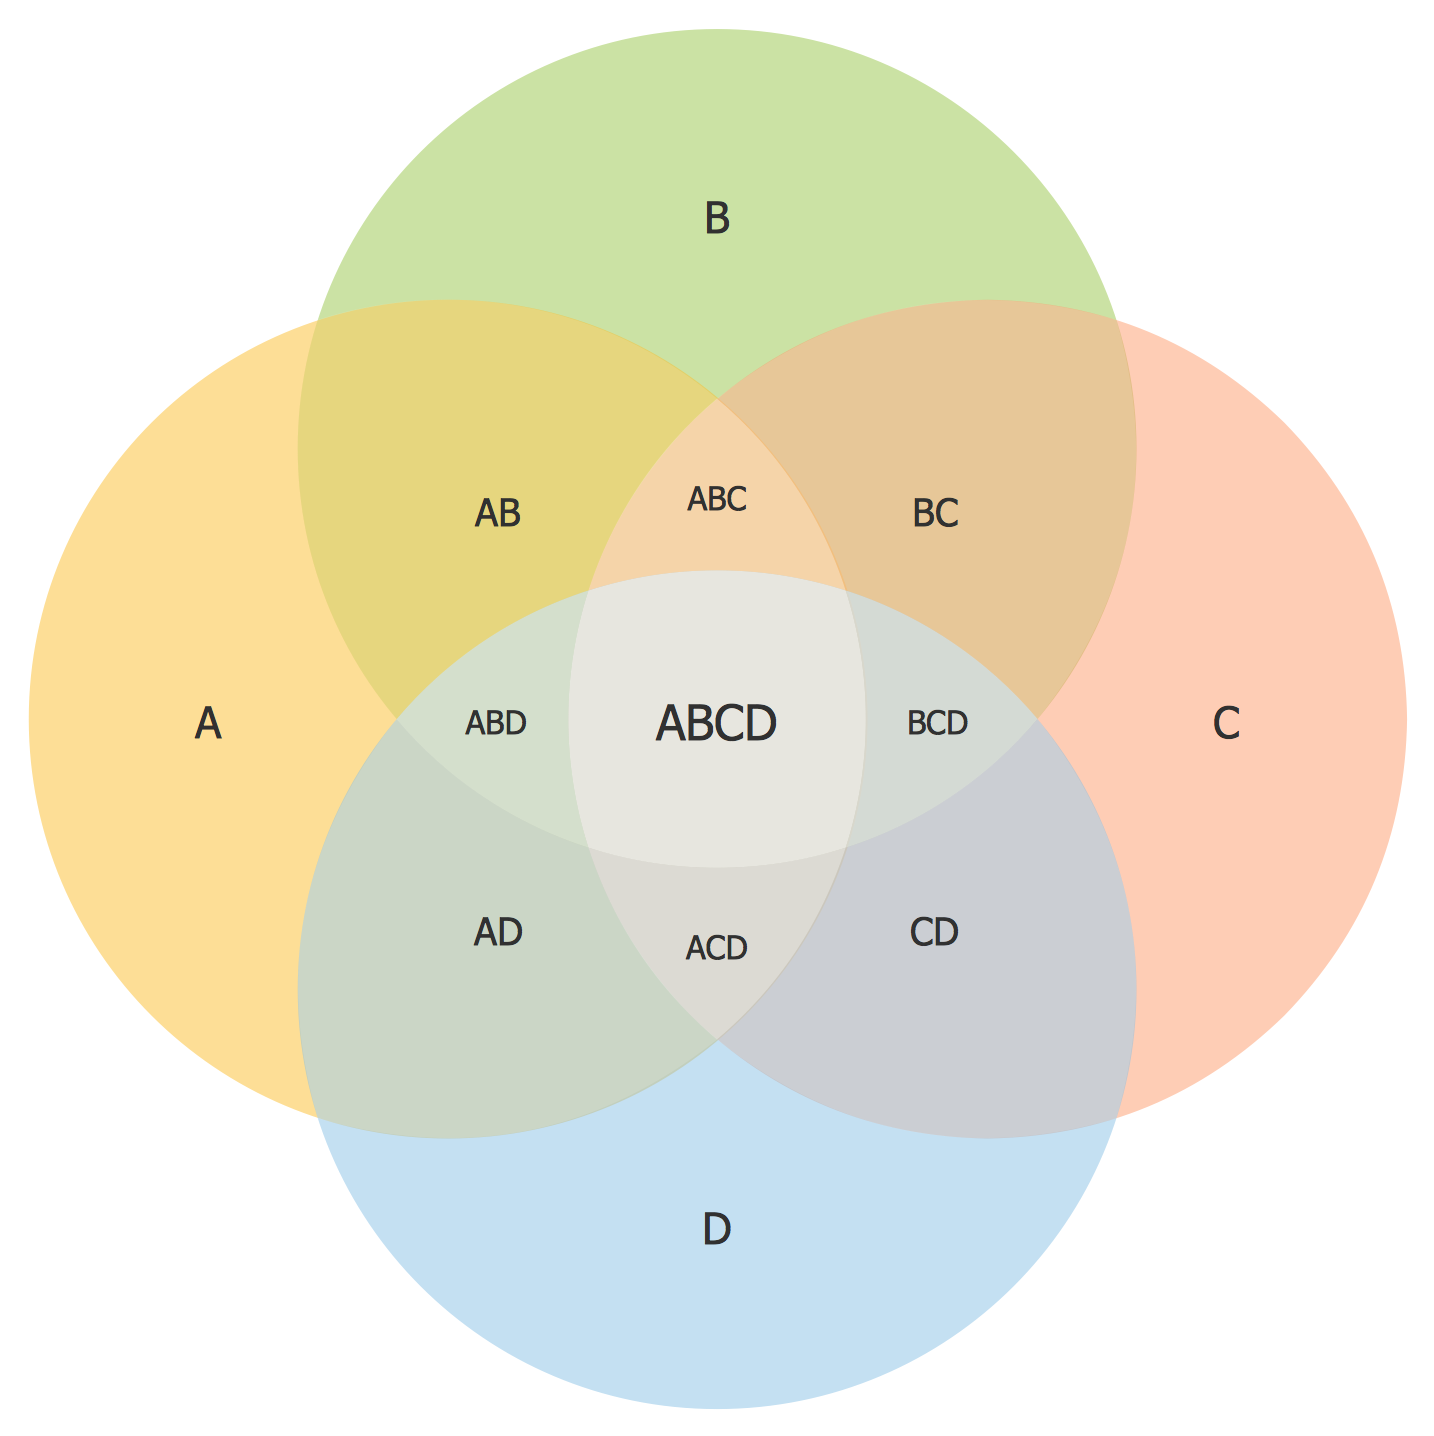
3-set Venn with 'empty' intersections, made using ConceptDraw DIAGRAM
Logician John Venn developed the Venn diagram in complement to Euler's concept. His diagram rules were more rigid than Euler's — each set must show its connection with all other sets within the union, even if no objects fall into this category. This is why Venn diagrams often only contain 2 or 3 sets, any more and the diagram can lose its symmetry and become overly complex. Venn made allowances for this by trading circles for ellipses and arcs, ensuring all connections are accounted for whilst maintaining the aesthetic of the diagram.
The ConceptDraw solution Venn Diagrams contains pre-made Venn templates
Usage for Venn diagrams has evolved somewhat since their inception. Both Euler and Venn diagrams were used to logically and visually frame a philosophical concept, taking phrases such as some of x is y, all of y is z and condensing that information into a diagram that can be summarized at a glance. They are used in, and indeed were formed as an extension of, set theory — a branch of mathematical logic that can describe object's relations through algebraic equation.
Now the Venn diagram is so ubiquitous and well ingrained a concept that you can see its use far outside mathematical confines. The form is so recognizable that it can shown through mediums such as advertising or news broadcast and the meaning will immediately be understood. They are used extensively in teaching environments — their generic functionality can apply to any subject and focus on my facet of it. Whether creating a business presentation, collating marketing data, or just visualizing a strategic concept, the Venn diagram is a quick, functional, and effective way of exploring logical relationships within a context.
As ever with any common (and not-so-common) diagramming technique, CS Odessa want to provide you with the tools needed to produce highly effective, professional diagrams, in the style that suits you. The Venn Diagrams solution for ConceptDraw DIAGRAM contains a library of 12 pre-built Venn diagrams, with options for 2, 3, 4 or 5 set variants, displayed using a range of color palettes. Just pick your style, fill in your text, and your work is almost done. From there you can choose to export your diagram into a presentation, open using other diagramming software, or use in conjunction with other services from the ConceptDraw Office suite. Help is on hand if you need it, from How-To guides, to video tutorials, not forgetting our huge online help desk.
For easy-to-make diagrams you'll use everyday, take the Venn Diagrams solution for ConceptDraw DIAGRAM.