- Electric and Telecom Plans Free
- Fire and Emergency Plans Free
- Floor Plans Free
- Plant Layout Plans Free
- School and Training Plans Free
- Seating Plans Free
- Security and Access Plans Free
- Site Plans Free
- Sport Field Plans Free
- Business Process Diagrams Free
- Business Process Mapping Free
- Classic Business Process Modeling Free
- Cross-Functional Flowcharts Free
- Event-driven Process Chain Diagrams Free
- IDEF Business Process Diagrams Free
- Logistics Flow Charts Free
- Workflow Diagrams Free
- ConceptDraw Dashboard for Facebook Free
- Mind Map Exchange Free
- MindTweet Free
- Note Exchange Free
- Project Exchange Free
- Social Media Response Free
- Active Directory Diagrams Free
- AWS Architecture Diagrams Free
- Azure Architecture Free
- Cisco Network Diagrams Free
- Cisco Networking Free
- Cloud Computing Diagrams Free
- Computer Network Diagrams Free
- Google Cloud Platform Free
- Interactive Voice Response Diagrams Free
- Network Layout Floor Plans Free
- Network Security Diagrams Free
- Rack Diagrams Free
- Telecommunication Network Diagrams Free
- Vehicular Networking Free
- Wireless Networks Free
- Comparison Dashboard Free
- Composition Dashboard Free
- Correlation Dashboard Free
- Frequency Distribution Dashboard Free
- Meter Dashboard Free
- Spatial Dashboard Free
- Status Dashboard Free
- Time Series Dashboard Free
- Basic Circle-Spoke Diagrams Free
- Basic Circular Arrows Diagrams Free
- Basic Venn Diagrams Free
- Block Diagrams Free
- Concept Maps Free
- Family Tree Free
- Flowcharts Free
- Basic Area Charts Free
- Basic Bar Graphs Free
- Basic Divided Bar Diagrams Free
- Basic Histograms Free
- Basic Line Graphs Free
- Basic Picture Graphs Free
- Basic Pie Charts Free
- Basic Scatter Diagrams Free
- Aerospace and Transport Free
- Artwork Free
- Audio, Video, Media Free
- Business and Finance Free
- Computers and Communications Free
- Holiday Free
- Manufacturing and Maintenance Free
- Nature Free
- People Free
- Presentation Clipart Free
- Safety and Security Free
- Analog Electronics Free
- Audio and Video Connectors Free
- Basic Circuit Diagrams Free
- Chemical and Process Engineering Free
- Digital Electronics Free
- Electrical Engineering Free
- Electron Tube Circuits Free
- Electronic Block Diagrams Free
- Fault Tree Analysis Diagrams Free
- GHS Hazard Pictograms Free
- Home Automation and Wiring Free
- Mechanical Engineering Free
- One-line Diagrams Free
- Power Сircuits Free
- Specification and Description Language (SDL) Free
- Telecom and AV Circuits Free
- Transport Hazard Pictograms Free
- Data-driven Infographics Free
- Pictorial Infographics Free
- Spatial Infographics Free
- Typography Infographics Free
- Calendars Free
- Decision Making Free
- Enterprise Architecture Diagrams Free
- Fishbone Diagrams Free
- Organizational Charts Free
- Plan-Do-Check-Act (PDCA) Free
- Seven Management and Planning Tools Free
- SWOT and TOWS Matrix Diagrams Free
- Timeline Diagrams Free
- Australia Map Free
- Continent Maps Free
- Directional Maps Free
- Germany Map Free
- Metro Map Free
- UK Map Free
- USA Maps Free
- Customer Journey Mapping Free
- Marketing Diagrams Free
- Matrices Free
- Pyramid Diagrams Free
- Sales Dashboard Free
- Sales Flowcharts Free
- Target and Circular Diagrams Free
- Cash Flow Reports Free
- Current Activities Reports Free
- Custom Excel Report Free
- Knowledge Reports Free
- MINDMAP Reports Free
- Overview Reports Free
- PM Agile Free
- PM Dashboards Free
- PM Docs Free
- PM Easy Free
- PM Meetings Free
- PM Personal Time Management Free
- PM Planning Free
- PM Presentations Free
- PM Response Free
- Resource Usage Reports Free
- Visual Reports Free
- House of Quality Free
- Quality Mind Map Free
- Total Quality Management TQM Diagrams Free
- Value Stream Mapping Free
- Astronomy Free
- Biology Free
- Chemistry Free
- Language Learning Free
- Mathematics Free
- Physics Free
- Piano Sheet Music Free
- Android User Interface Free
- Class Hierarchy Tree Free
- Data Flow Diagrams (DFD) Free
- DOM Tree Free
- Entity-Relationship Diagram (ERD) Free
- EXPRESS-G data Modeling Diagram Free
- IDEF0 Diagrams Free
- iPhone User Interface Free
- Jackson Structured Programming (JSP) Diagrams Free
- macOS User Interface Free
- Object-Role Modeling (ORM) Diagrams Free
- Rapid UML Free
- SYSML Free
- Website Wireframe Free
- Windows 10 User Interface Free
Rapid UML
UML is an abbreviation for the Unified Modeling Language that is a developmental, general-purpose, modeling language widely used in the field of software engineering. It is known to be intended to provide a standard way that can be used in order to visualize system designs.
UML can offer the right way to visualize some system's architectural blueprints in a way of a diagram. Elements of such a diagram can be activities (e.g, jobs), individual components of the system, and a description of how all of them can interact with other software components. The way the system will run and how the entities can interact with others may be also explained in a way of such diagram. An external user interface may be a part of any UML diagram too.
Usually, any of the UML diagrams can represent two different views of the same system model. This can be a static (also known as “structural”) or dynamic (or “behavioral”) view. The first mentioned emphasizes the static structure of the system using various attributes, operations, relationships, and objects, and the last mentioned, as is known, emphasizes the dynamic behavior of the system, showing the interaction between changes and objects in the internal states of objects.
The static view includes Composite structure and Class diagrams, and the dynamic one includes Activity, State machine, and Sequence diagrams. In order to create any of the described drawings, the ConceptDraw DIAGRAM vector diagramming and drawing software can be used.
Having the Rapid UML solution that extends the ConceptDraw DIAGRAM application with the ability to develop the needed UML diagrams within a short period of time, can help you complete the UML-related tasks faster. This solution uses the so-called “ConceptDraw RapidDraw” techniques and it may be useful for many different IT specialists, such as programmers, software developers, software engineers.
-
Install this solution Free -
What I need to get started -
Solution Requirements - This solution requires the following products to be installed:
ConceptDraw DIAGRAM v17 - This solution requires the following products to be installed:
-
Compatibility - Monterey (12), Ventura (13), Sonoma (14)
MS Windows 8.1, 10 - Monterey (12), Ventura (13), Sonoma (14)
-
Support for this Solution -
Helpdesk
There are 13 stencil libraries containing 371 vector objects in the Rapid UML solution.
Design Elements — UML Class Diagram

Examples
There are a few samples that you see on this page which were created in the ConceptDraw DIAGRAM application by using the Rapid UML solution. Some of the solution's capabilities as well as the professional results which you can achieve are all demonstrated here on this page.
All source documents are vector graphic documents which are always available for modifying, reviewing and/or converting to many different formats, such as MS PowerPoint, PDF file, MS Visio, and many other graphic ones from the ConceptDraw Solution Park or ConceptDraw STORE. The Rapid UML solution is available to all ConceptDraw DIAGRAM users to get installed and used while working in the ConceptDraw DIAGRAM diagramming and drawing software.
Example 1: UML Sequence Diagram — Checking Process
This diagram was created in ConceptDraw DIAGRAM using the UML Sequence Diagram library from the Rapid UML solution. An experienced user spent 10 minutes creating this sample.
This sample represents a UML Sequence Diagram designed for a checking process. If you want to take a well-deserved break from work, you must complete the process of checking employee schedules and available dates in response to a vacation request. Designed with the Sequence diagram tool, this map helps you create a formal verification process that you can use everywhere. The UML Sequence Diagram displays the messages that prompt an object for taking some actions, the actions that are called by these messages, and the sequence of exchange the messages between objects. The objects are displayed as rectangles from left to right, in this case, these are Leave Request Entry Page, Leave Request, Approval Workflow, Employee Schedule, Leave Approval, Activity. The messages that objects exchange when interacting within the script are displayed as lines with arrows. The dotted lines present the lifelines, the time frames in which the element exists in the system. The period of object’s activity at the time of interaction is displayed with the control focus indicated by the rectangle on the object's lifeline. The Employee element presents the user initiating the flow of events in this diagram.

Example 2: UML Activity Diagram — Payment Process
This diagram was created in ConceptDraw DIAGRAM using the UML Activity Library from the Rapid UML Solution. An experienced user spent 10 minutes creating this sample.
This sample shows a UML activity diagram that describes the flow of controls in a payment process. The payment is a process of transferring goods, services, or some other items from one party in exchange for money transferring from another party. Moreover, payment methods can vary significantly by agreement of both parties. The general designations are used: the start of the workflow is indicated by the black circle and the end — by the encircled black circle. Use swimlanes to group the activities into separate visual categories, here it is the accounting of the client, accounting supplier, and payee. According to the diagram, during the payment process the action triggered by actor Customer who needs to pay for the goods. It can authorize the payment and notify of the payment. After this, the Remittance Advice is transferred to the actor Supplier, which in turn receives advice from the customer and notifies the recipient. And finally, when Remittance Advice is transmitted to the actor Payee party, it participates in the action and receives advice.

Example 3: UML Deployment Diagram
This diagram was created in ConceptDraw DIAGRAM using the UML Deployment Library from the Rapid UML Solution. An experienced user spent 15 minutes creating this sample.
This sample diagram demonstrates a UML Deployment Diagram dedicated to iTunes, which models the physical deployment of artifacts on nodes for a given system. The diagram describes all the existing nodes which artifacts work with, as well as the relationships between all parts of the system. iTunes is both a media player, a media library and a mobile device management application. It is an invention of Apple Inc. which is currently really popular in the world among the audience of various age categories and status for downloading and playing digital audio and video, organizing them on computers running any OS X or Microsoft Windows operating system, navigating a media library, synchronizing with iPod , iPhone, iPad, and Apple TV. iTunes Store offers its users wide abilities of purchase and downloading music they like, audiobooks, movies, television shows, podcasts, and ringtones for mobiles. The use of different colors when drawing UML diagrams is an excellent idea; they make your diagrams bright, colorful, and attractive.

Example 4: UML Class Diagram
This diagram was created in ConceptDraw DIAGRAM using the UML Class Diagram Library from the Rapid UML Solution. An experienced user spent 20 minutes creating this sample.
This example shows a UML Class Diagram in its typical view and was designed with ConceptDraw’s Class diagram tool. The UML Class Diagram is a type of static structure diagram used to visually describe the system structure, to present all its classes with the attributes, methods or operations, and relationships among them. Each class is presented by a separate rectangle, uniquely named and describes a set of objects with the same characteristics. The class attributes and operations are listed in the same rectangle under the class name. Four classes are included to this diagram: User_Interface, JComponent, Element, Form<<control>> and relationships of several types are defined between them: dependency, association, aggregation, and composition. Significant comments are described in the form of notes depicted in yellow rectangles next to the main classes. ConceptDraw DIAGRAM provides ample opportunities for simple and quick drawing of UML Class Diagrams of any complexity with the help of a powerful UML Class diagram tool — predesigned vector objects from Rapid UML solution libraries.

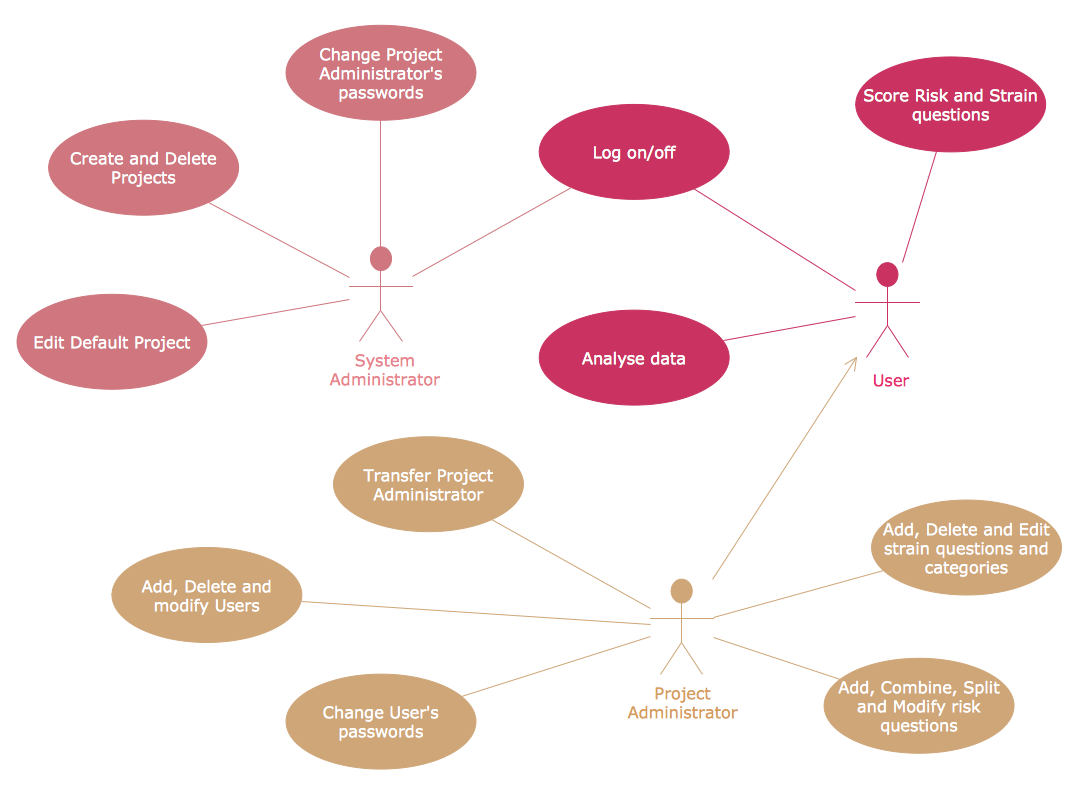
Example 5: UML Use Case Diagram
This diagram was created in ConceptDraw DIAGRAM using the UML Use Case Diagram Library from the Rapid UML Solution. An experienced user spent 10 minutes creating this sample.
This sample shows a UML Use Case Diagram that describes a banking system. The Use Case Diagrams are one of the most commonly used types of UML diagrams. They provide the simplest graphical way of representing the user’s interaction with the system, the relationships between the user and the various use cases in which it is involved. The Use Case Diagrams are intended to simplify the interaction of future users or customers with a system and are especially useful for determining the necessary system characteristics, they describe what the system should do without specifying how, i.e. without indicating the methods used by a system. This sample is the best way to explain in detail the inner workings of the banking system. The actors are presented by the “man” symbols and the use cases are depicted in ovals. All interactions of an actor User with a banking system are displayed with connecting lines. Make changes and additions to this Use Case Diagram if needed.

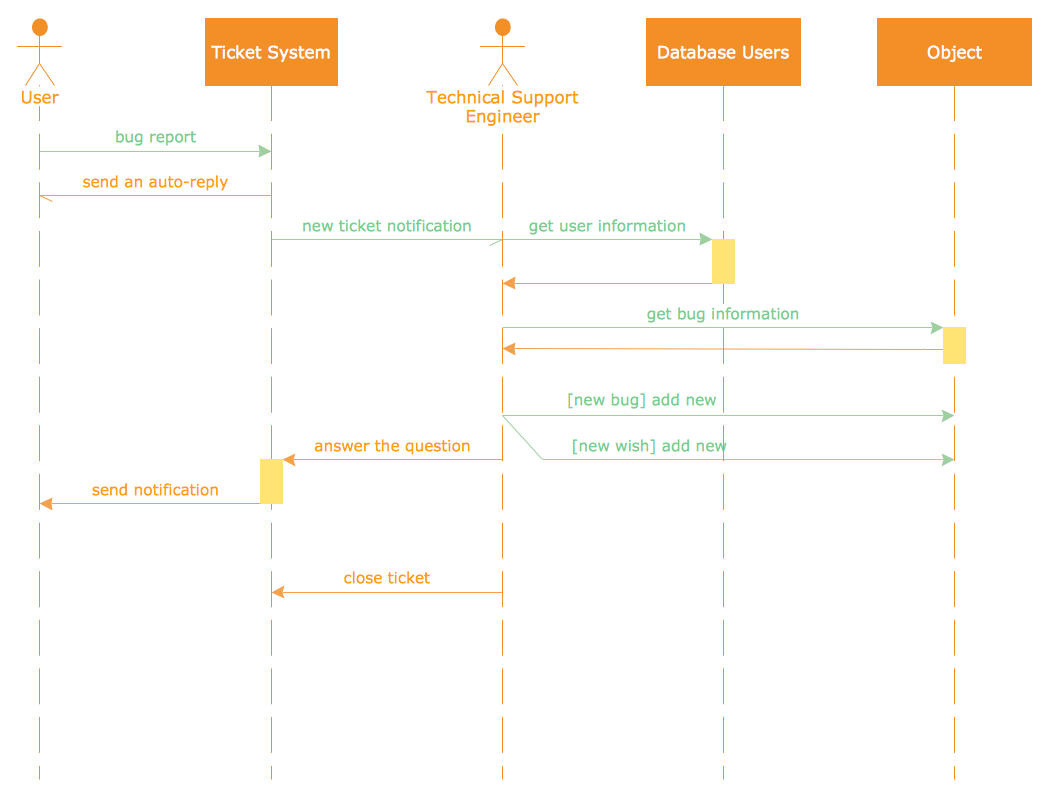
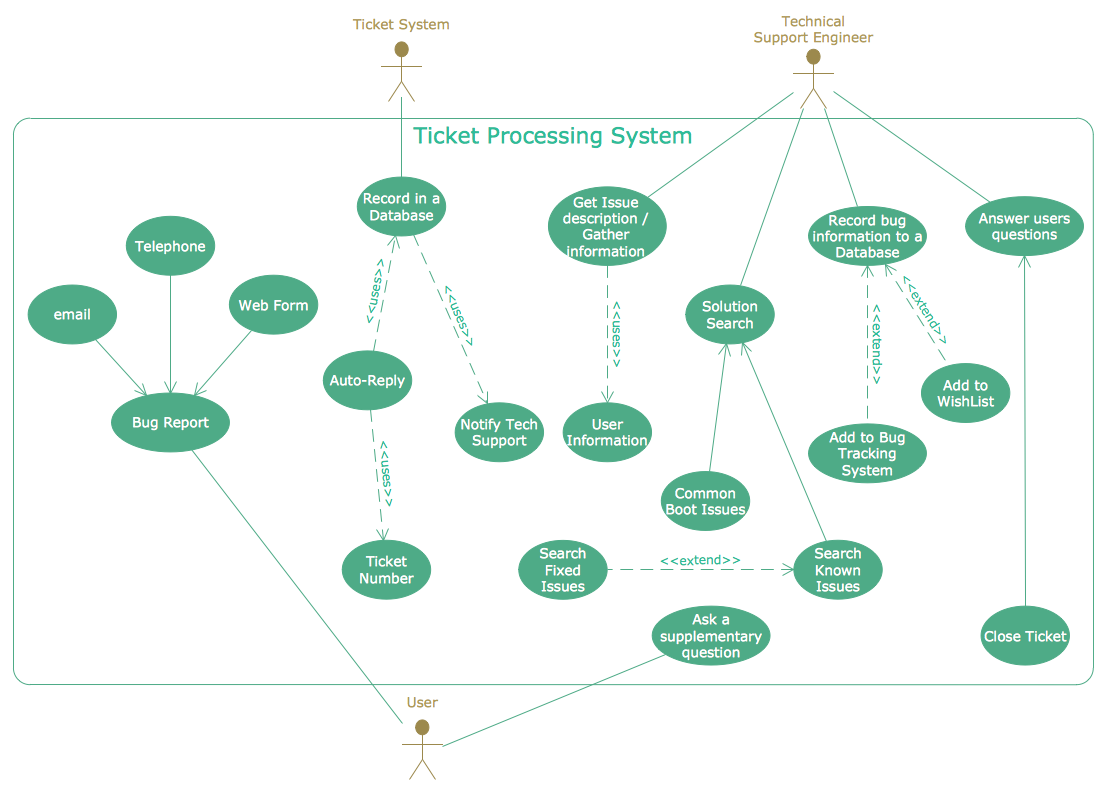
Example 6: UML Collaboration Diagram — Ticket Processing System
This diagram was created in ConceptDraw DIAGRAM using the UML Collaboration Diagram Library from the Rapid UML Solution. An experienced user spent 10 minutes creating this sample.
This sample demonstrates a ticket processing system using the UML Collaboration Diagram. The use of a database diagram tool and UML diagram structure lets to represent a ticket processing system and interactions with users in an extremely simple and comprehensive form. The Collaboration diagram is a visual representation of objects, their behavior, functionalities, and interactions within an overall system using the Unified Modeling Language. These diagrams can describe the dynamic behavior of a particular use case and define the roles of objects. Four major components compose the Collaboration diagram, these are the objects shown as rectangles, actors that are the instances invoking the interactions in a diagram, links connecting objects with actors and presented by solid lines, and messages or communications between objects displayed labeled arrows near the links. The object User interacts with the object Ticket System in this diagram, which in turn interacts with the object Technical Support Manager, the interactions with other diagram objects Bug Tracking System, Users Database, and User Feedback System are also presented.

Example 7: UML Communication Diagram — Client Server Access
This diagram was created in ConceptDraw DIAGRAM using the UML Communication Diagram Library from the Rapid UML Solution. An experienced user spent 15 minutes creating this sample.
This sample diagram illustrates a client server access system in the form of a UML Communication Diagram. An application structure that distributes the tasks or workloads between the providers of resources or services and service requesters is a client-server model of computing. These providers are called "servers" and the service requesters are "clients". The different variants are possible: the clients and servers can communicate over a computer network on separate hardware, as well as in the same system. The most famous examples of computer applications based on the client-server model are email, network printing, World Wide Web. UML Communication diagram illustrates the objects, their interactions, and the messages that these objects send each other. The objects are represented by named rectangles and messages transmitted between them are indicated by marked arrows from the object sending them to the receiving one. The message's numerical prefix indicates its order in the sequence.

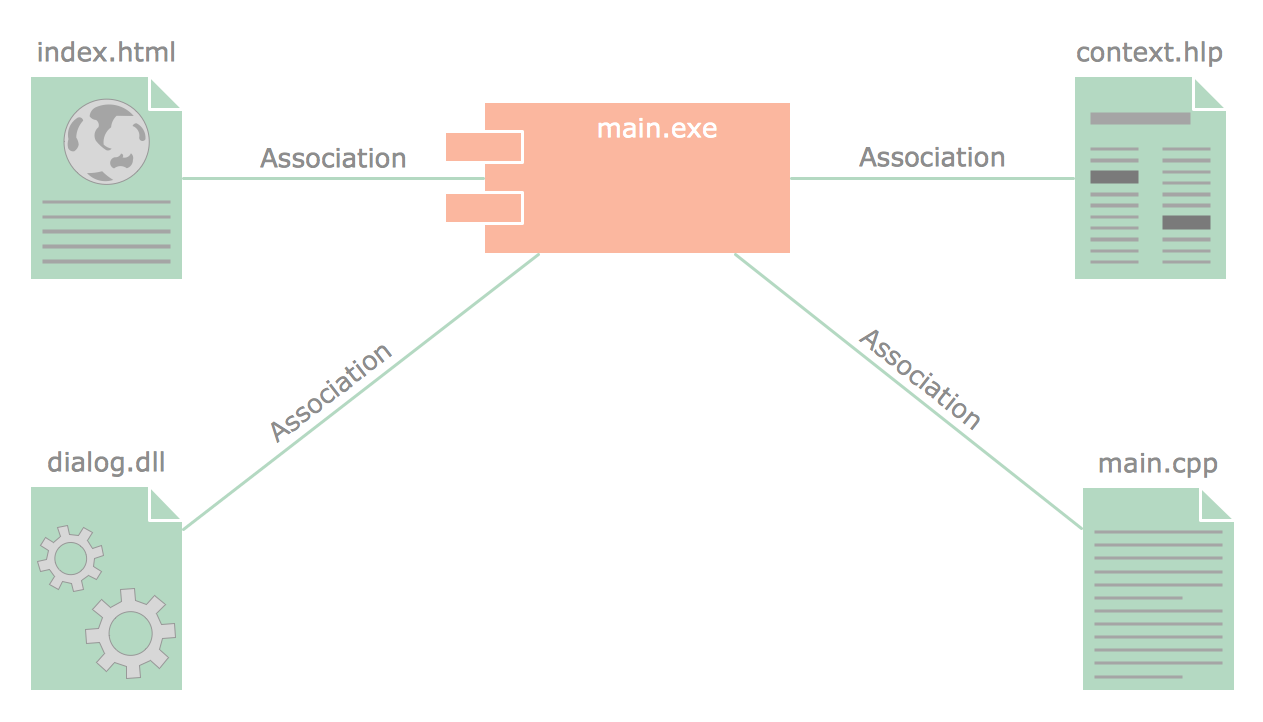
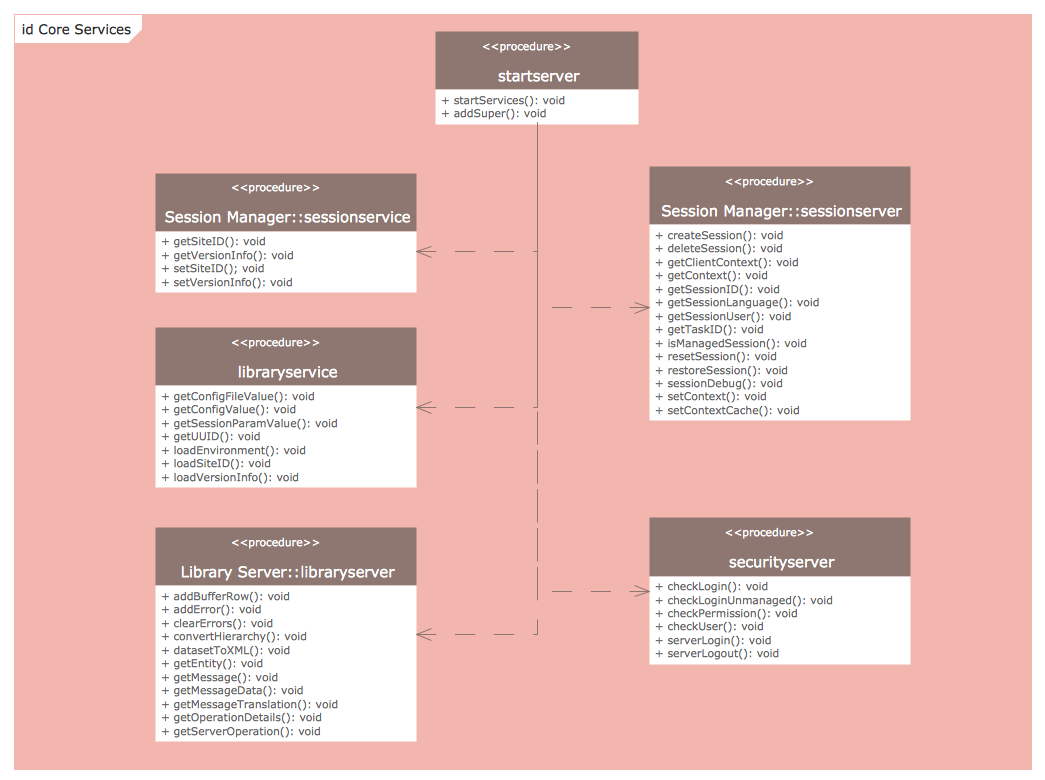
Example 8: UML Component Diagram — Credit Card Agency
This diagram was created in ConceptDraw DIAGRAM using the UML Component Diagram Library from the Rapid UML Solution. An experienced user spent 15 minutes creating this sample.
This sample demonstrates a structure of a credit card agency using the UML Component Diagram. The credit card is a kind of payment card allowing the cardholder to pay for various goods, services, and other items based on the agreement of payment for them with delay on a previously agreed term. The Component Diagram defines the architecture of the system that is needed to be developed, sets dependencies between all software components and describes the features of the system's physical representation. The main graphical elements of a Component Diagram are components, interfaces, and dependencies between them. A component is a physical part of the system; it can be a file with the source code of classes, library, or executable module that must have a consistent set of interfaces. The components are represented by rectangles and the dotted arrows connecting them showing the relationships of interdependence. The component name and perhaps some additional information are defined inside the rectangle.

Example 9: UML Object Diagram — Safety Inspection
This diagram was created in ConceptDraw DIAGRAM using the UML Object Diagram Library from the Rapid UML Solution. An experienced user spent 10 minutes creating this sample.
This sample offers a UML Object Diagram designed to present the system of a safety inspection that is a really important part and the main focus on all stages of a software systems development process — design, project, requirements definition, realization, use, and maintenance. The Object Diagram is an instance of a Class Diagram that shows the relationships between objects and the state of a system at a certain point of time using the notation similar to the Class Diagram — the rectangles to represent objects and the solid lines to depict connections between them. You can observe the multiple links between the objects and entities identified by these objects in a given diagram. The Object diagram is a good snapshot of a modeled system, which allows successful discovering and illustrating the facts about specific model elements and their links. When the simulated system is very complex, it is exactly an Object Diagram that helps to present the smaller parts of the system in detail.

Example 10: UML Timing Diagram
This diagram was created in ConceptDraw DIAGRAM using the UML Timing Diagram Library from the Rapid UML Solution. An experienced user spent 10 minutes creating this sample.
This example demonstrates a UML Timing Diagram that focuses on time constraints, explores the behavior of objects, and how they interact with each other over a period of time. A Timing Diagram is a kind of Sequence Diagram in which axes are reversed. The diagram includes three separate swimlanes: User, ACSystem, and UserAccepted, and depicts how much time each process step takes. The timeline is placed on the x-axis at the bottom of a diagram and time increases from left to right. In general, the Timeline Diagram is the best way to find areas for improvement since it allows determining which process stages take much time, which means they are inefficient or overloaded, in order to carry out corresponding corrective actions. Make the UML Timing Diagram fast and easily by means of the Rapid UML solution online diagram tool and use the color differentiation for diagram swimlanes to make it better comprehensive for all stakeholders.

More Examples and Templates
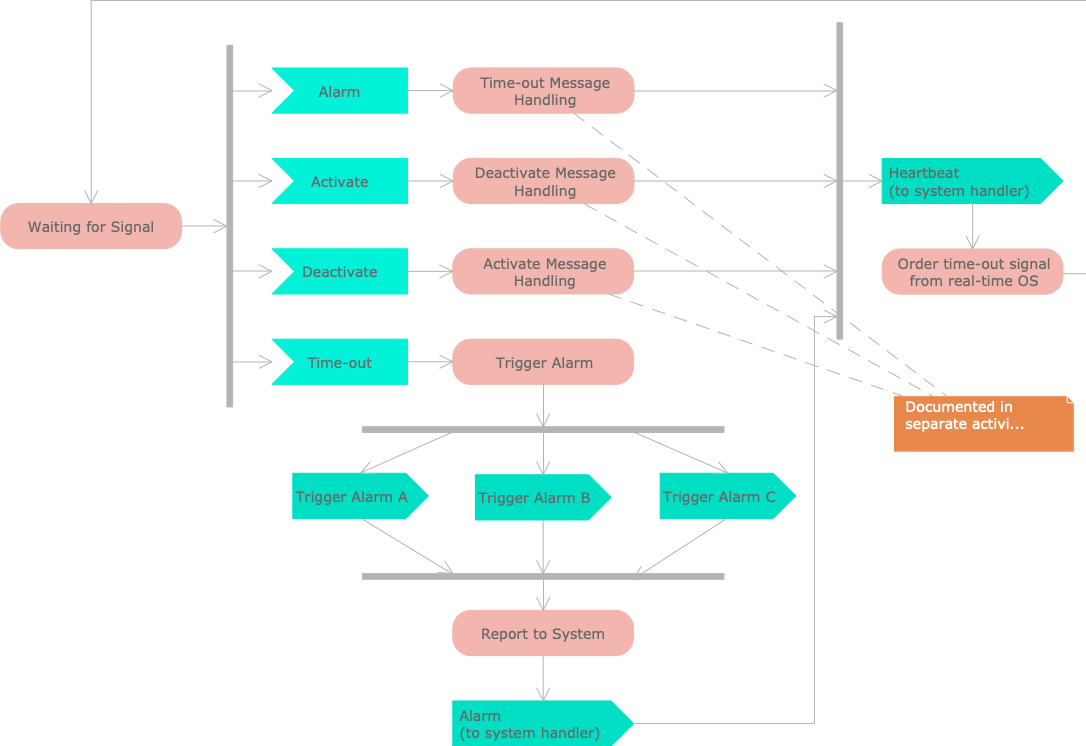
UML Activity Diagram — Alarm Trigger Processing
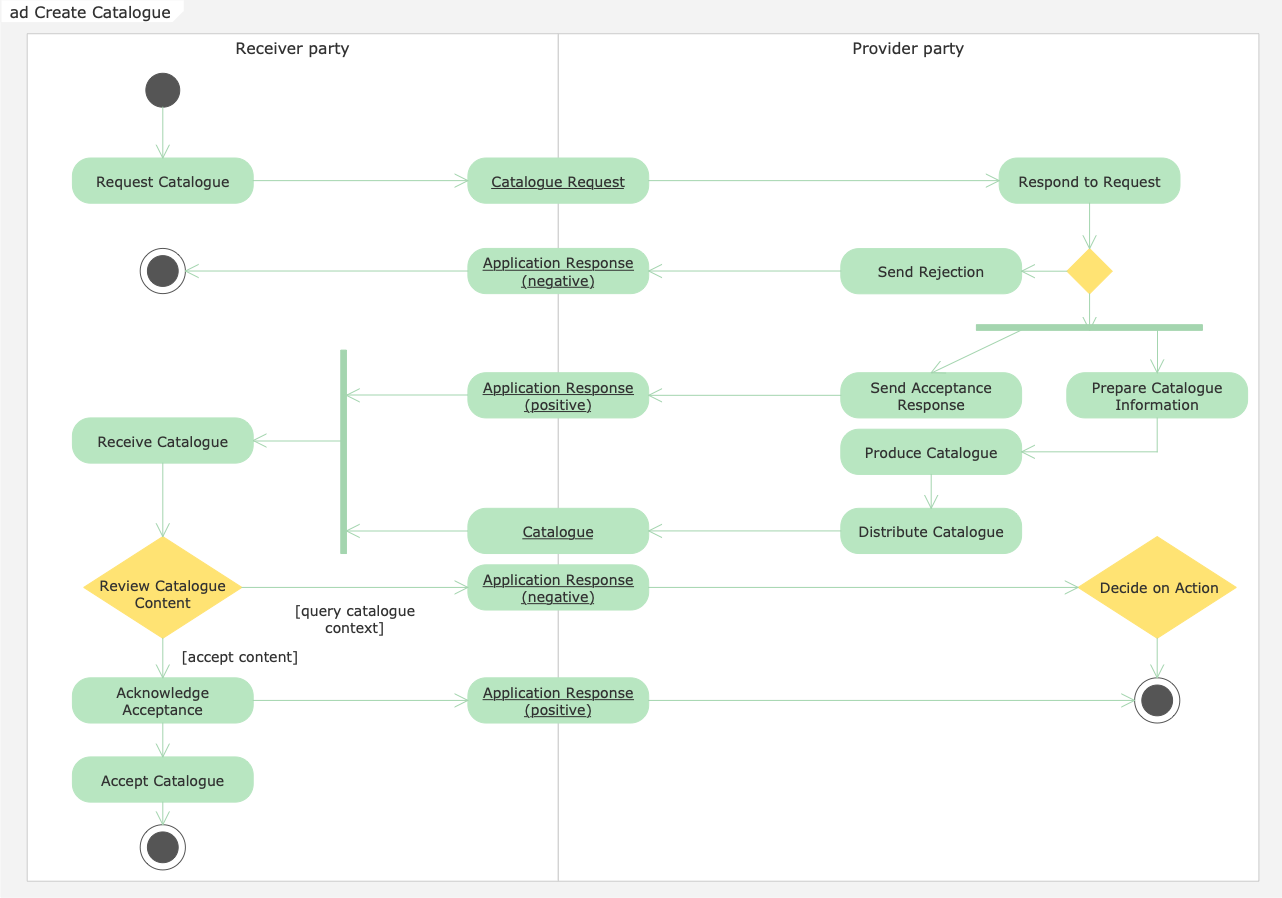
UML Activity Diagram — Catalogue Creation Process
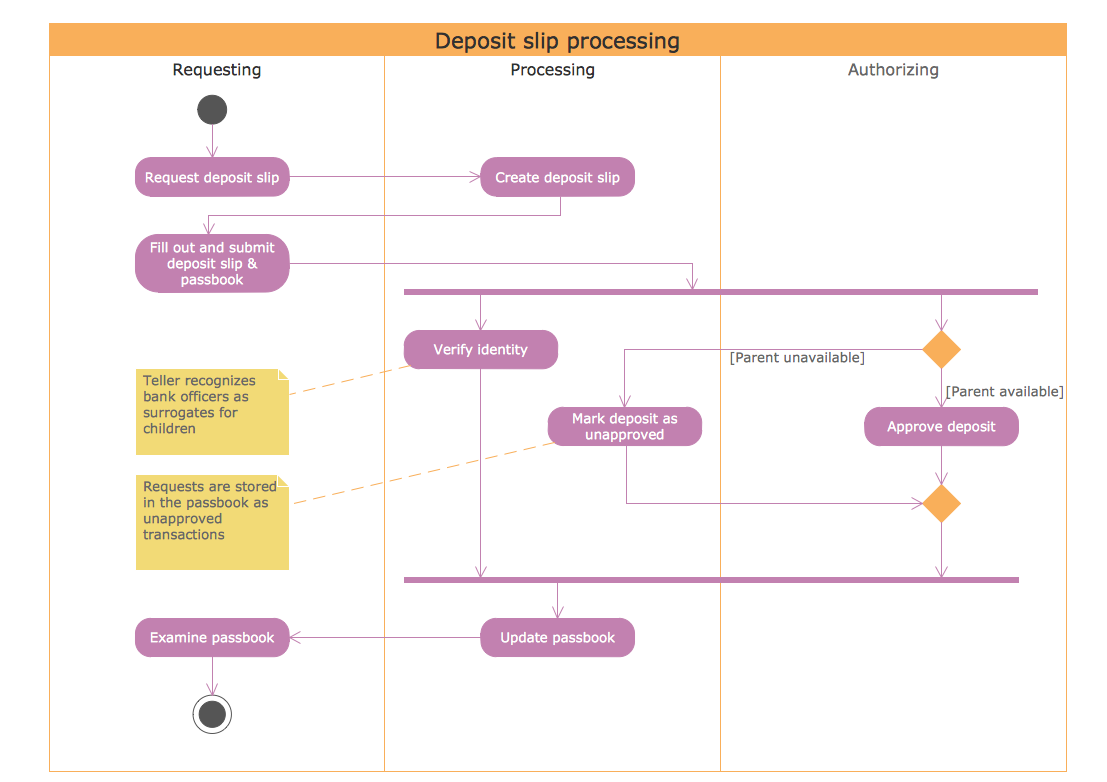
UML Activity Diagram — Deposit Slip Processing
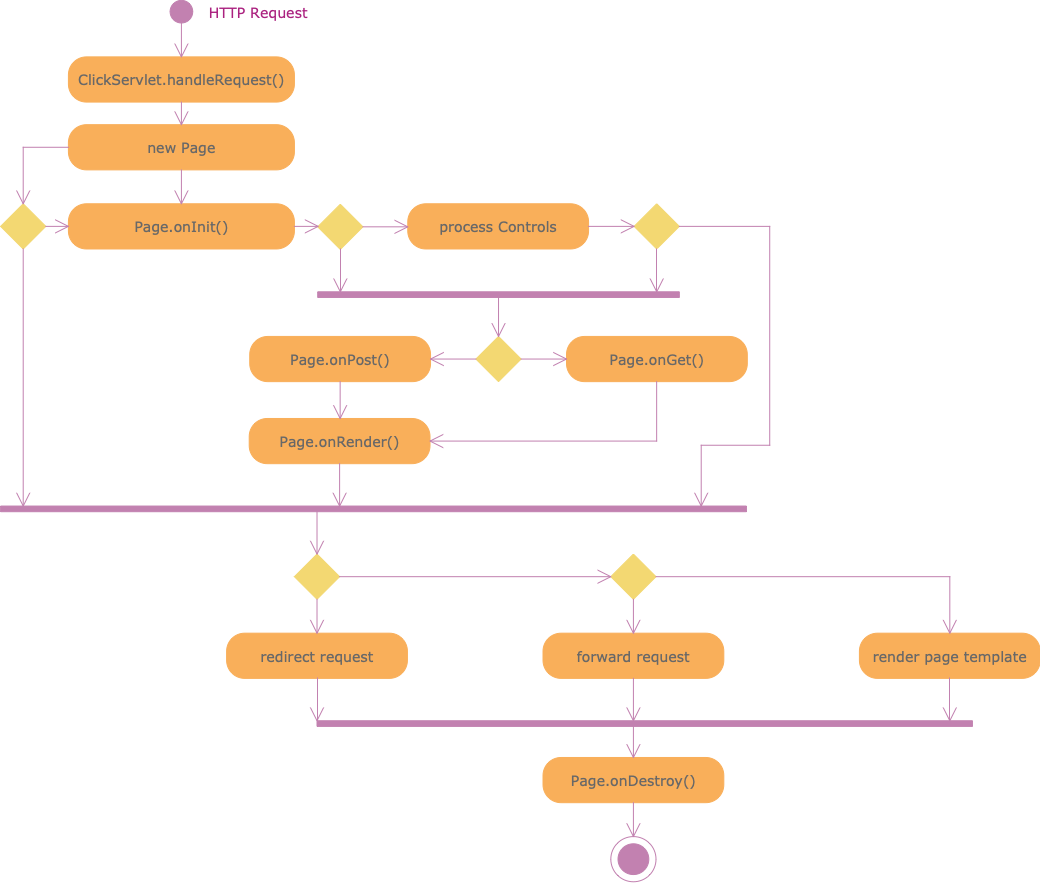
UML Activity Diagram — Servlet container
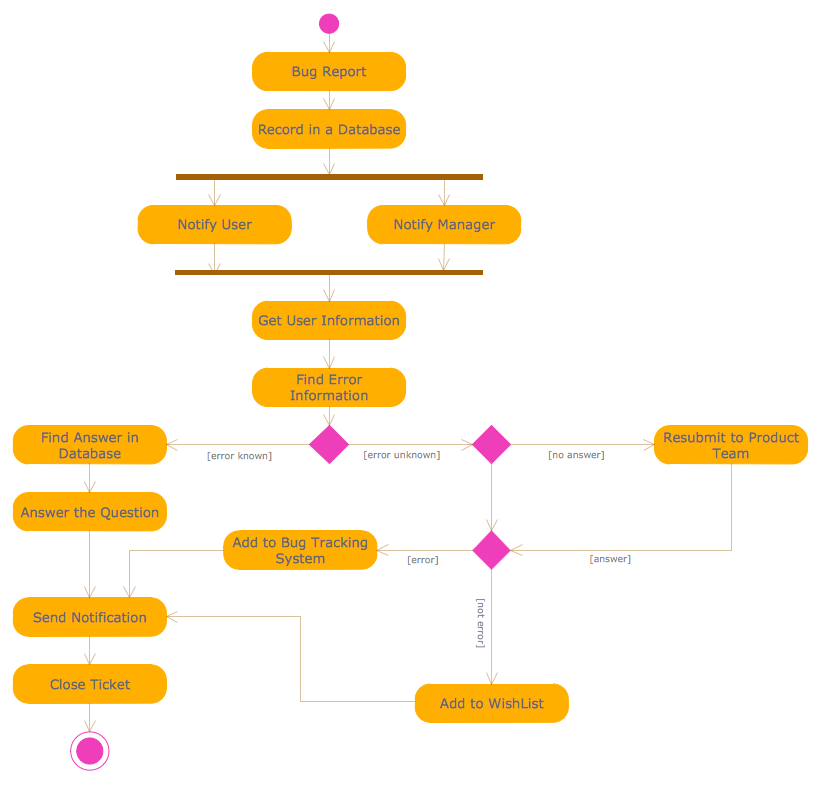
UML Activity Diagram — Ticket Processing System
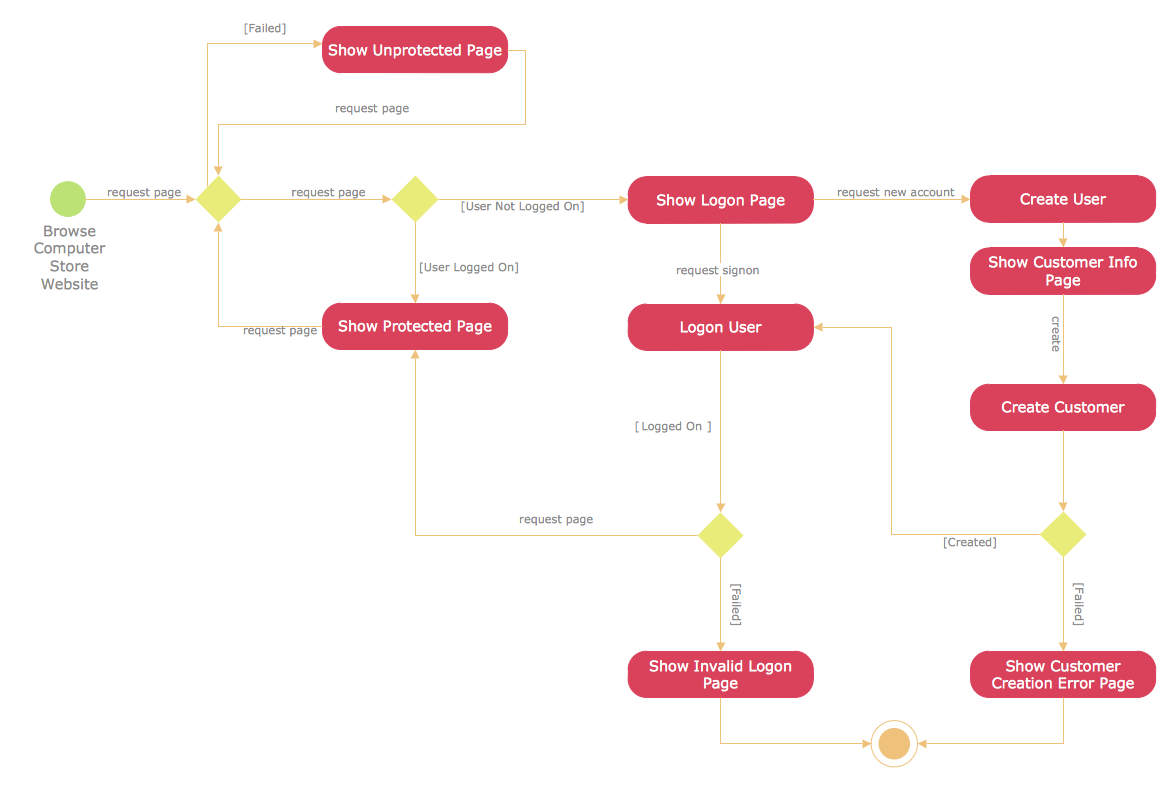
UML Activity Diagram — User Registration
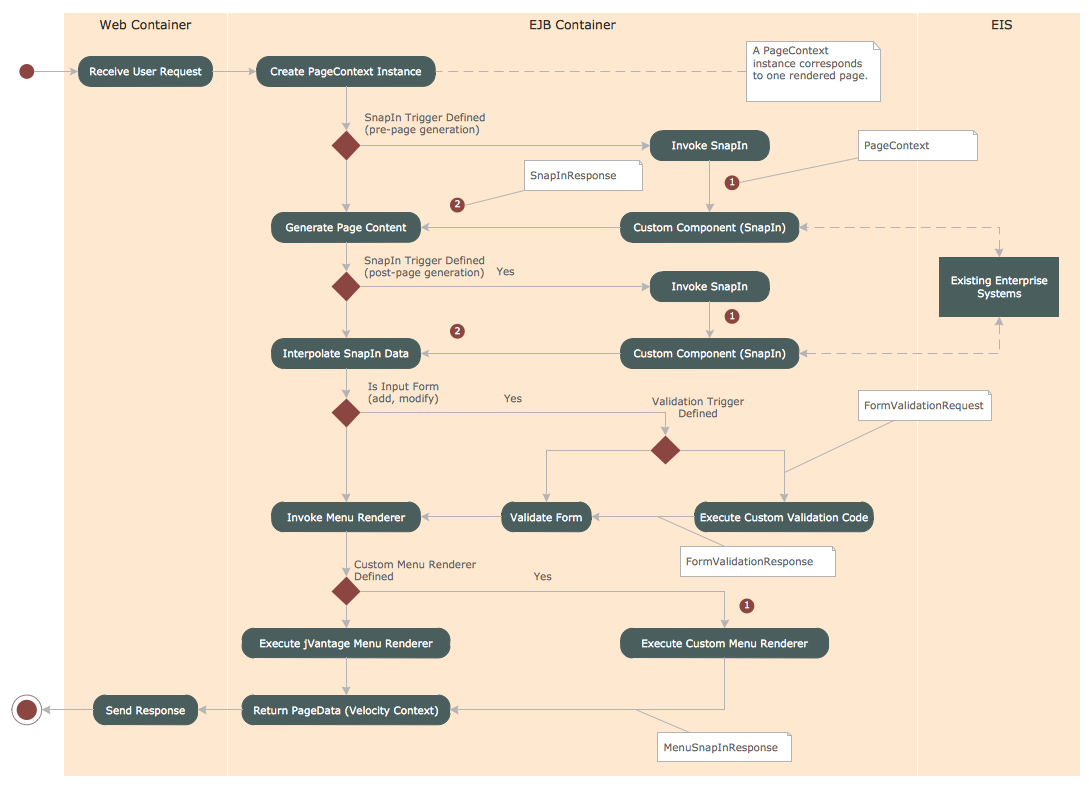
UML Activity Diagram — Snap in Process
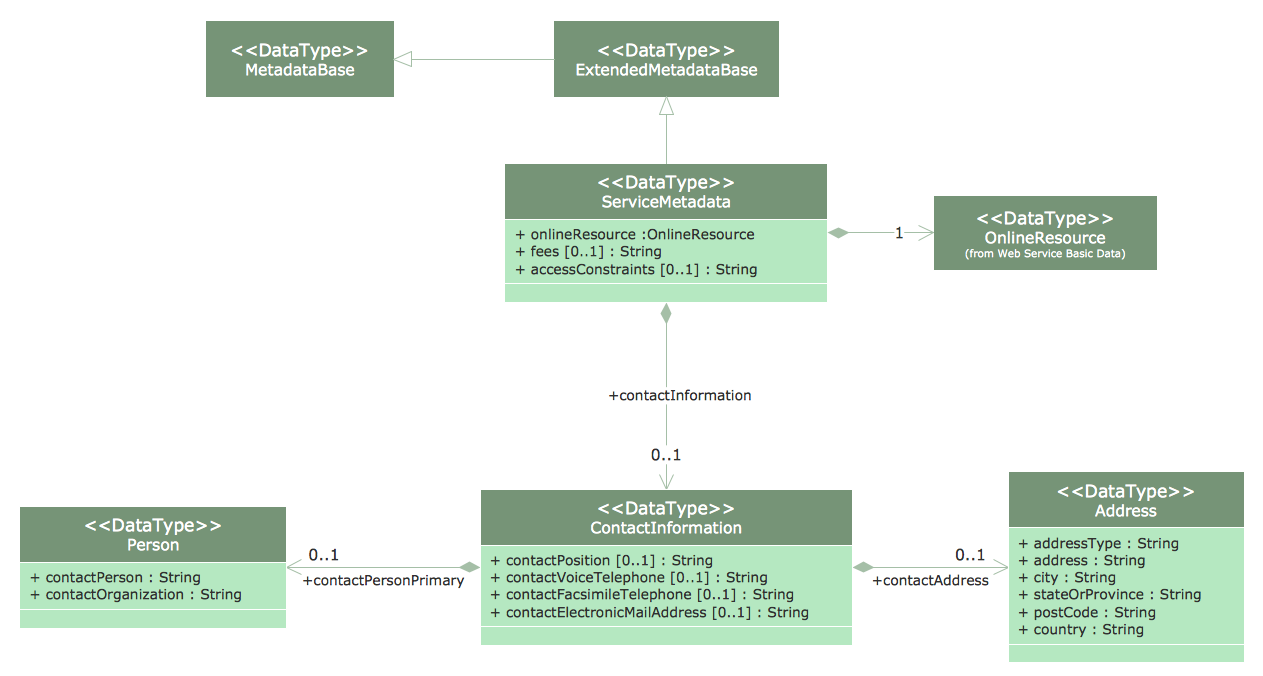
UML Class Diagram — Metadata Information Model
UML Component Diagram Template
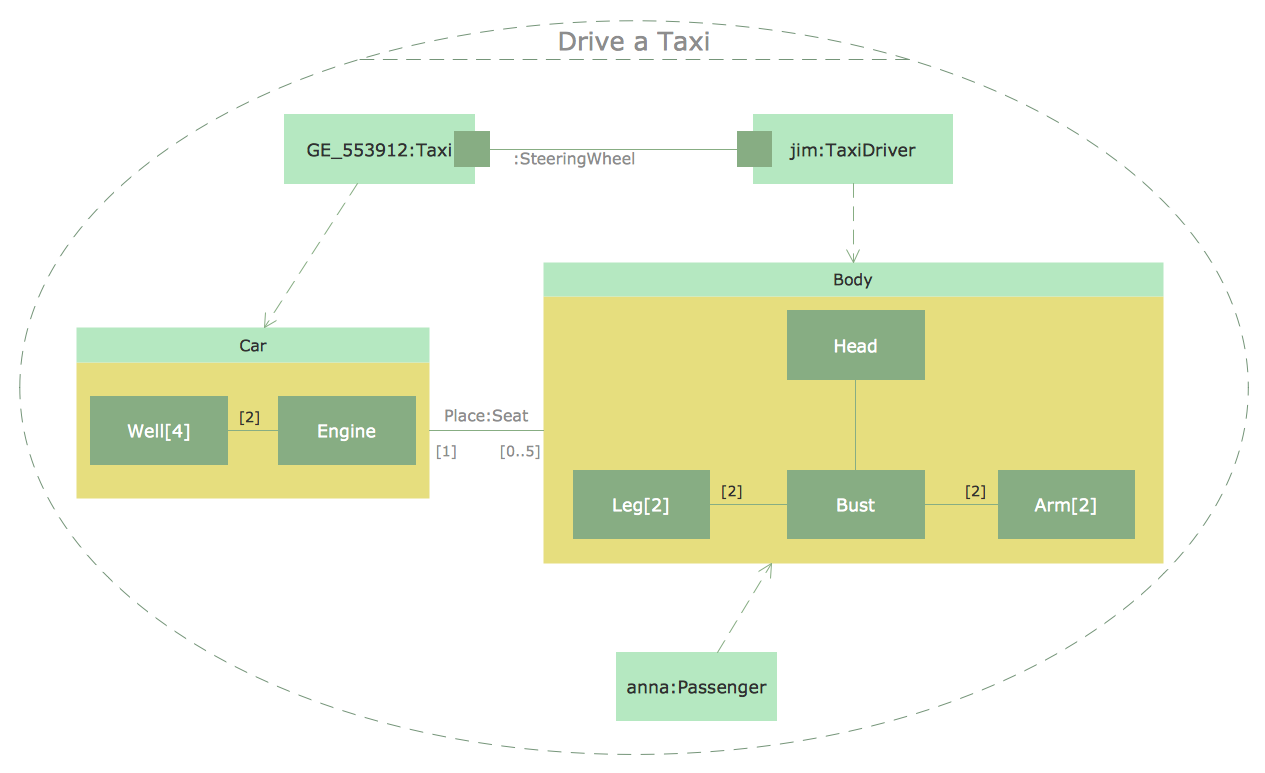
UML Composite Structure Diagram — Drive a Taxi
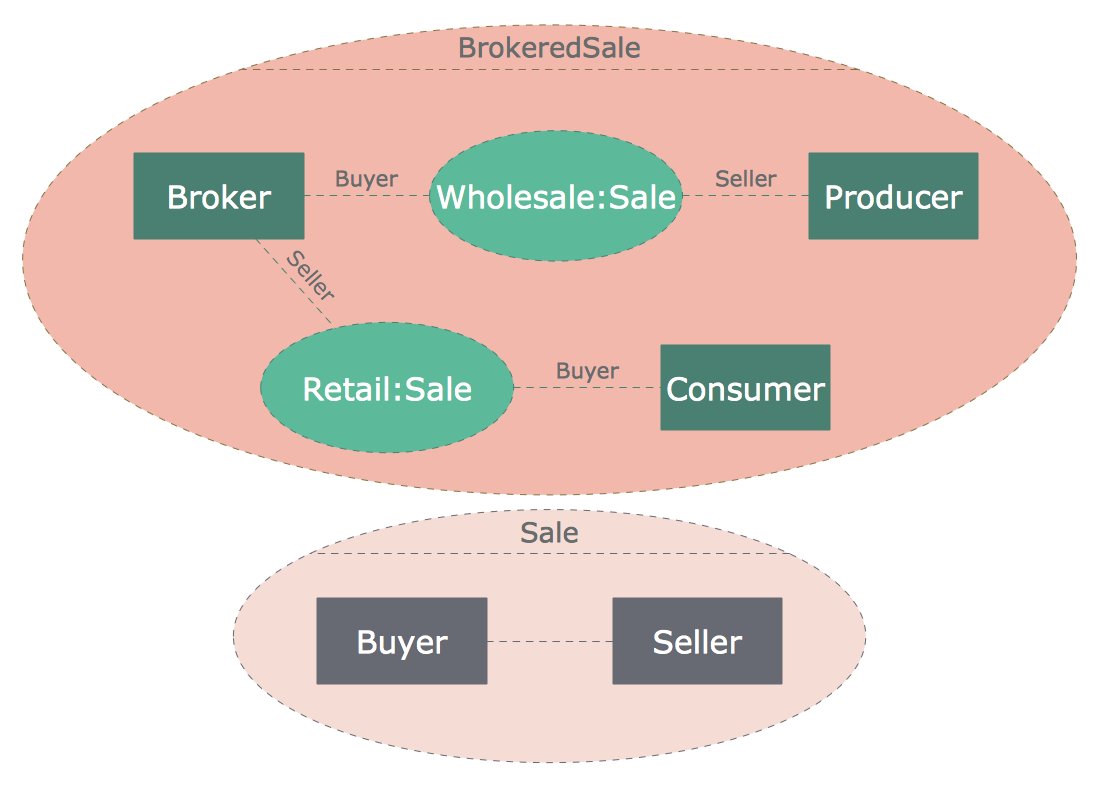
UML Composite Structure Diagram — Sale process
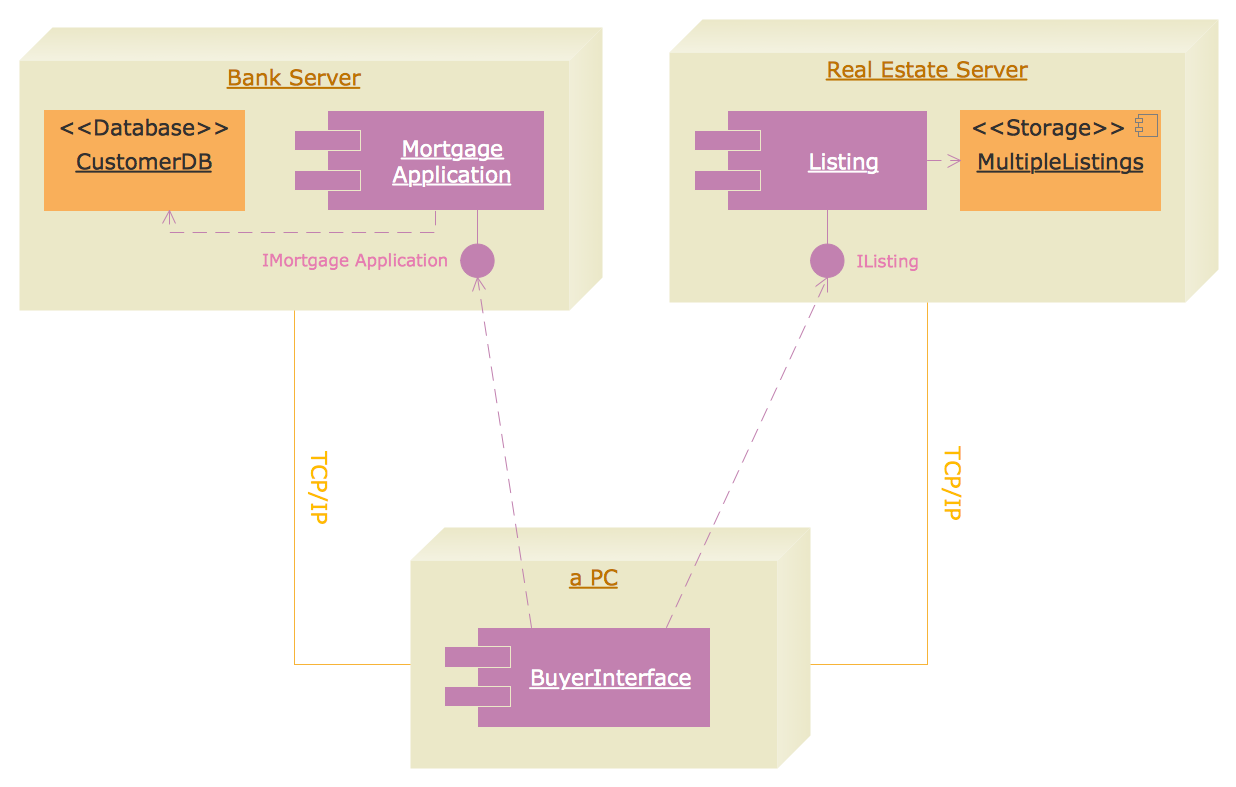
UML Deployment Diagram — Real Estate Transactions
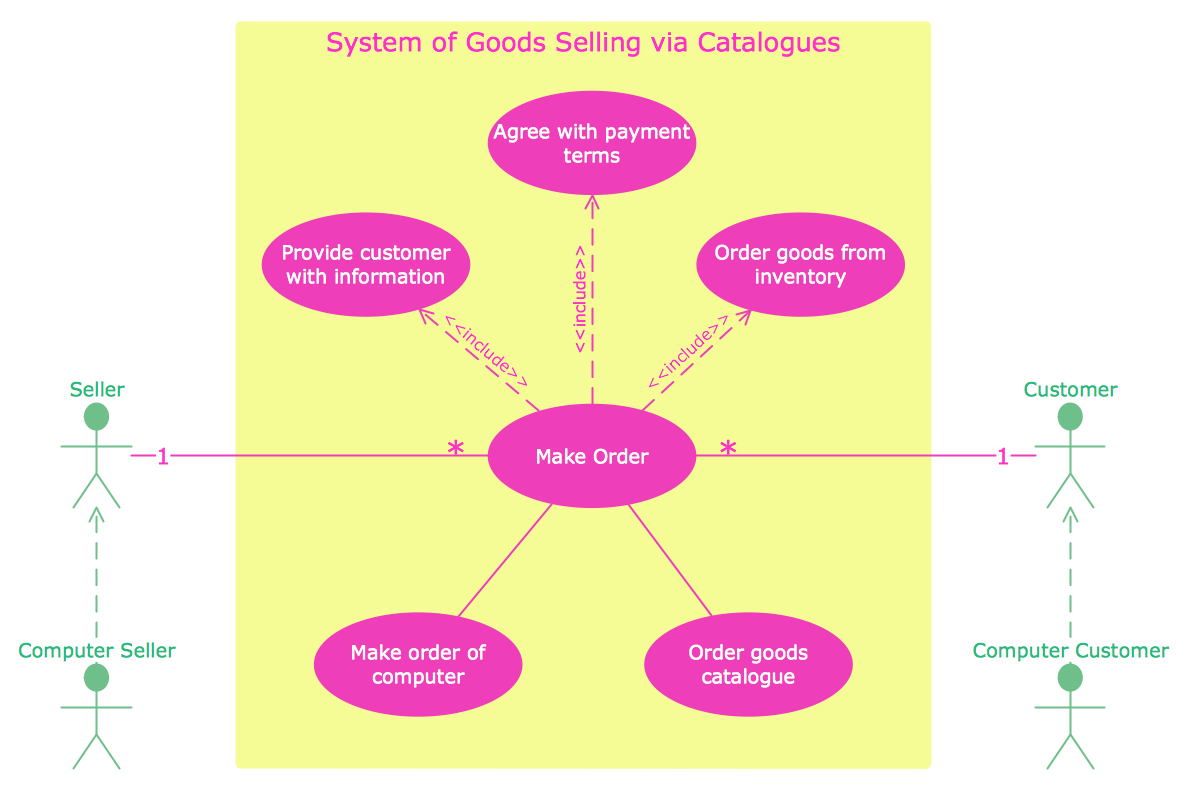
UML Use Case Diagram — System of Goods Selling via Catalogues
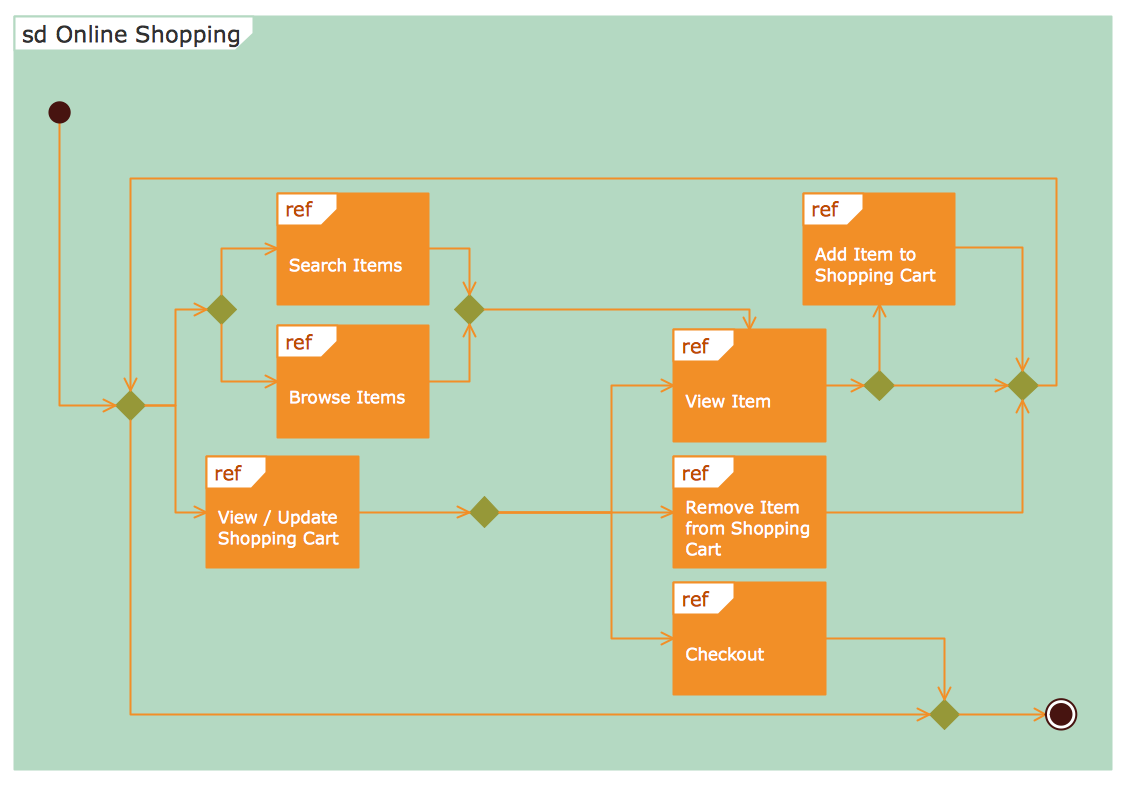
UML Interaction Overview Diagram
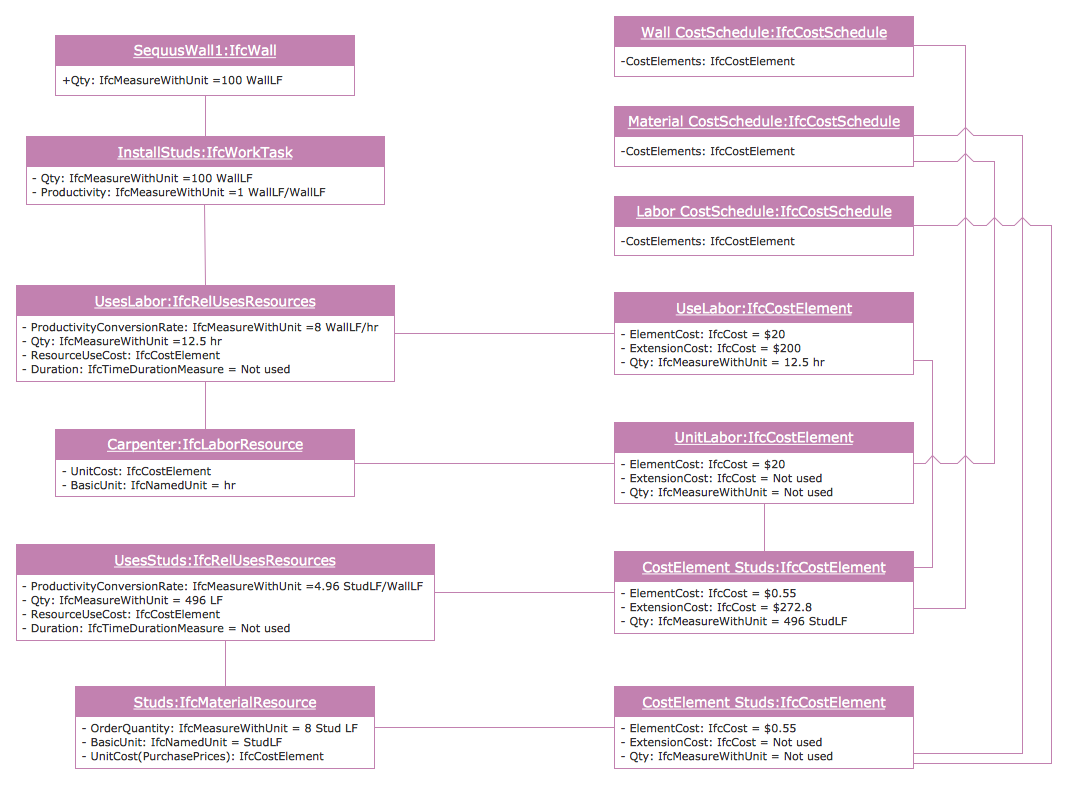
UML Object Diagram — Estimating Scenario
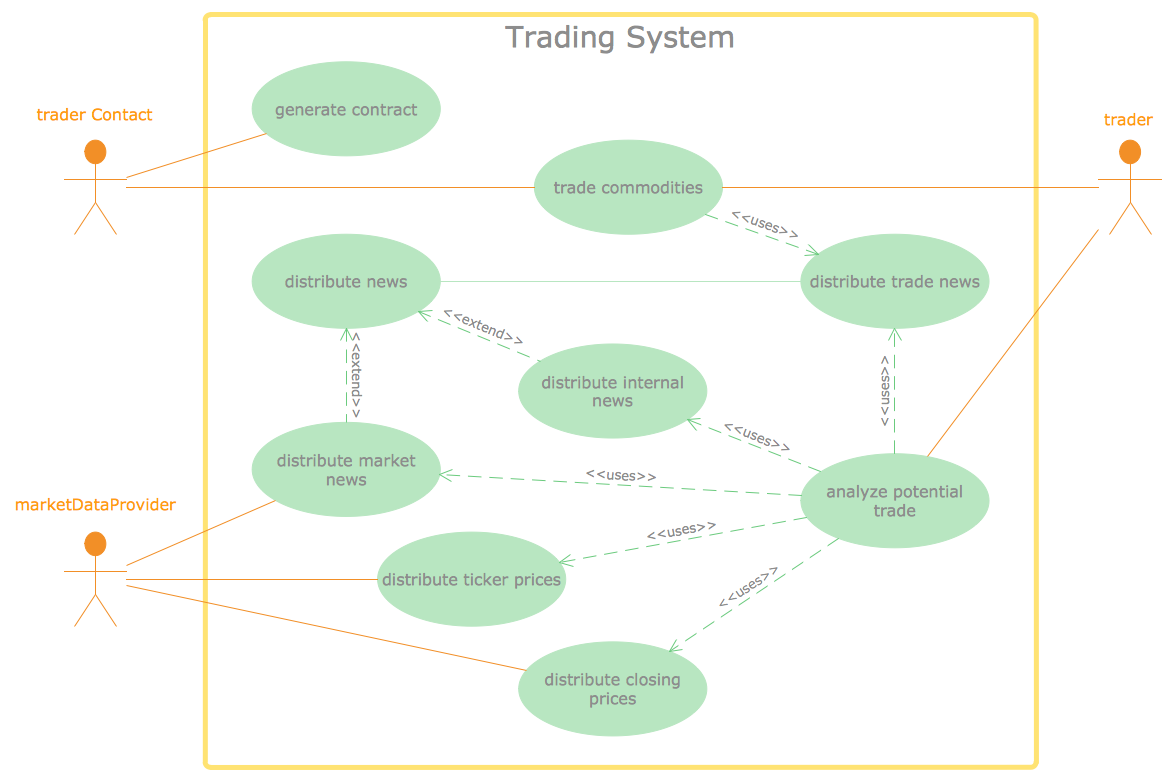
UML Use Case Diagram — Trading System Usage Scenarios
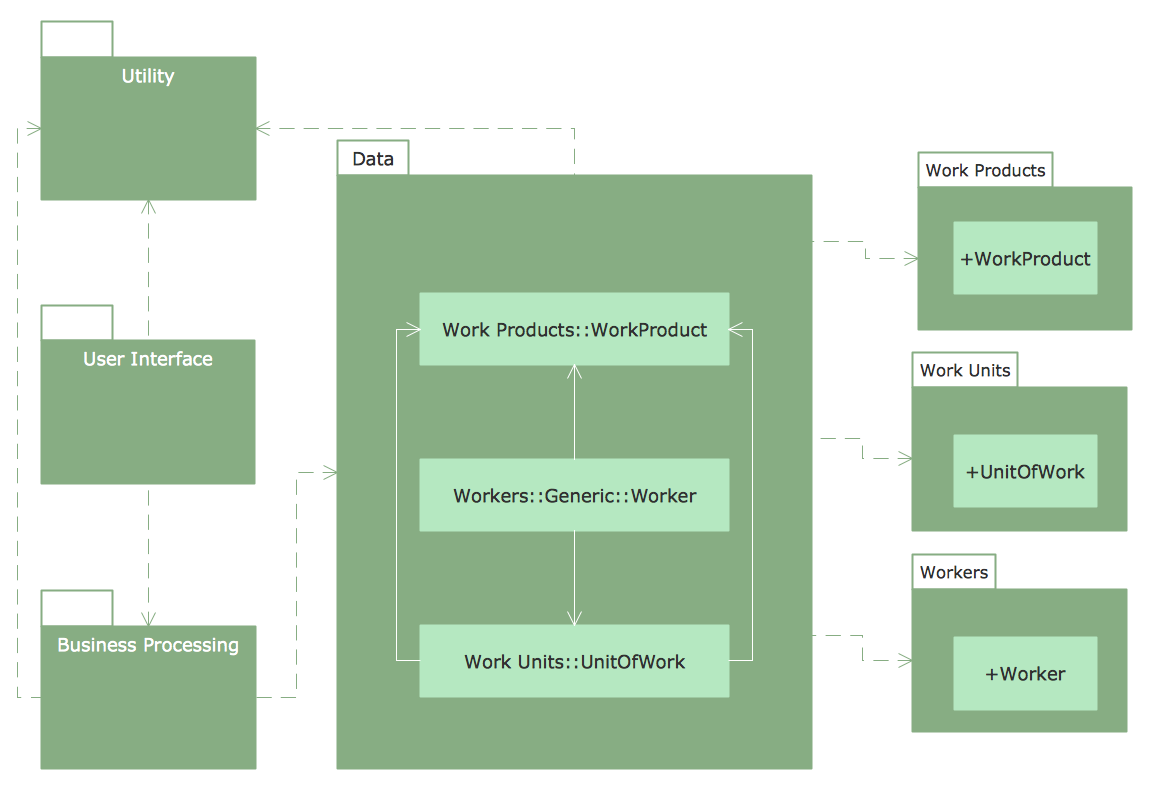
UML Package Diagram — Business Process
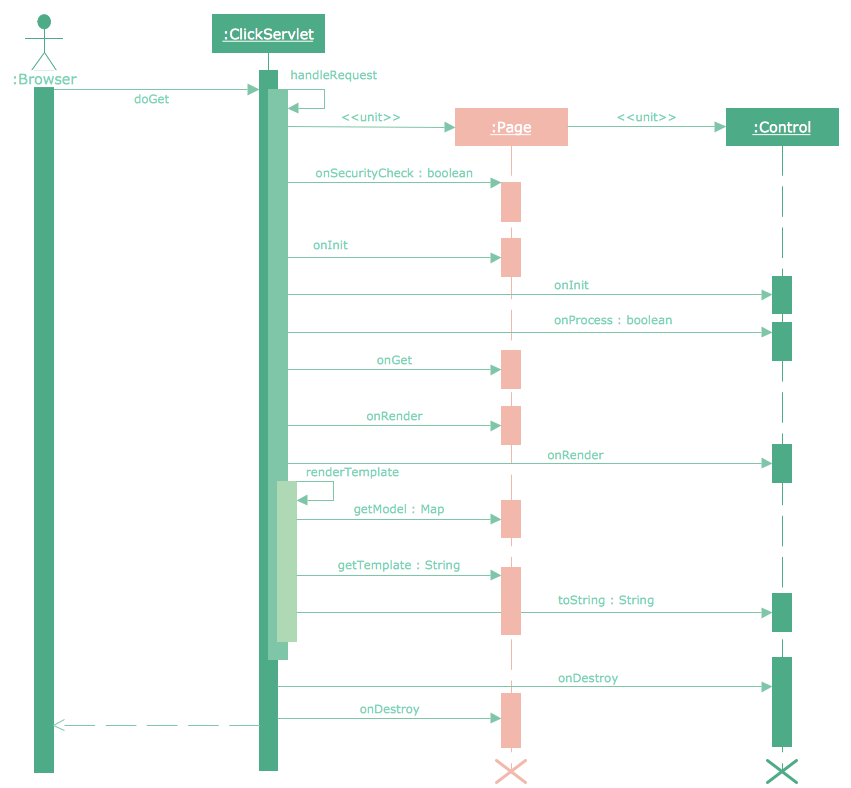
UML Sequence Diagram — GET Requests
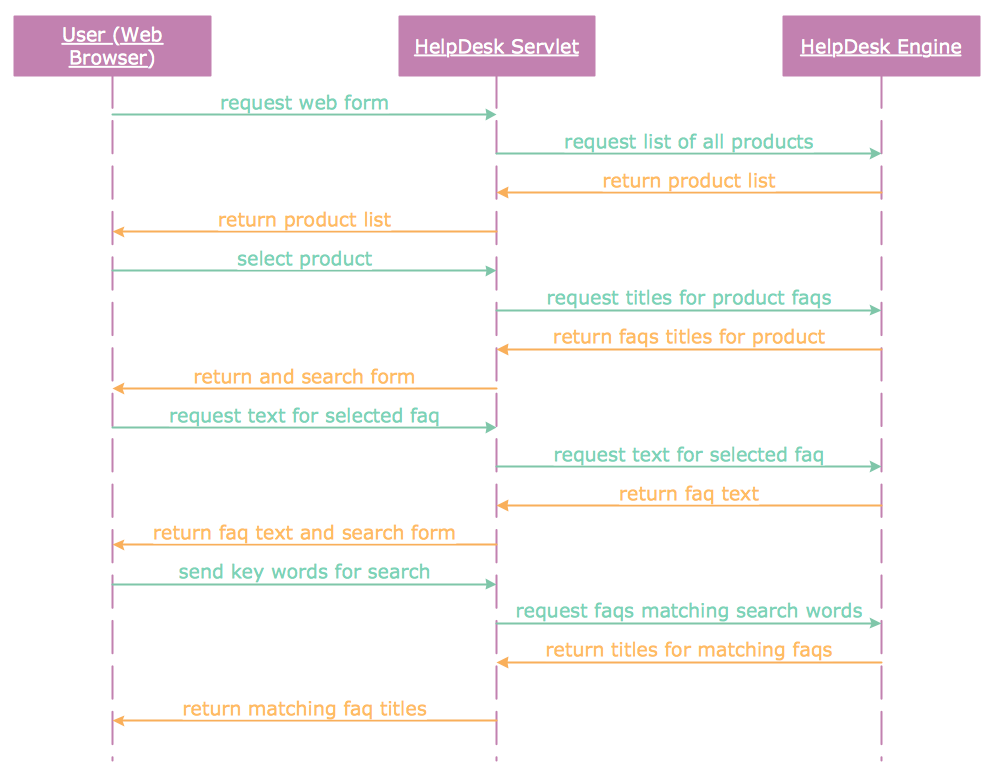
UML Sequence Diagram — Help Desk
UML Sequence Diagram — Ticket Processing System
Inside


What I Need to Get Started
Both ConceptDraw DIAGRAM vector diagramming and drawing software and the Rapid UML solution can help creating the software engineering diagrams you need. The Rapid UML solution can be found in the Software Development area of ConceptDraw STORE application that can be downloaded from this site. Make sure that both ConceptDraw DIAGRAM and ConceptDraw STORE applications are installed on your computer before you get started.
How to install
After ConceptDraw STORE and ConceptDraw DIAGRAM are downloaded and installed, you can install the Rapid UML solution from the ConceptDraw STORE.

Start Using
To make sure that you are doing it all right, use the pre-designed symbols from the stencil libraries from the solution to make your drawings look smart and professional. Also, the pre-made examples from this solution can be used as drafts so your own drawings can be based on them. Using the samples, you can always change their structures, colors and data.

UML diagrams as a tool for a software development team
As we progress into the 21st century, our reliance on computer and information systems to facilitate business is greater than ever before. The global market is too confused and adamant to work only on labor and record keeping; software systems are crucial to a company when handling large amounts of data processing, customer transactions, or client databases. As such, their development and maintenance has become a key component in successful company operations.
To structure, plan and manage the development of these systems, a software development life cycle (SDLC) is developed and respected. Different methodologies have evolved to be applied for different purposes, based on technical, organizational, project and team needs, but generally, all will use some combination of the following stages:
- Problem analyzing
- Market research
- Requirements analysis
- Design
- Implementation (coding)
- Testing
- Deployment
- Maintenance and bug fixing
How strictly this order is followed, and what level of planning and documentation is reached, will depend on the requirements of the business and capabilities of the software. A 'waterfall' approach to the SDLC would see each of these stages carried out in linear order, with detailed planning and risk assessment before coding is even begun. The 'extreme' approach involves a lot less planning and documentation, and focuses more on coding and continuous re-testing, ideal for a smaller system, or one where new components are being added as an ongoing process.
Modeling software development using UML diagrams
While going through each stage of the SLDC, it can be useful, and necessary, to produce a visual model of that process. A diagram of this kind presents a graphical view of a software system's structure, components and relationships, which allows the designer to organize and predict certain outcomes, as well as share system information with collaborators and clients.
The accepted standard used when modeling a system is known as Unified Modeling Language (UML), a generic set of notations that are used when creating UML diagrams. These notations can visually represent requirements, subsystems, logical and physical elements, and structural and behavioral patterns, that especially relevant to systems built using an object-oriented style.
Using UML during the modeling process has a number of benefits — for one, the entire development team can share information and collaborate using common language, diagrams and software, something that's not possible when using a more task-specific programming language. It allows team members creating system 'blueprints', diagrams that show system as a unified whole, but also offers the option to break that system down into component parts or processes.
In version 2.5, UML currently supports 14 different diagram techniques, which are considered the industry standard. These diagrams are broadly divided into two categories; first are static structure diagrams that describe the physical structure of a system. Then there are behavior diagrams that depict behavior and interactions of various system components. Here is a brief description what each diagram is and how it can be applied:
Static structure diagrams
Class diagrams — divide objects into 'classes', i.e. parts that share common attributes. Class defines the methods and variables of that object, and diagrams depict relationships and source code dependencies between them.

Component diagrams — display system components (physical or logical), interfaces and ports, and the connections between them. Allow analysts replacing and system checking individual parts rather than designing the process from scratch.
Composite structure diagrams — show the internal structure of a specific class, the role each element plays in collaboration with others, and how this affects how the class interacts with outside elements.
Deployment diagrams — model the physical deployment of artifacts (software systems) on nodes (normally hardware, e.g. laptop, mobile phone). Execution environment nodes are a 'node within a node', a software computing resource that displays hardware characteristics.
Object diagrams — represent a system overview. Similar to a class diagram, the take a snap-show of a system structure at a particular moment in time.
Package diagrams — packages are formed when UML elements are grouped together - classes, objects, use cases, components or nodes. A package diagram shows this grouping and dependencies between packages that make up a system. An example of use would be when modeling complex source code; packages are used to represent the different layers of code.

Profile diagrams — work at the metamodel level to show stereotypes as classes and profiles as packages. Allow the developer creating custom packages.
Behavior diagrams
Activity diagrams — can be said to resemble the flowcharts, showing steps in a software process as a workflow. Binary choices from each step, yes/no, true/false, make this a useful medium to describe software and coding logic.
State machine diagrams — describe the current state of a machine, which values are acting upon it. They show what actions the nodes of a software system take, dependent on explicit events.
Use case diagrams — show an actual example of system usage. Help define requirements for a software system, and can describe any possible form of interactions between users and that system.Interaction diagrams
Communication diagrams — display the interactions between objects in terms of a set of sequenced messages. They are used to create a birds-eye view of the collaboration between several objects, for a common purpose within the system.
Interaction overview diagrams — similar to action diagram which they show a workflow through a system, but simplify complex templates, turning each step into a nest of interactions in a broader overview of the action.
Sequence diagrams — useful for describing the interaction of objects in a specific time sequence. They can consist of parallel “life lines” that depict the state of objects at any given moment, and a sequence of time-ordered events that affect this state. From a software point of view, developers using this scheme can show simple execution scripts.

Timing diagrams — display the behavior of a given set of objects over a certain period of time.
ConceptDraw as a modeling tool
ConceptDraw strives to provide system designers and specialists with the optimal tools necessary for consistent and effective diagramming, maximizing possible output to keep up with the designer's speed of thought. The Rapid UML solution for ConceptDraw DIAGRAM was created for this purpose. Now UML diagrams can be created with the help of RapidDraw functionality, technology created by ConceptDraw that allows you to spawn each new step of a process with a single click of a button, rather than drag and drop each individual element of the diagram. This intuitive interface takes on most of the workload from the designers, allowing them to focus on the more creative aspects of their tasks.
The Rapid UML solution consists of numerous vector stencil libraries, containing the generic icons of the Unified Modeling Language. All graphics are professionally designed to adhere to industry standards, meaning UML diagrams created with ConceptDraw will be universally understood, and applicable for design purposes, presentations, or communicating ideas and defining requirements with other collaborators or end-users.
While acting an extremely useful and comprehensive tool for dedicated software specialists, ConceptDraw also provides tools and assistance for users of any level, looking to create diagrams of any complexity.
The Rapid UML solution is another high functioning, comprehensive solution from ConceptDraw, that pulls together a vast amount of material to help system analysts and designers create professional-looking, standardized UML diagrams.