- Electric and Telecom Plans Free
- Fire and Emergency Plans Free
- Floor Plans Free
- Plant Layout Plans Free
- School and Training Plans Free
- Seating Plans Free
- Security and Access Plans Free
- Site Plans Free
- Sport Field Plans Free
- Business Process Diagrams Free
- Business Process Mapping Free
- Classic Business Process Modeling Free
- Cross-Functional Flowcharts Free
- Event-driven Process Chain Diagrams Free
- IDEF Business Process Diagrams Free
- Logistics Flow Charts Free
- Workflow Diagrams Free
- ConceptDraw Dashboard for Facebook Free
- Mind Map Exchange Free
- MindTweet Free
- Note Exchange Free
- Project Exchange Free
- Social Media Response Free
- Active Directory Diagrams Free
- AWS Architecture Diagrams Free
- Azure Architecture Free
- Cisco Network Diagrams Free
- Cisco Networking Free
- Cloud Computing Diagrams Free
- Computer Network Diagrams Free
- Google Cloud Platform Free
- Interactive Voice Response Diagrams Free
- Network Layout Floor Plans Free
- Network Security Diagrams Free
- Rack Diagrams Free
- Telecommunication Network Diagrams Free
- Vehicular Networking Free
- Wireless Networks Free
- Comparison Dashboard Free
- Composition Dashboard Free
- Correlation Dashboard Free
- Frequency Distribution Dashboard Free
- Meter Dashboard Free
- Spatial Dashboard Free
- Status Dashboard Free
- Time Series Dashboard Free
- Basic Circle-Spoke Diagrams Free
- Basic Circular Arrows Diagrams Free
- Basic Venn Diagrams Free
- Block Diagrams Free
- Concept Maps Free
- Family Tree Free
- Flowcharts Free
- Basic Area Charts Free
- Basic Bar Graphs Free
- Basic Divided Bar Diagrams Free
- Basic Histograms Free
- Basic Line Graphs Free
- Basic Picture Graphs Free
- Basic Pie Charts Free
- Basic Scatter Diagrams Free
- Aerospace and Transport Free
- Artwork Free
- Audio, Video, Media Free
- Business and Finance Free
- Computers and Communications Free
- Holiday Free
- Manufacturing and Maintenance Free
- Nature Free
- People Free
- Presentation Clipart Free
- Safety and Security Free
- Analog Electronics Free
- Audio and Video Connectors Free
- Basic Circuit Diagrams Free
- Chemical and Process Engineering Free
- Digital Electronics Free
- Electrical Engineering Free
- Electron Tube Circuits Free
- Electronic Block Diagrams Free
- Fault Tree Analysis Diagrams Free
- GHS Hazard Pictograms Free
- Home Automation and Wiring Free
- Mechanical Engineering Free
- One-line Diagrams Free
- Power Сircuits Free
- Specification and Description Language (SDL) Free
- Telecom and AV Circuits Free
- Transport Hazard Pictograms Free
- Data-driven Infographics Free
- Pictorial Infographics Free
- Spatial Infographics Free
- Typography Infographics Free
- Calendars Free
- Decision Making Free
- Enterprise Architecture Diagrams Free
- Fishbone Diagrams Free
- Organizational Charts Free
- Plan-Do-Check-Act (PDCA) Free
- Seven Management and Planning Tools Free
- SWOT and TOWS Matrix Diagrams Free
- Timeline Diagrams Free
- Australia Map Free
- Continent Maps Free
- Directional Maps Free
- Germany Map Free
- Metro Map Free
- UK Map Free
- USA Maps Free
- Customer Journey Mapping Free
- Marketing Diagrams Free
- Matrices Free
- Pyramid Diagrams Free
- Sales Dashboard Free
- Sales Flowcharts Free
- Target and Circular Diagrams Free
- Cash Flow Reports Free
- Current Activities Reports Free
- Custom Excel Report Free
- Knowledge Reports Free
- MINDMAP Reports Free
- Overview Reports Free
- PM Agile Free
- PM Dashboards Free
- PM Docs Free
- PM Easy Free
- PM Meetings Free
- PM Personal Time Management Free
- PM Planning Free
- PM Presentations Free
- PM Response Free
- Resource Usage Reports Free
- Visual Reports Free
- House of Quality Free
- Quality Mind Map Free
- Total Quality Management TQM Diagrams Free
- Value Stream Mapping Free
- Astronomy Free
- Biology Free
- Chemistry Free
- Language Learning Free
- Mathematics Free
- Physics Free
- Piano Sheet Music Free
- Android User Interface Free
- Class Hierarchy Tree Free
- Data Flow Diagrams (DFD) Free
- DOM Tree Free
- Entity-Relationship Diagram (ERD) Free
- EXPRESS-G data Modeling Diagram Free
- IDEF0 Diagrams Free
- iPhone User Interface Free
- Jackson Structured Programming (JSP) Diagrams Free
- macOS User Interface Free
- Object-Role Modeling (ORM) Diagrams Free
- Rapid UML Free
- SYSML Free
- Website Wireframe Free
- Windows 10 User Interface Free
Block Diagrams
Block diagram is a diagram of such a system where the principal functions are depicted with the help of blocks. These blocks are usually connected by lines and such lines are known to be representing the relationships of the blocks.
Being widely used in engineering in electronic design, hardware design, software design and other kinds of engineering activity, Block diagrams are usually used for providing less detailed descriptions, being intended to clarify all the overall concepts having no concern for the details of implementation.
Making an analogy to the map-making world, any Block diagram is known to have a few similarities to a highway map. The major cities may be listed but the minor county roads and the city streets are not mentioned in this drawing.
Providing the ConceptDraw DIAGRAM diagramming and drawing software’s users with the pre-made templates, samples and stencil libraries full of vector elements, Block Diagrams solution can be used for drawing any needed Block diagram, Functional block diagram, or Block flow diagram.
Using the created Block diagrams for visualizing the high-level concepts of engineering, software system design and business, any business owner has a chance to succeed in doing what he is meant to.
Using all five stencil libraries that contain 190 vector stencils taken from the Block Diagrams solution as well as the examples, it may become possible to make the needed drawing within only a few minutes by editing the existing ones.
Many business specialists, business owners, and project managers will find the ConceptDraw DIAGRAM block diagram creator with Block Diagrams solution useful for drawing the 2D and 3D Block diagrams as using the pre-designed objects from the solution’s libraries can simplify the work of drawing making it possible to complete the tasks within only a few minutes.
-
Install this solution Free -
What I need to get started -
Solution Requirements - This solution requires the following products to be installed:
ConceptDraw DIAGRAM v17 - This solution requires the following products to be installed:
-
Compatibility - Monterey (12), Ventura (13), Sonoma (14)
MS Windows 8.1, 10 - Monterey (12), Ventura (13), Sonoma (14)
-
Support for this Solution -
Helpdesk
There are 5 libraries containing 190 vector stencils in the Block Diagrams solution.
Design Elements — Block Diagrams

Design Elements — Blocks Raised

Design Elements — Callouts

Design Elements — Blocks Diagrams, Connectors

Design Elements — Blocks with Perspective

Examples
There are a few samples that you see on this page which were created in the ConceptDraw DIAGRAM application by using the Block Diagrams solution. Some of the solution's capabilities as well as the professional results which you can achieve are all demonstrated here on this page.
All source documents are vector graphic documents which are always available for modifying, reviewing and/or converting to many different formats, such as MS PowerPoint, PDF file, MS Visio, and many other graphic ones from the ConceptDraw Solution Park or ConceptDraw STORE. The Block Diagrams solution is available to all ConceptDraw DIAGRAM users to get installed and used while working in the ConceptDraw DIAGRAM diagramming and drawing software.
Example 1: Block Diagram — Document Management System Architecture
This diagram was created in ConceptDraw DIAGRAM using the combination of libraries from the Block Diagrams Solution. An experienced user spent 10 minutes creating this sample.
This sample shows the parts of a document management system (DMS) that is a computer system aimed to track and store the electronic documents, manage the versions, realize the digital asset management and content management, provide metadata, security, indexing, and retrieval capabilities, document imaging, workflow systems, and records management systems. The Document management systems also allow maintaining the document files, describing the document processing, managing routing, and process monitoring tools, provide the free routing of documents, support for personal queues of users, navigation and organization the presentation of information about documents, and allow implementation of many other functions, including the history tracking, i.e. the tracking of different versions modified by varied users. The parts of the DMS architecture are represented as 3D blocks. Drawing the 3D diagrams is a quite complex process, but using the predesigned objects from the ConceptDraw's Block Diagrams solution libraries you can design your 3D block diagrams in a few minutes.

Example 2: Block Diagram — Types of Individual Behavior in Organization
This diagram was created in ConceptDraw DIAGRAM using the combination of libraries from the Block Diagrams Solution. An experienced user spent 15 minutes creating this sample.
This sample diagram represents the types of individual behavior in an organization in view of an individual’s understanding of the need, will, importance, relevance, etc. Organizational behavior is a modern field of study intended to provide special researches within an organization to improve the effectiveness of its work. For this purpose, the exploration of the impact of groups, structures, and individuals on the behavior in an organization is realized. Such domains as psychology, communication, sociology, management are involved during the researches. The organizational behavior science or study successfully complements the organizational theory and human resource studies. This diagram is a Functional Block diagram, which has a hierarchical structure. It is strict and clear, three main groups of individual behavior types are represented (forced, desirable, conscious), and the causes that eventually lead to inefficiency, uncertain efficacy or high efficacy are described. Moreover, the blocks are visually colored according to their level in the diagram.

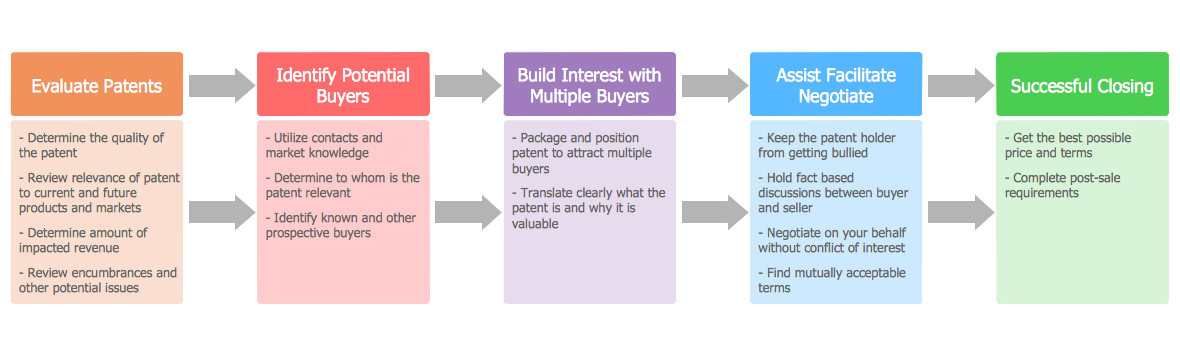
Example 3: Block Diagram — Total Solution Process
This diagram was created in ConceptDraw DIAGRAM using the combination of libraries from the Block Diagrams Solution. An experienced user spent 10 minutes creating this sample.
This sample shows the Block diagram describing the various stages of the total solution process for organizations. The problem-solving process is always relevant because the task of finding the problem's solution is a common task for any field in which you work and supposes the use of generic or special methods in order to find a solution. The professional-looking Block diagrams are useful for illustration in documents and presentations. The bright blocks you see in this diagram attract attention and are easy to remember. The diagrams describing the types of problems to be solved, the methods and techniques of their solving, and many other points can be easily depicted in a visual form with ConceptDraw DIAGRAM block diagram creator. The ConceptDraw's Block diagrams solution allows designing professional-looking Block diagrams describing different techniques of effective solving the problems in varied fields: computer science, software development, sales, marketing, engineering, mathematics, artificial intelligence, medicine, etc.

Example 4: Block Diagram — Winning Qualities
This diagram was created in ConceptDraw DIAGRAM using the combination of libraries from the Block Diagrams Solution. An experienced user spent 5 minutes creating this sample.
This sample represents the Block diagram of the main qualities, which lead to winning. There are included goals, commitment, reliability, actions, results, and principles. The personal qualities of each employee and especially the company's leader have a direct impact on the company's development and effectiveness of the entire team, success and improvement of the organization. The winning qualities of employees greatly influence their personal growth, they include all the skills, abilities and traits that lead a person to outstanding results. The list of winning qualities is extensive and is often individual for each person. In this way, the Human Resources Development (HRD) theory lies at the base of the individuals improvement and organization performance, and includes the employees development and training them with a goal to enhance their key competencies, to increase the level of training, to uncover the potential qualities and abilities, to allow the fast reacting on the changeable conditions.

Example 5: Block Diagram — Stages of Promise Issue
This diagram was created in ConceptDraw DIAGRAM using the combination of libraries from the Block Diagrams Solution. An experienced user spent 10 minutes creating this sample.
This Block diagram sample illustrates the five stages of promise issue: measurement of expectation level in every segment, quality of service standards are determined for every segment, guarantee of conditions to redeem promises, formulation of promises (clear and examinable formal obligations), and finally fulfillment of obligations (delivery organization in concordance with determinate standards). The service quality constitutes the comparison of the expectations with performance and is one of the basic characteristics in a service industry because any business is successful only when it offers the high-quality service, satisfies the needs and expectations of clients, at this remaining economically competitive on the market. The increase of the service quality leads to an increase in economic competitiveness and can be achieved by means of a clear understanding of operational processes, improving them, quick and systematical identifying problems, setting actual and reliable service performance measures, measuring the satisfaction of customers and other performance outcomes.

Example 6: Block Diagram — Sources of Customer Satisfaction
This diagram was created in ConceptDraw DIAGRAM using the combination of libraries from the Block Diagrams Solution. An experienced user spent 5 minutes creating this sample.
This sample shows the Block Diagram illustrating the sources of customer satisfaction. Any customer has some expectations before purchasing some product or service, which can be justified or not when the purchase was realized. A "customer satisfaction" is a key performance indicator within business and marketing, the term is widely used to reflect in what measure the products and services provided by the company meet the customers' expectations and maybe even surpass them. This term can be also considered as the percentage of customers, which reported experience with a company, specific products, or services surpass the specified satisfaction goals, to the customers' total number. Typically, in a competitive marketplace the customer satisfaction is the main indicator and a key element of business strategy because at the fields where the businesses compete for the clients, one can observe the great efforts making to attract the customers and withhold them by means of satisfying their needs and requirements.

Example 7: Block Diagram — Six Markets Model
This diagram was created in ConceptDraw DIAGRAM using the combination of libraries from the Block Diagrams Solution. An experienced user spent 5 minutes creating this sample.
This Block diagram sample represents the Six market model, which was intended by three specialists from the Cranfield University in 1991 — Christopher, Payne, and Ballantyne, and determines the main kinds of the markets. The six markets are allocated and have the central position in relationship marketing: internal markets, recruitment markets, influencer markets, customer markets, referral markets, and supplier markets. The diagram visually depicts them as boxes around the middle "organization" box. The listed markets are different, with their own specialties, require the own explicit strategies and individual complex of marketing actions, so are allocated in separate categories. At the same time for the best success of an organization, it is recommended to realize the marketing activities at each of these markets. Thus, referral markets offer the best use of resources and represent the development and implementation of a marketing plan to stimulate referrals; supplier markets ensure a long-term conflict-free relationship and allow reducing costs at the improvement quality; influence markets include a wide range of sub-markets, etc.

Example 8: Block Diagram — Planning Process
This diagram was created in ConceptDraw DIAGRAM using the combination of libraries from the Block Diagrams Solution. An experienced user spent 10 minutes creating this sample.
This Block diagram sample illustrates the step-by-step planning process, which supposes the organization of actions for achieving desired goals and their preliminary thorough thinking-out. The planning obligatory includes the creation of a plan, its maintenance and refinement, and even integration with other plans. You can observe the following steps in the diagram: understanding an organization environment, mission, and purposes; defining and formulating the preliminary purposes; realization of audit of the current situation; conducting the SWOT analysis; adjusting of estimates; redefining purposes, if needed; selecting the correct strategy; implementation the preplanning; measuring and estimating results. The planning process is closely related to forecasting, it offers the overall overseeing of future scenario and prediction the future, as well as provides the ready scenarios of how to react on each variant of events development. These main steps of the planning process are visually depicted in this Block flow diagram and highlighted with different colors for the convenience of their perception.

Example 9: Block Diagram — Gap Model of Service Quality
This diagram was created in ConceptDraw DIAGRAM using the combination of libraries from the Block Diagrams Solution. An experienced user spent 15 minutes creating this sample.
This Block diagram sample demonstrates the gap model or the service quality model developed by three people from Texas and North Carolina in 1985 — Parasuraman, Zeithaml, and Berry. Typically, the customers compare the achieved or experienced services with their own expectations and in this regard can happen different situations — when the expectations correspond to the reality and when not. In the last case, when the expected service and perceived one are unequal, the gap arises. This diagram represents five possible gaps that finally can cause unsuccessful delivery. The customer’s part of the diagram includes the perceived service and expected service that in its turn is determined by such factors as the word of mouth, personal needs, and past experience. The provider’s part of the diagram contains the management perceptions of consumer expectations, translation of perceptions into service quality specifications, service delivery including pre and post contacts, and external communications to consumers.

Example 10: Block Diagram — Customer Decision Making
This diagram was created in ConceptDraw DIAGRAM using the combination of libraries from the Block Diagrams Solution. An experienced user spent 10 minutes creating this sample.
This Block diagram sample shows the process of customers' decision making. It is a cognitive process the main goal of which is a solving of a problem in the best way, which supposes the thorough analysis of costs and their minimization at the maximization of benefits. The decision-making process leads to the choice of uniquely correct belief, direction, and sequence of actions from a few alternative possibilities. When the decision making concerns the everyday or usual situations, typically we don't even think about the process itself, don't fix at all steps of how it happens, but the making of key decisions in business, manufacturing and some other domains requires a thorough and serious approach to avoid the possible mistakes and provide the best solution in each situation indeed. The decision-making steps represented in this diagram will help you make the best decisions. They include problem recognition, information search, evaluation of alternatives, purchase, post-purchase evaluation, and divestment.


Inside


What I Need to Get Started
Both ConceptDraw DIAGRAM diagramming and drawing software and the Block Diagrams solution can help creating the diagrams you need. The Block Diagrams solution can be found in the Diagrams area of ConceptDraw STORE application that can be downloaded from this site. Make sure that both ConceptDraw DIAGRAM and ConceptDraw STORE applications are installed on your computer before you get started.
How to install
After ConceptDraw STORE and ConceptDraw DIAGRAM are downloaded and installed, you can install the Block Diagrams solution from the ConceptDraw STORE.

Start using
To make sure that you are doing it all right, use the pre-designed symbols from the stencil libraries from the solution to make your drawings look smart and professional. Also, the pre-made examples from this solution can be used as drafts so your own drawings can be based on them. Using the samples, you can always change their structures, colors and data.

Block Diagrams
When using the term block diagram, we are referring to a whole sub-set of system diagrams, that use a series of blocks to represent components or actions, and connecting lines that show the relationship between those blocks. They are typically low-detail, providing an overview of a process without necessarily going into the specifics of implementation. A common example of a block diagram is a flowchart, used in many fields of business as a simple way of mapping a repeated process. Software and hardware designers use them to record the design process, network managers can show the relationships between electrical systems. The principle aim is to allow a critical view to be taken on the steps in a process or system — information on physical components or construction is left to schematic diagrams or blueprints.

Project management flowchart created using ConceptDraw DIAGRAM
Not all block diagrams are the same...
Although essentially a very simple format, a variety of shapes and connecting lines, and rules and actions pertaining to them, make the block diagram a versatile tool for many forms of industry. Another attraction is the ease with which they can be constructed — ConceptDraw DIAGRAM is an example of purpose built software designed with this form of process modeling in mind. The RapidDraw functionality found within creates new objects and their connectors in a single-click, creating an ever expanding tree as you work through the process.
Here are some examples of the sort of subject matter block diagrams can be useful for, and what style can be utilized in each case.
Business
Quite a broad term, but you will find block diagrams used in all fields of business; at an abstract level, to describe customer intentions and management processes, to depictions of physical transactions such as product design and sales processes.
- Business process modeling makes use flowcharts, control flow diagrams and data flow diagrams to show key parts of employee workflow.
- Management diagrams include organizational charts, product lifecycles, and influence diagrams to make decisions and regulate the workforce.
- Marketing diagrams involve decision trees, Porter's five forces models, and strategy maps to help identify and cater for customer routine.
- Finance divisions rely on accounting and audit flowcharts to record and approbate account strategy.

Porter's five forces model, created using ConceptDraw DIAGRAM
Engineering
The format of block diagrams lend themselves well to system and software modeling — often these sorts of processes involve logical, binary choice relationships with a finite number of permutations or possibilities. They can be used to identify or predict possible faults in a system.
- To map internal software architecture, UML diagrams, data and function models, IDEF diagrams, or functional flow block diagrams can be used. Entity–relationship diagram (ERD), SDL diagrams, systems development life cycles (SDLC) are used to describe the relationship between components within a system.
- To maintain safety and reliability standards, fault tree analysis diagrams are used to find any flaws in a product or process.
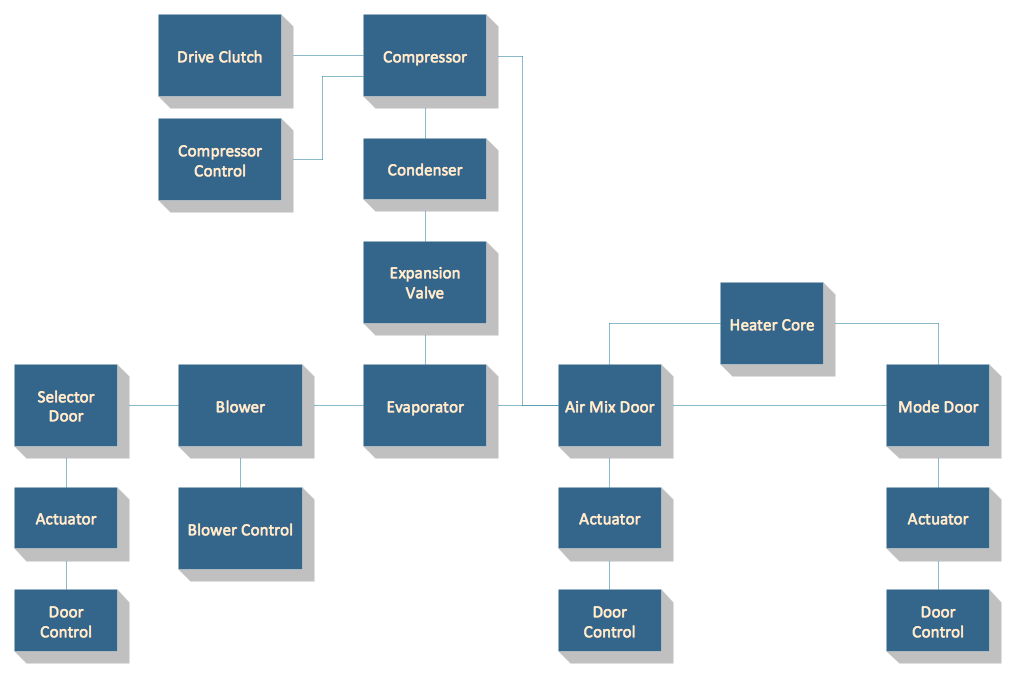
- Electronic engineers who need to record complex relationships between electrical components will employ a functional block diagram.
Education
As well as describing linear system processes and patterns of product lifecycles or customer behaviour, block diagrams can describe more free-form, creative diagrams for educational purposes — connecting thematic ideas and structuring concepts into a visual hierarchy for effective understanding and learning. Diagrams of this form, which can include mind maps and concept maps, bring a collaborative element to learning whereby subjects can be 'brainstormed' by people within a group.
- Mind maps, concept maps and conceptual graphs are all concerned with learning through visualization techniques. Key areas of information regarding a subject are identified, and the diagram shows the relationship and relevance to each other.
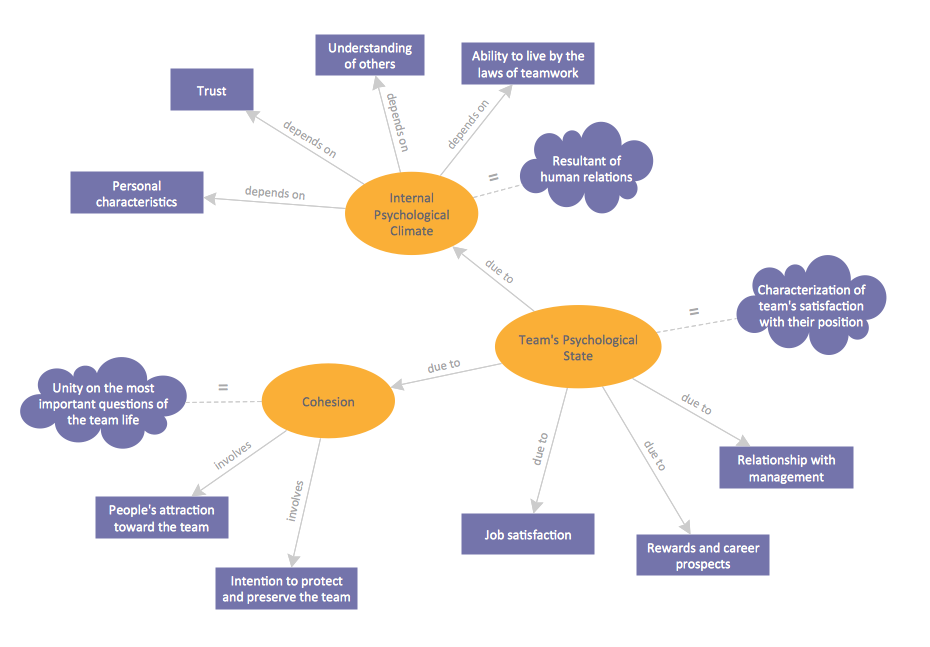
Concept map created using ConceptDraw DIAGRAM
- Cycle visualization, or life cycle charts, are an effective way of showing repeated processes found in nature, weather cycles for example.
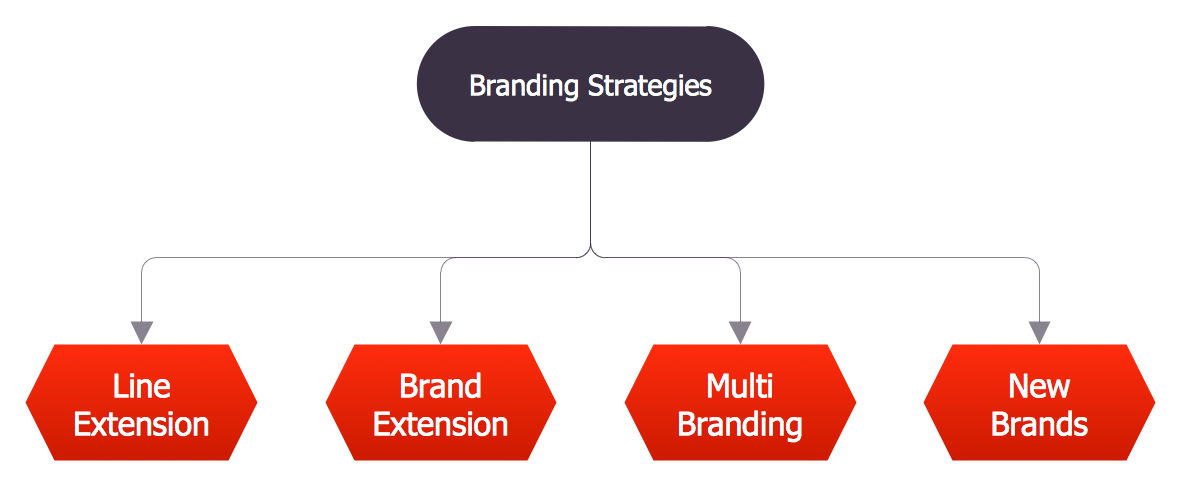
- Tree diagrams express hierarchy within a subject; for instance the family tree of a monarchy, or branches of language and their subsequent dialects.
A multi — purpose solution
Not many software programs can claim to offer solutions for all the tasks mentioned, or are capable of such diverse functionality as to handle complex designs in a variety of formats. CS Odessa have devoted a number of years to ensuring that ConceptDraw DIAGRAM offers value in all these situations; for producing informative educational materials, professional looking system analysis, or constructing complex business processes, and much more besides.
A large portion of ConceptDraw Solution Park is devoted entirely to the principle of block diagrams in all its varied forms — each individual solution contains their own vector stencil libraries, full of task specific icons and templates, sample documents that provide a reference of the capabilities of the solution, as well as a host of associated help and how-to material (text and video).
A couple of key features separate ConceptDraw DIAGRAM from the crowd in terms of ease of use, and assistance when creating your block diagram. RapidDraw functionality allows the user to place objects on the page with a single click, automatically connecting to the previous shape, making the drawing process fluid and intuitive. The technology to connect objects has also been carefully considered — 'smart connectors' automatically choose the most efficient route between shapes, and realign themselves if objects are rearranged at any point.
Visit ConceptDraw's Solution Park to find the comprehensive set of tools that make constructing block diagrams using ConceptDraw DIAGRAM a straight-forward and effortless process.