Examples of Flowcharts, Org Charts and More
Drawing your own flowcharts, diagrams, and plans it is better to use the existing layouts to be able to make them correctly with the help of tutorials. Using Flow Diagram examples, Flow Chart templates and other types of examples and templates from our site you can simplify your work making it possible to create business or network diagrams and any needed spectacular flowcharts with an easiness having all of them looking professional and mature.
Try the Flowchart, Workflow Diagram, Business Diagram, Floor Plan, and Business Chart, Graphic Organizer, Scientific Illustration, Engineering Diagram, EPC Diagram, Cross-Functional Flowchart, IDEF Diagram, Org Flow Chart, Illustration examples, as well as many more others from our Solution Park and find it simple to create something special in short terms with almost no effort at all!
Geo Map and Mind Map examples, UML and Circular Diagram, Project Management, Network and Business Diagram, Corporate Flow Chart examples as well as lots and lots other charts, flowcharts, plans, and diagrams are there to your service. ConceptDraw DIAGRAM is here for your use!
The following examples were created using ConceptDraw DIAGRAM and are included as part of the software installation.
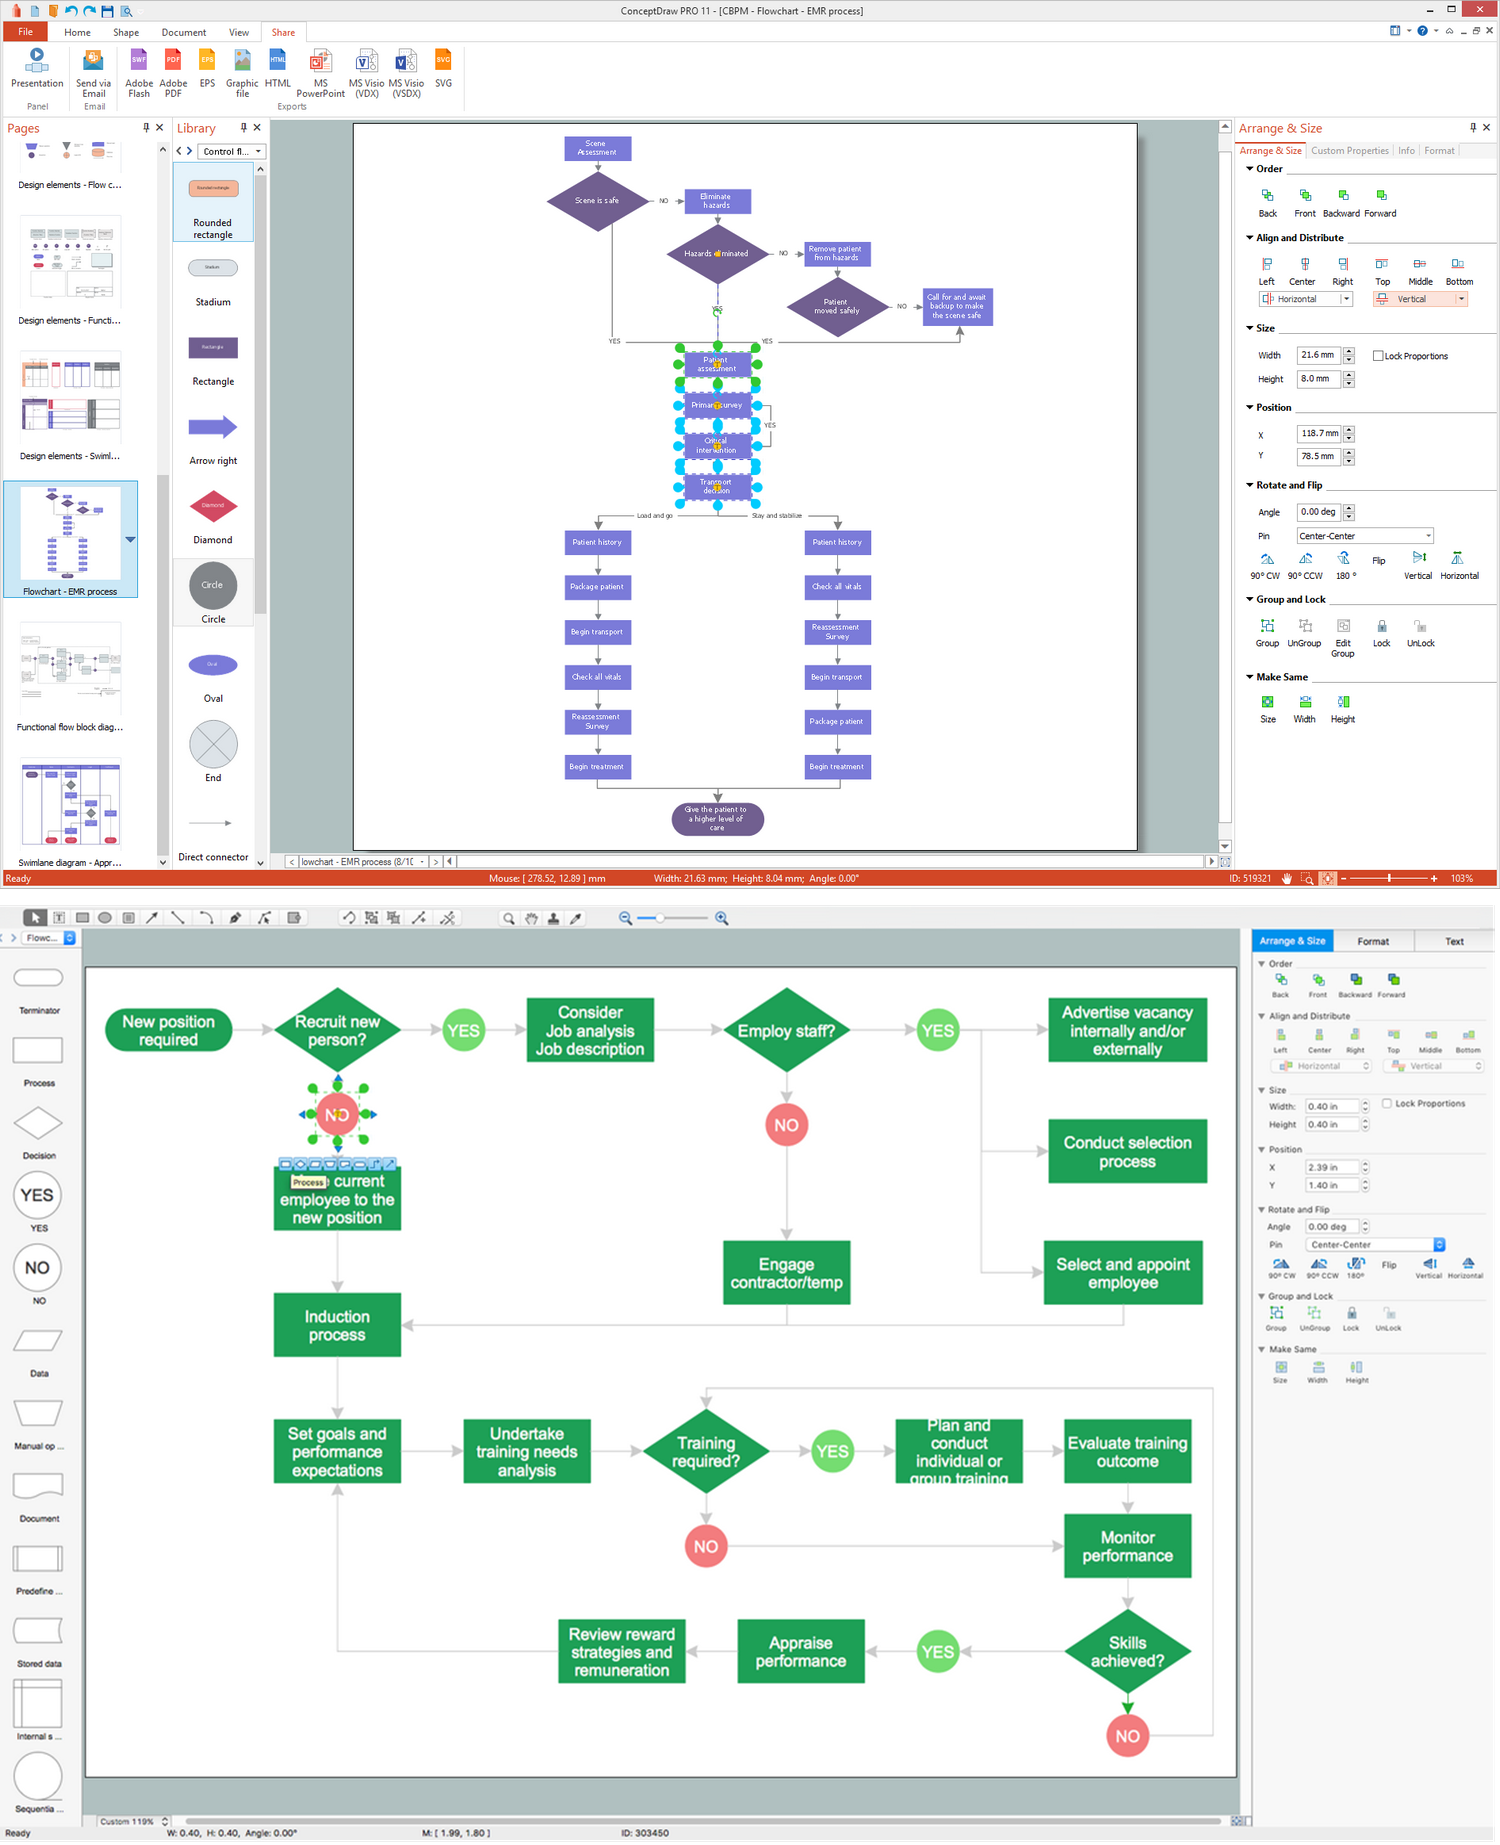
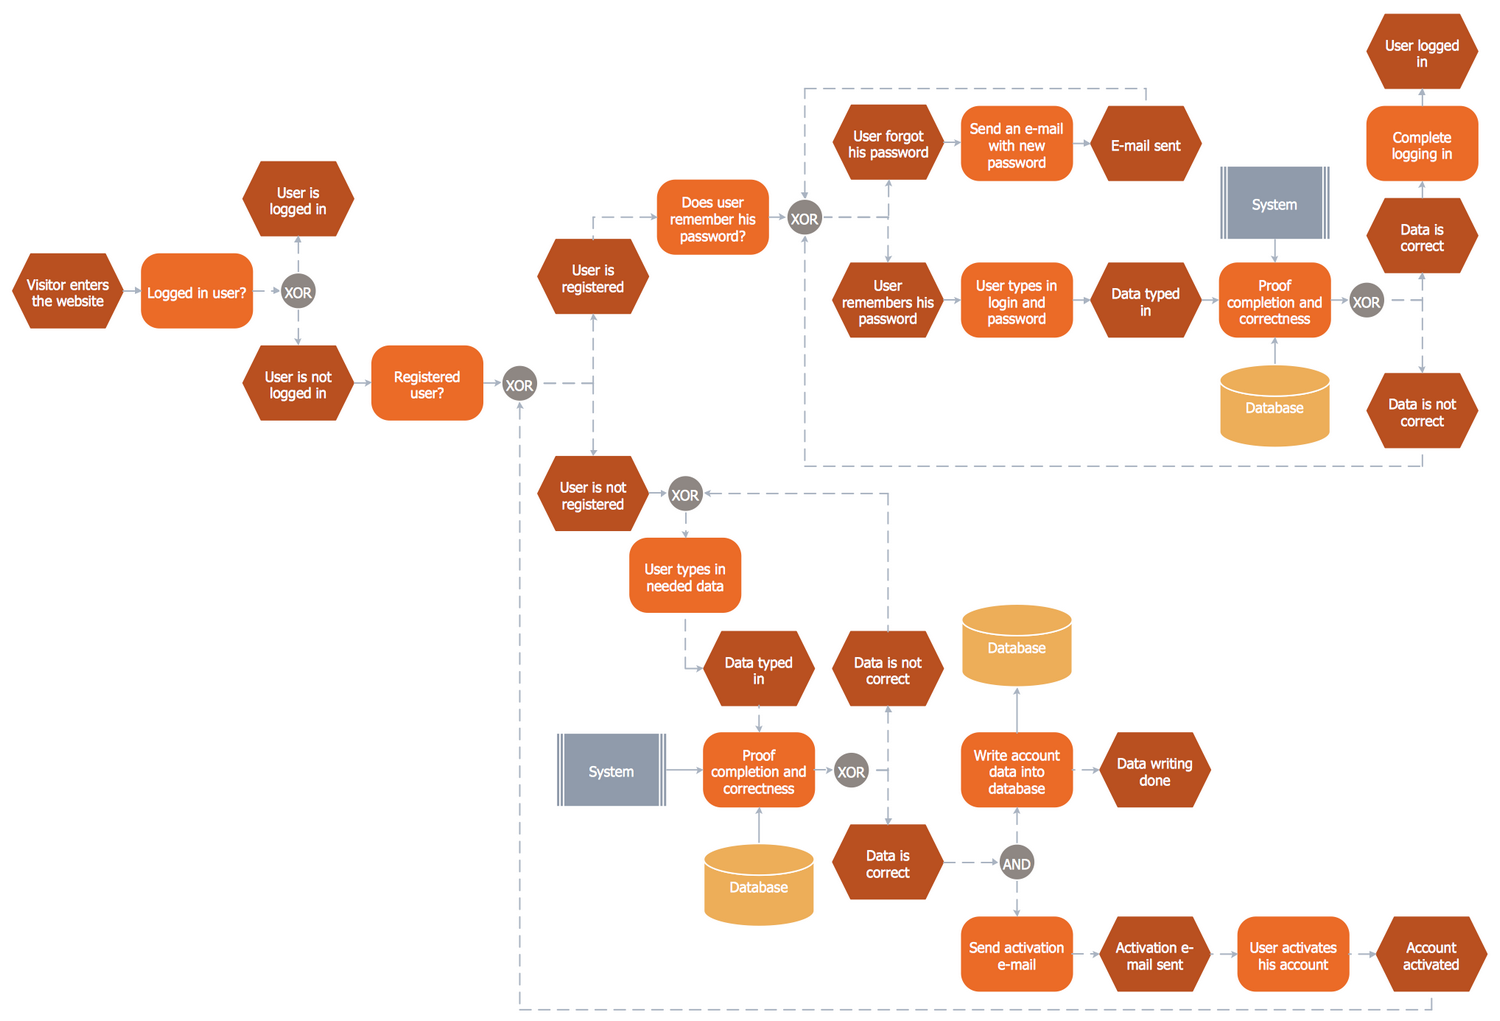
Flowchart Examples
Flowchart is a diagram depicting some process of workflow and showing the steps as boxes of different types connected with arrows. Flowcharts are usually classified into four core types: data flowcharts, system flowcharts, program flowcharts, and document flowcharts. They are a popular tool for interpreting algorithms, usually using pseudo-code.

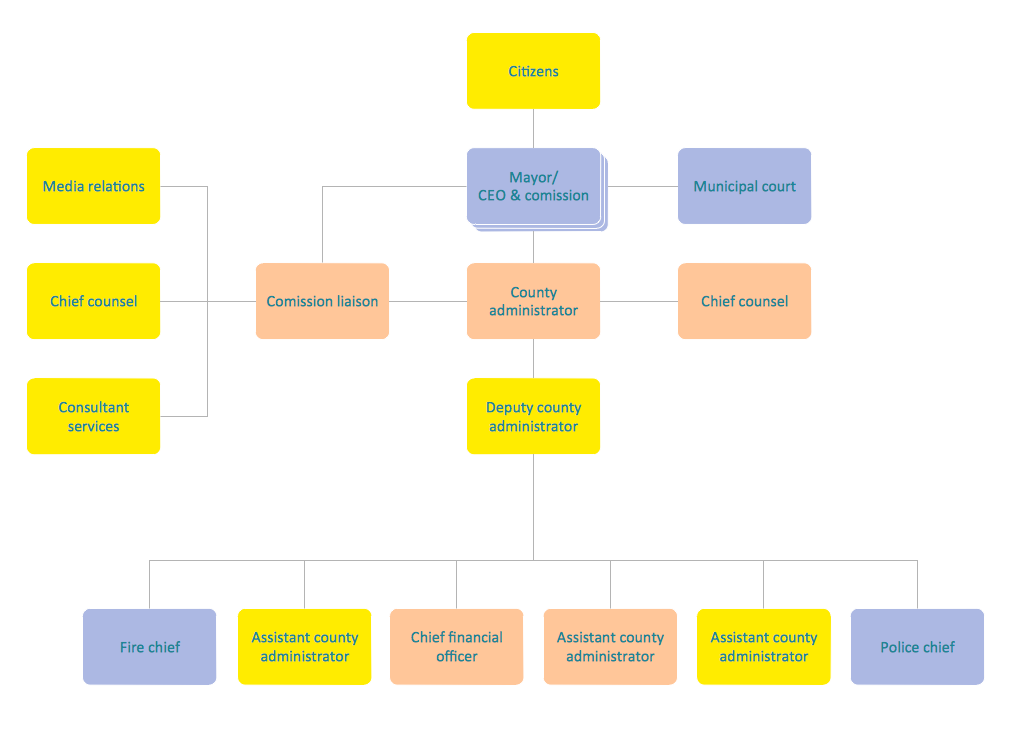
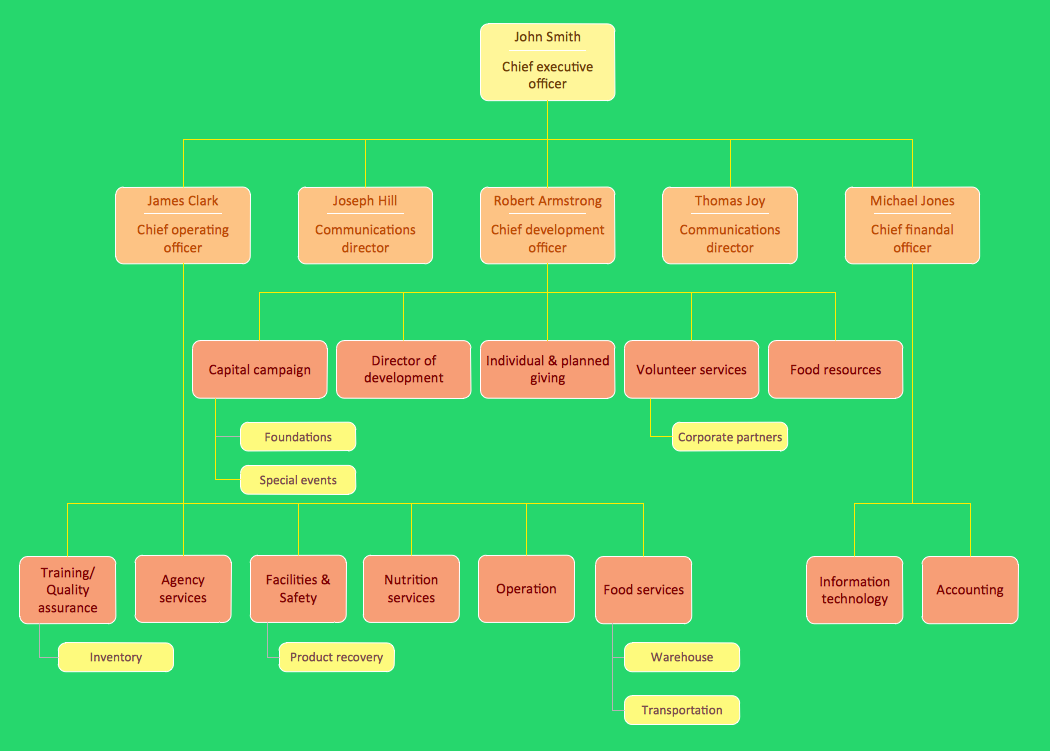
Organizational Chart Examples. Company Organizational Chart
Organizational chart is a diagram showing the connection of one employee to another, or others. It clearly shows the company's hierarchy and subordination. Also, it can be created to show the relations within departments or functions of the organization. The principal value of this diagram is that one can show graphically an entire organization in one picture. If the company is too large, the chart can be split into several smaller ones. A brief sample of Organizational chart and graphical symbols usually used for designing charts are collected in ConceptDraw Solution Park in Organizational Chart solution. This is an extension of ConceptDraw DIAGRAM software professionally intended for these charts.

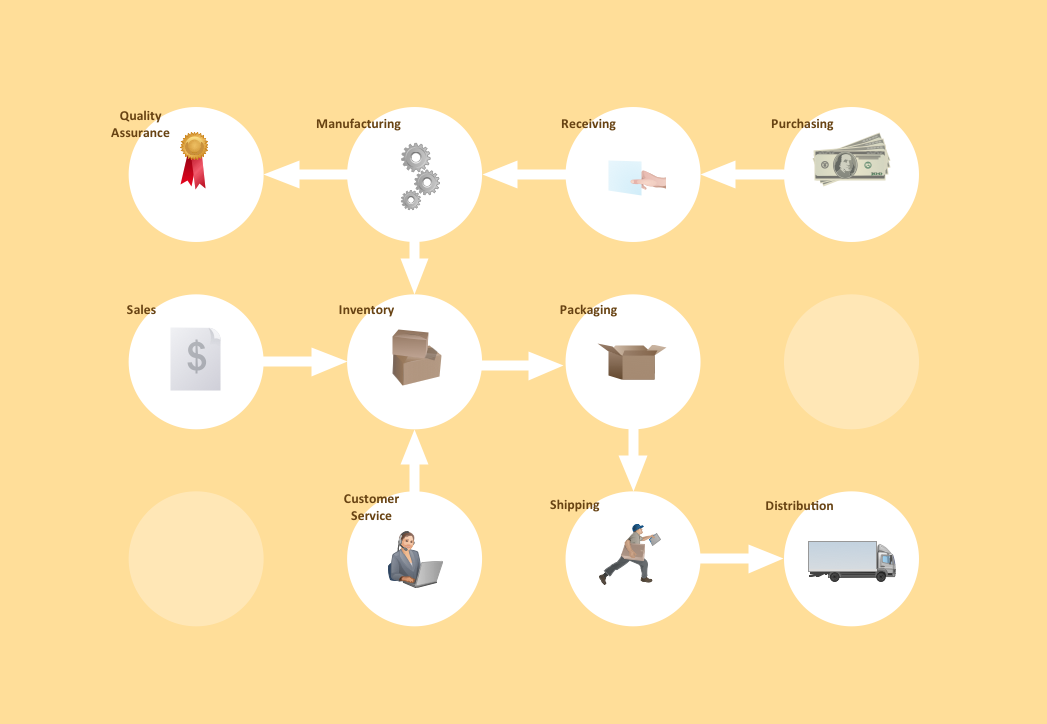
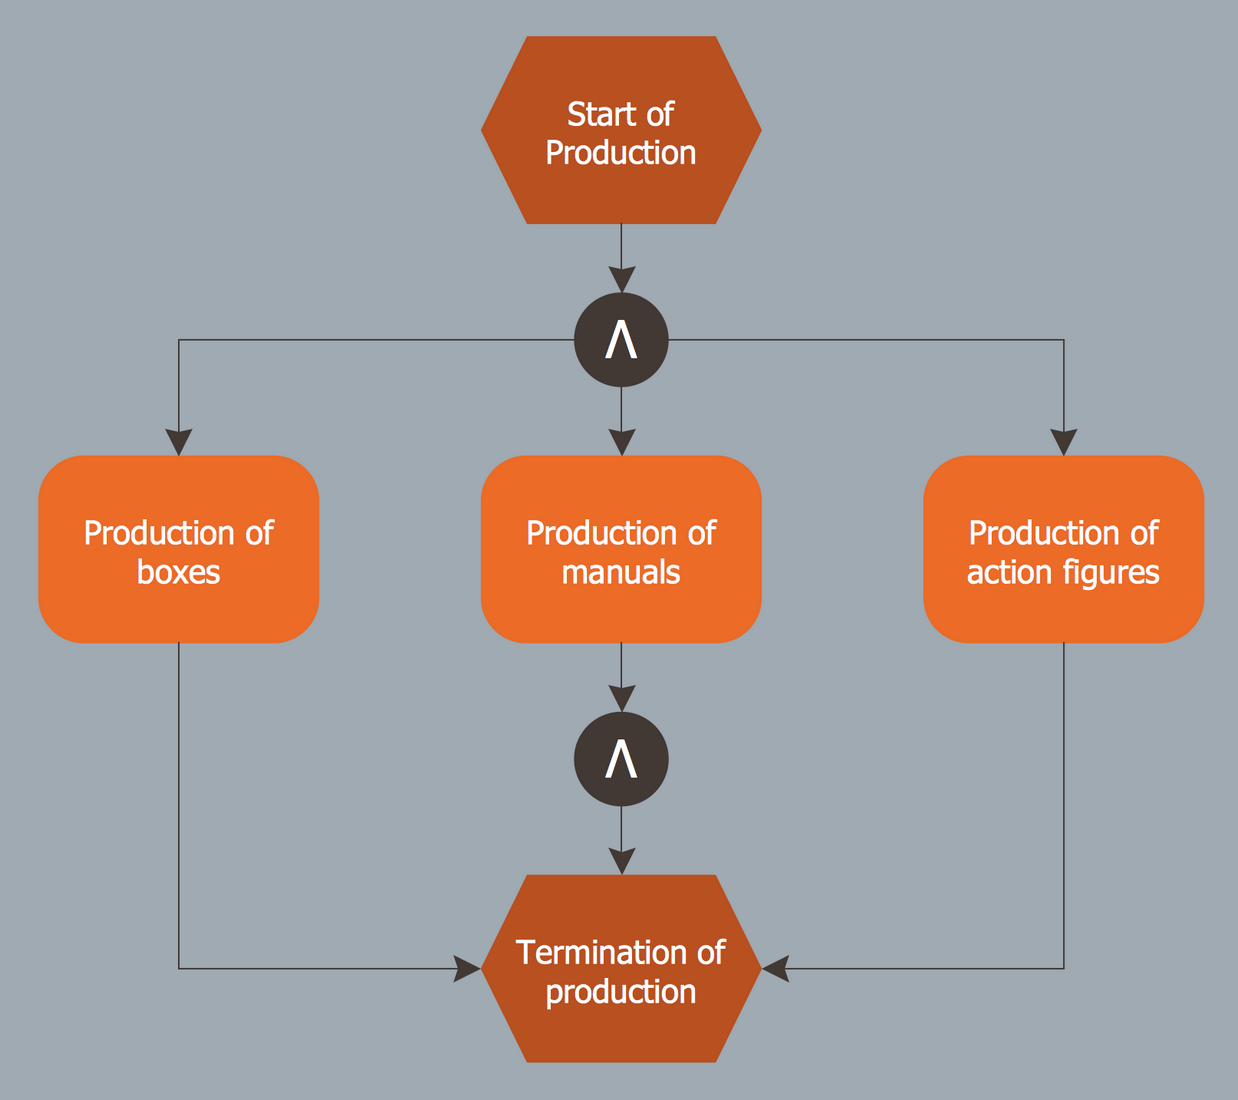
Business Diagram Examples
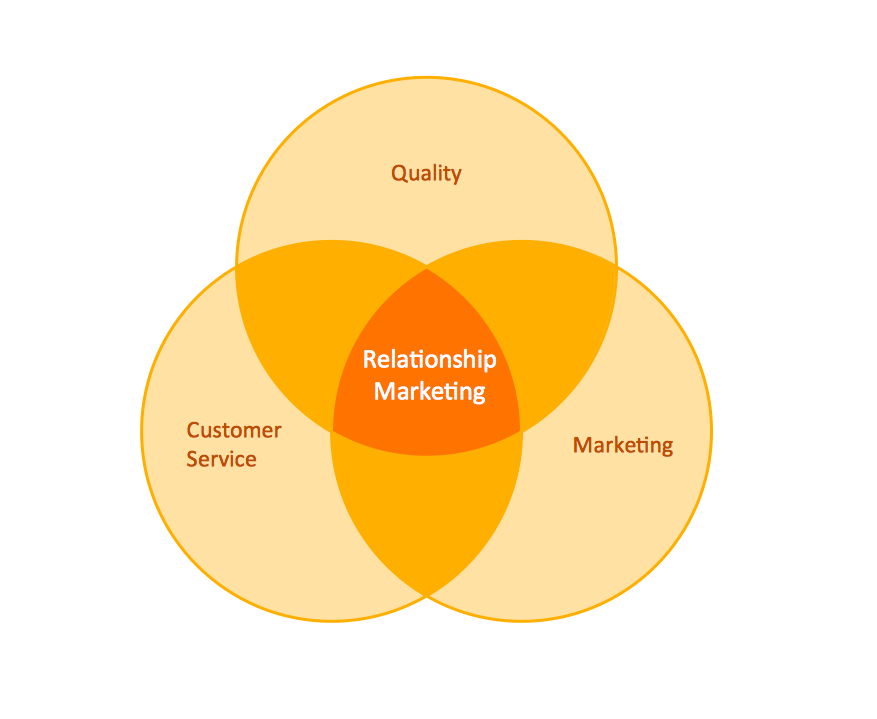
Business Diagram is a broad concept of various diagrams applied for such processes and methods as problem solving, business process modelling and notation, total quality management, or business process management. These diagrams provide visual illustrations, which serve in many cases from researching a problem to data modelling.
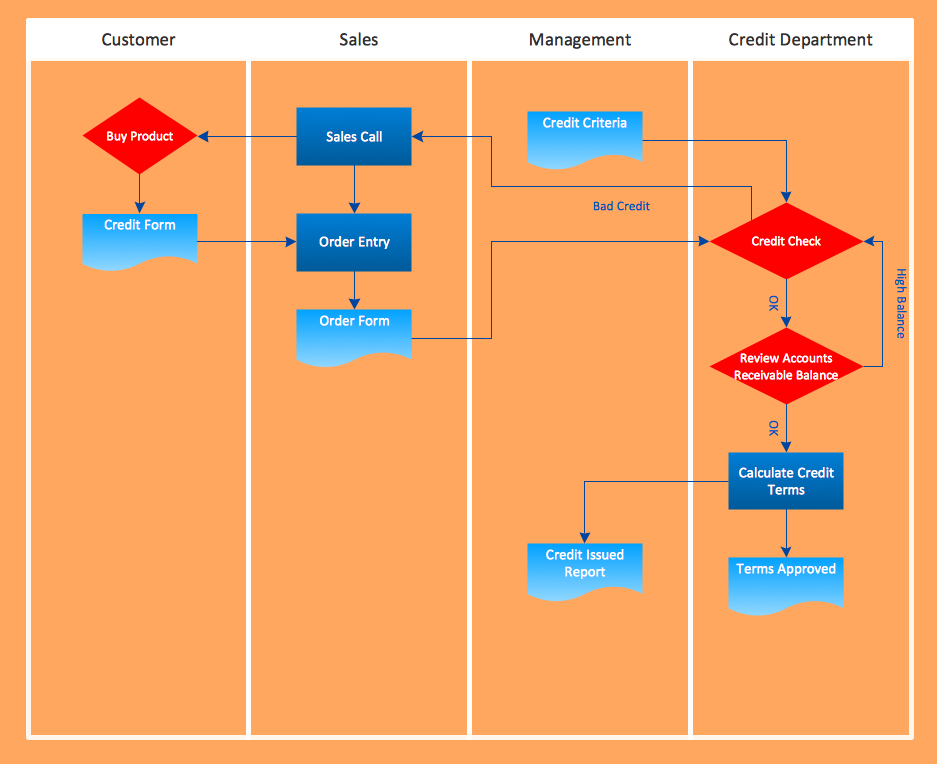
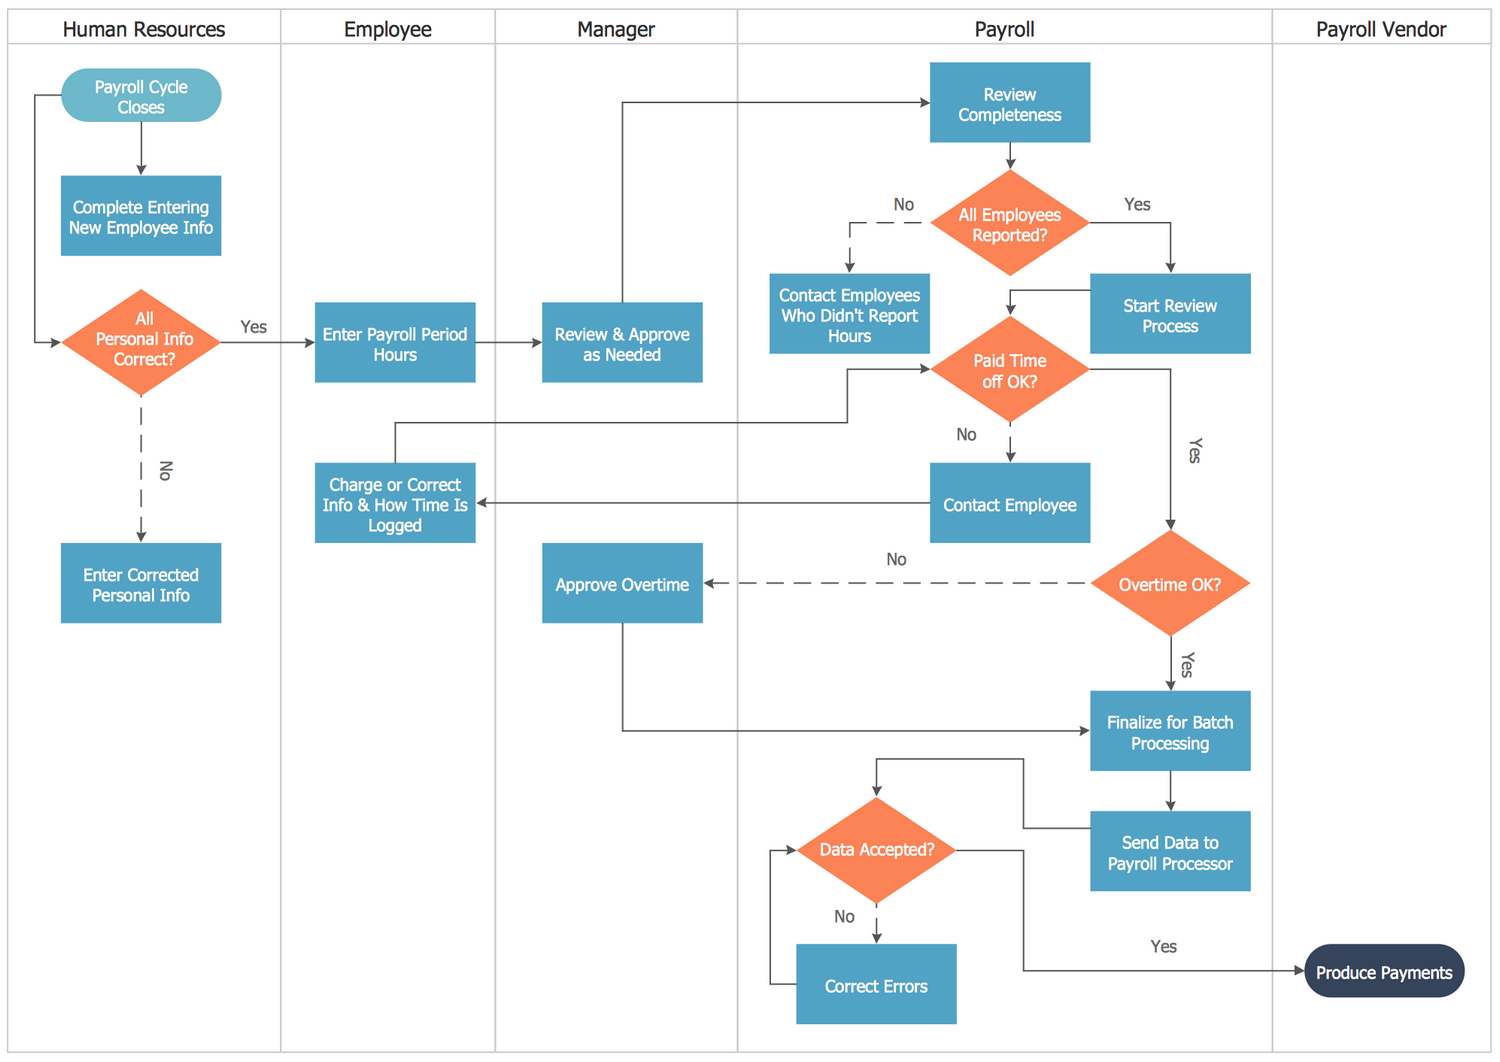
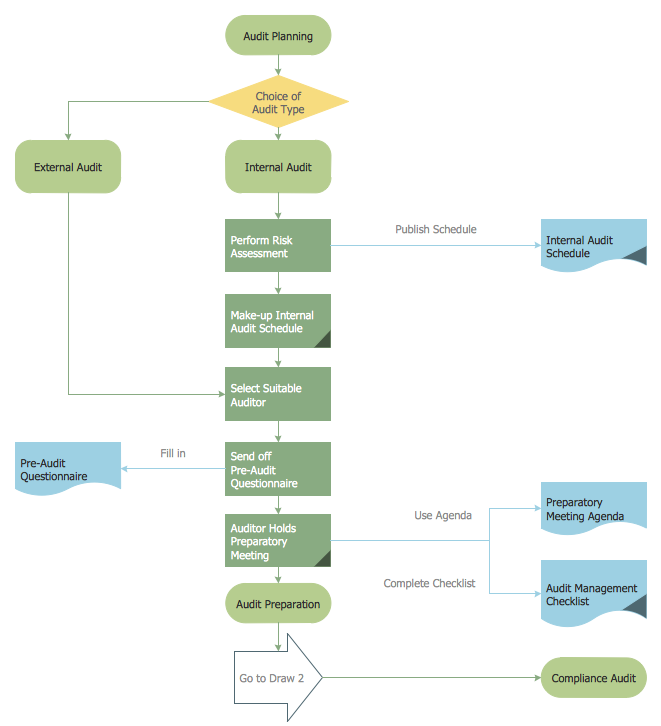 Audit Flowchart
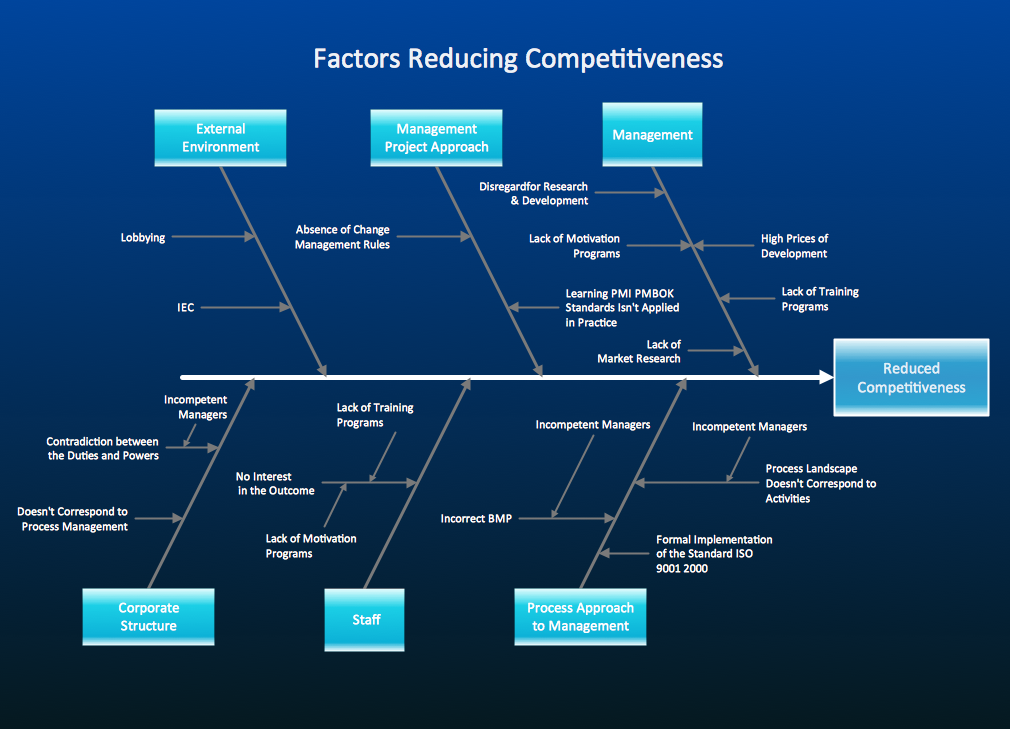
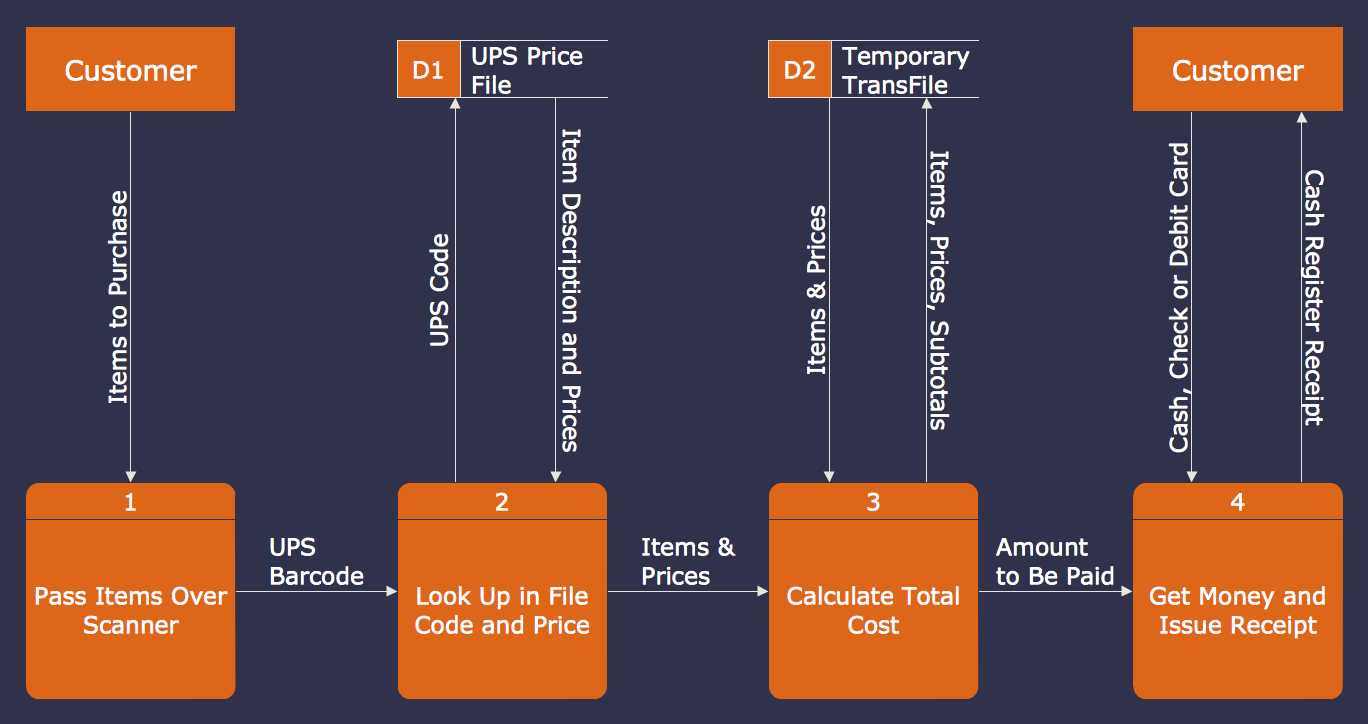
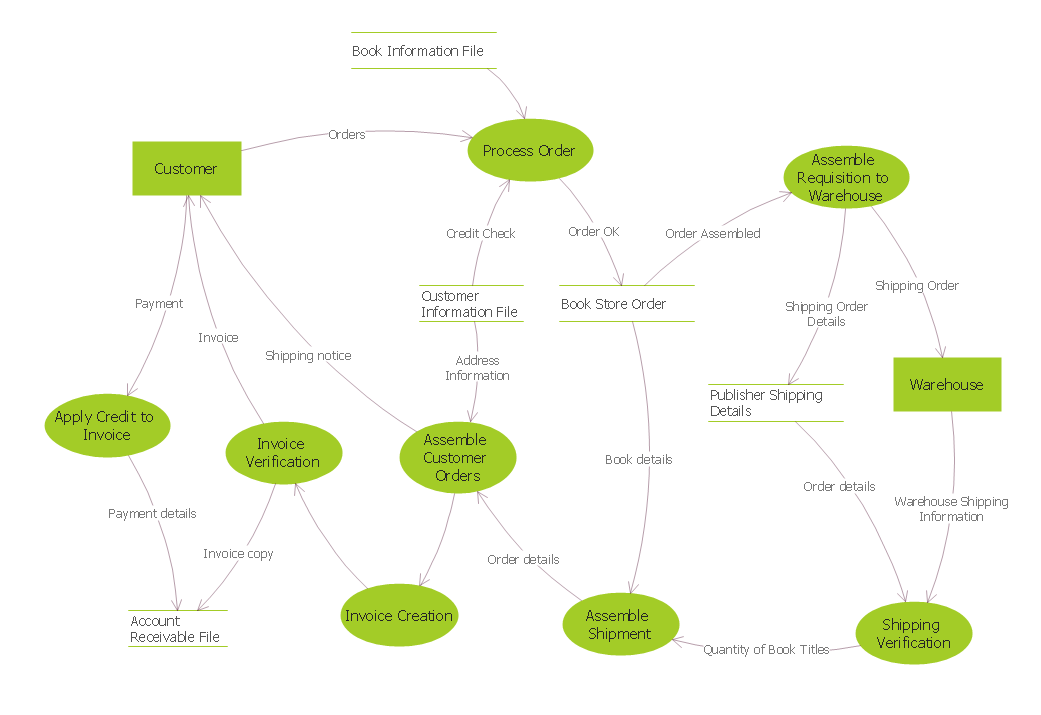
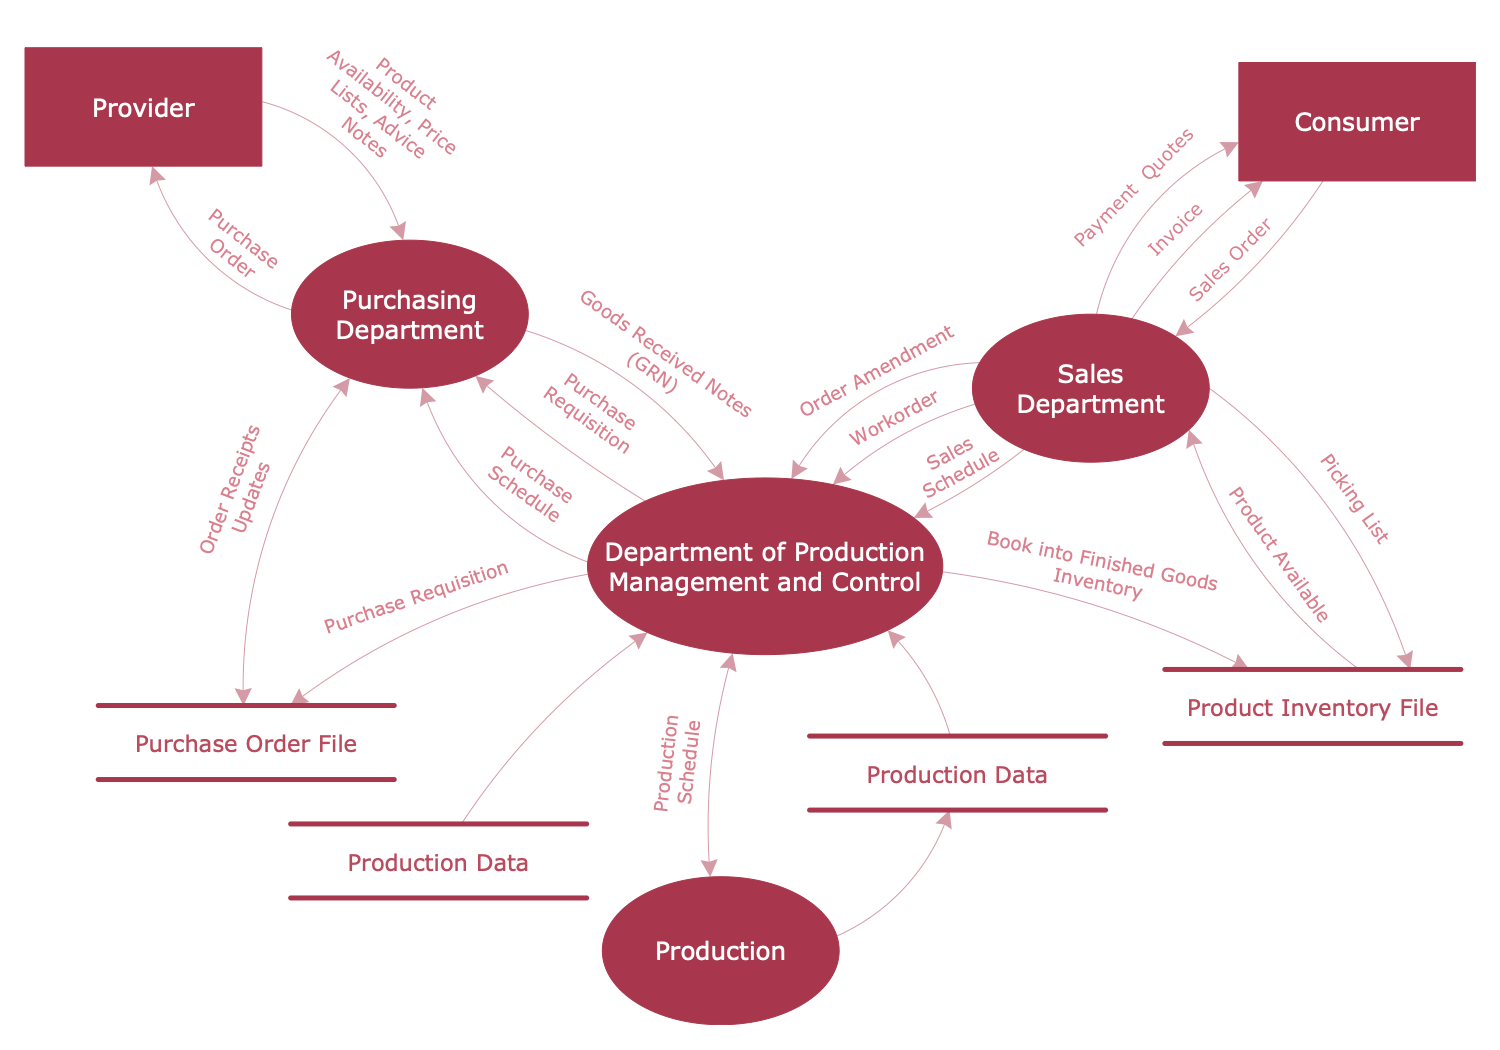
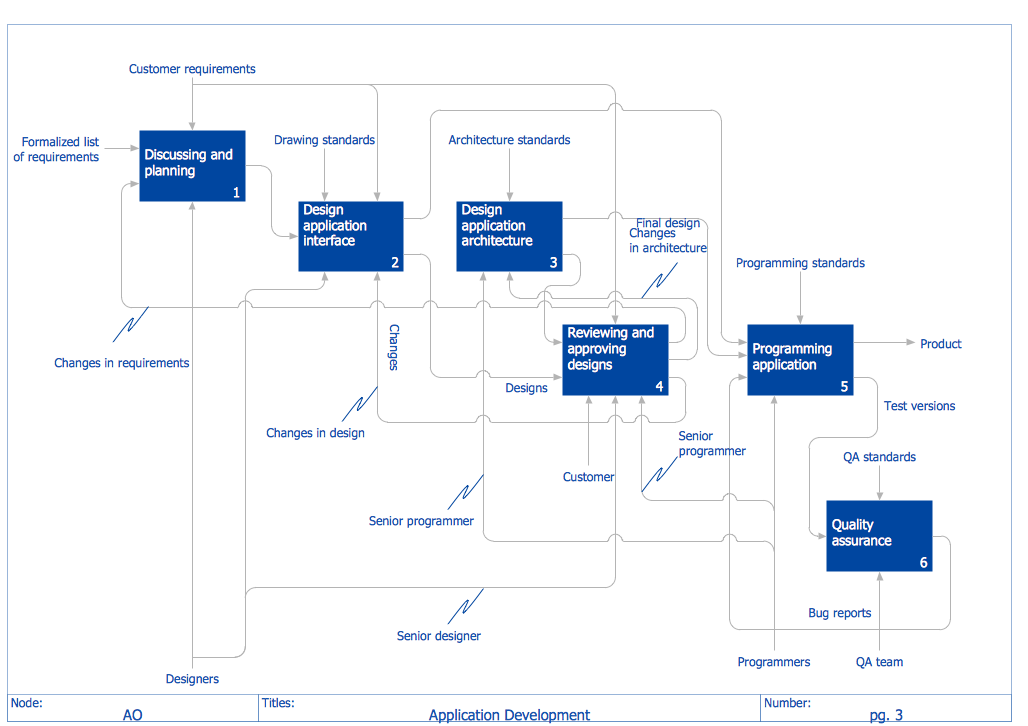
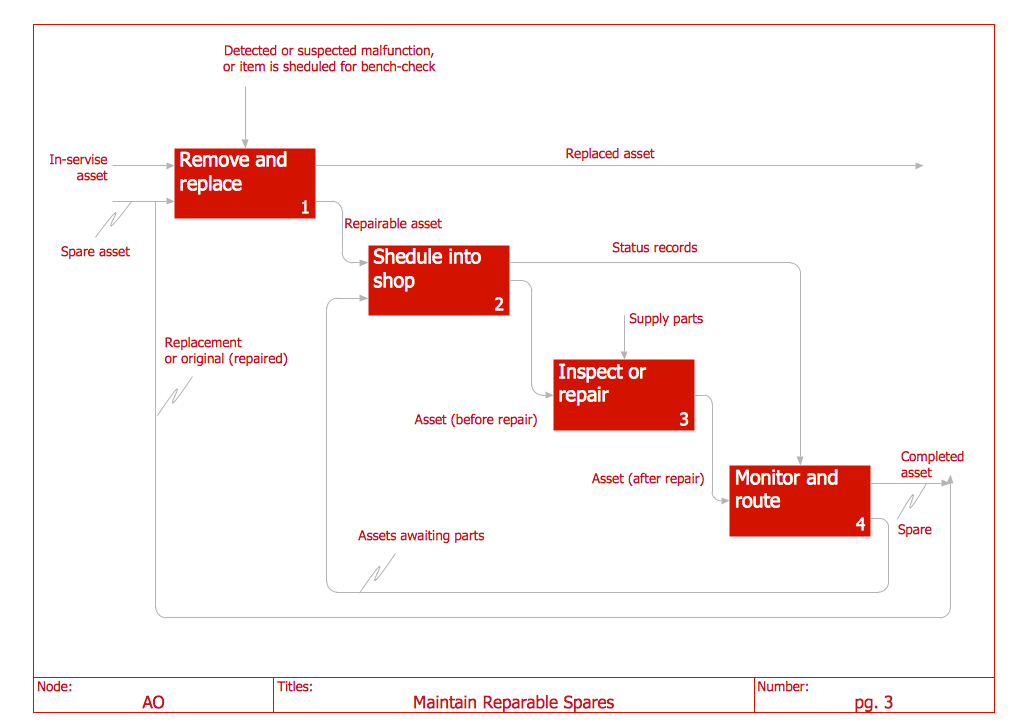
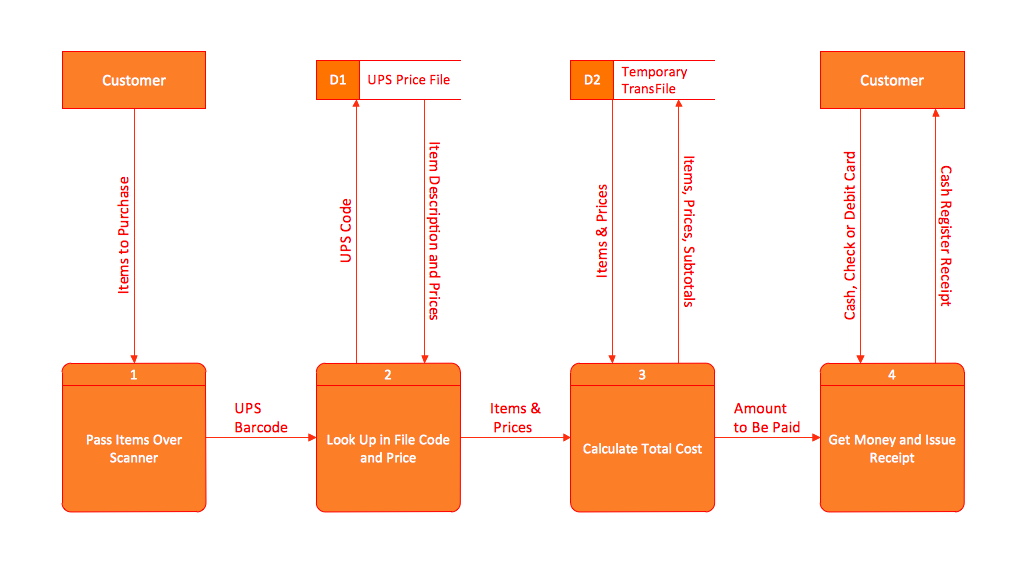
Data Flow Diagram (DFD) Examples
Data Flow Diagram (DFD) is a comprehensive graphical representation of the data flow within a system. It shows the inputs and outputs of the process, how data moves from one process to another, and the storage locations of the data. DFDs make it easier to understand and communicate system requirements and processes, and are widespread in systems analysis and design.
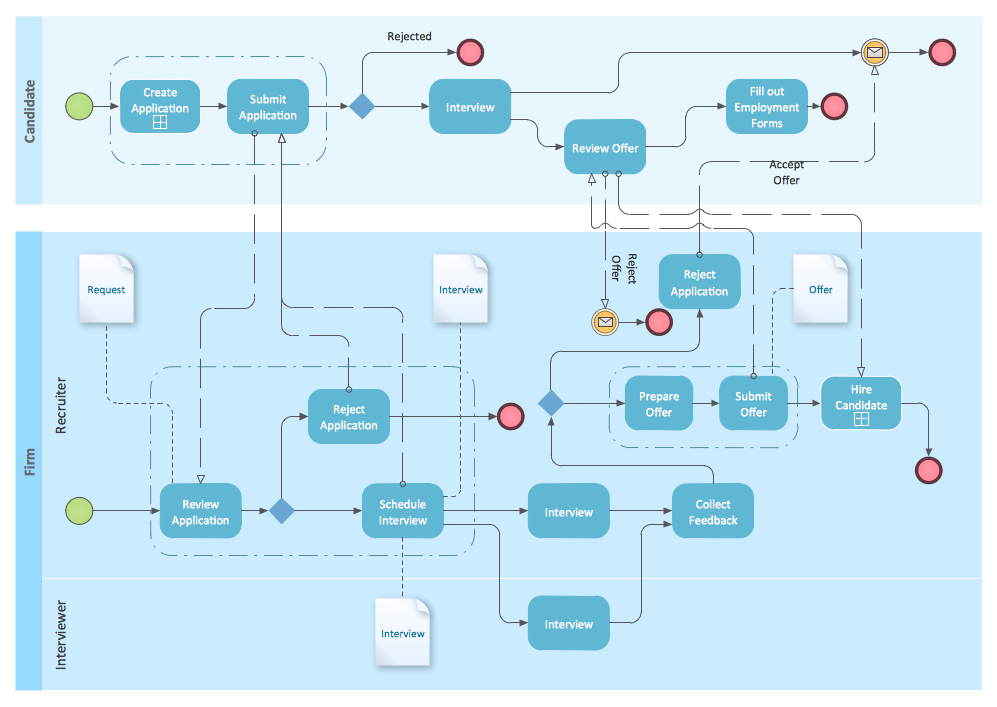
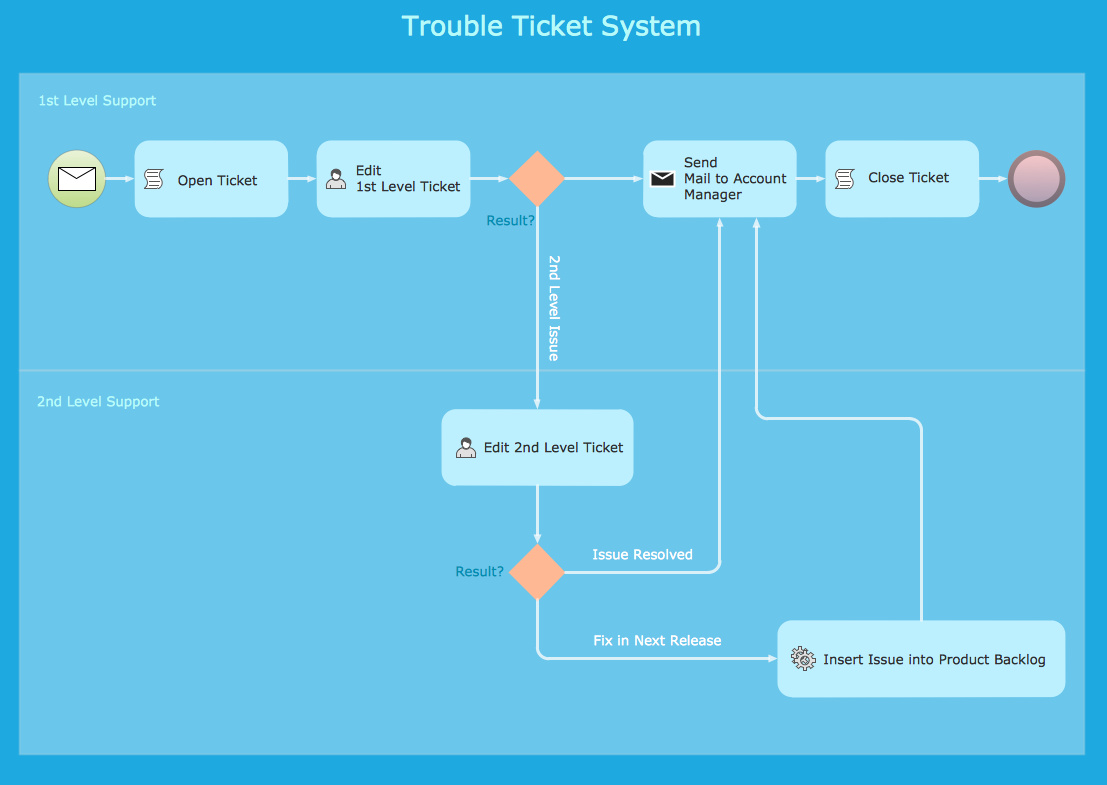
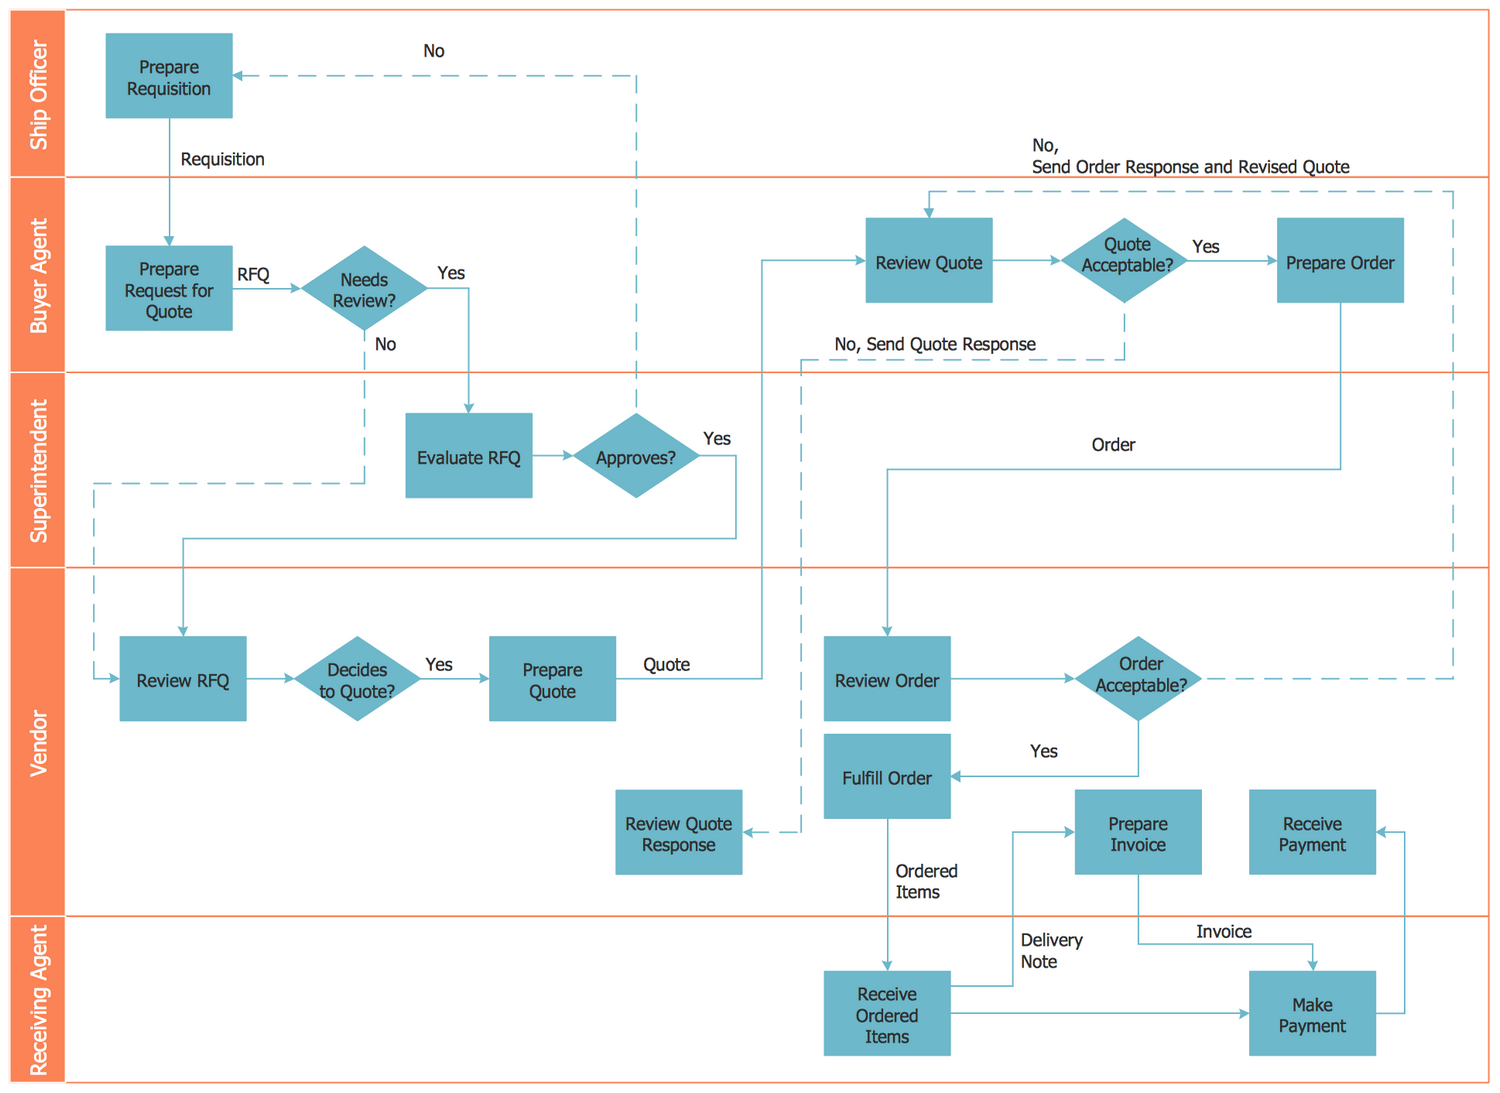
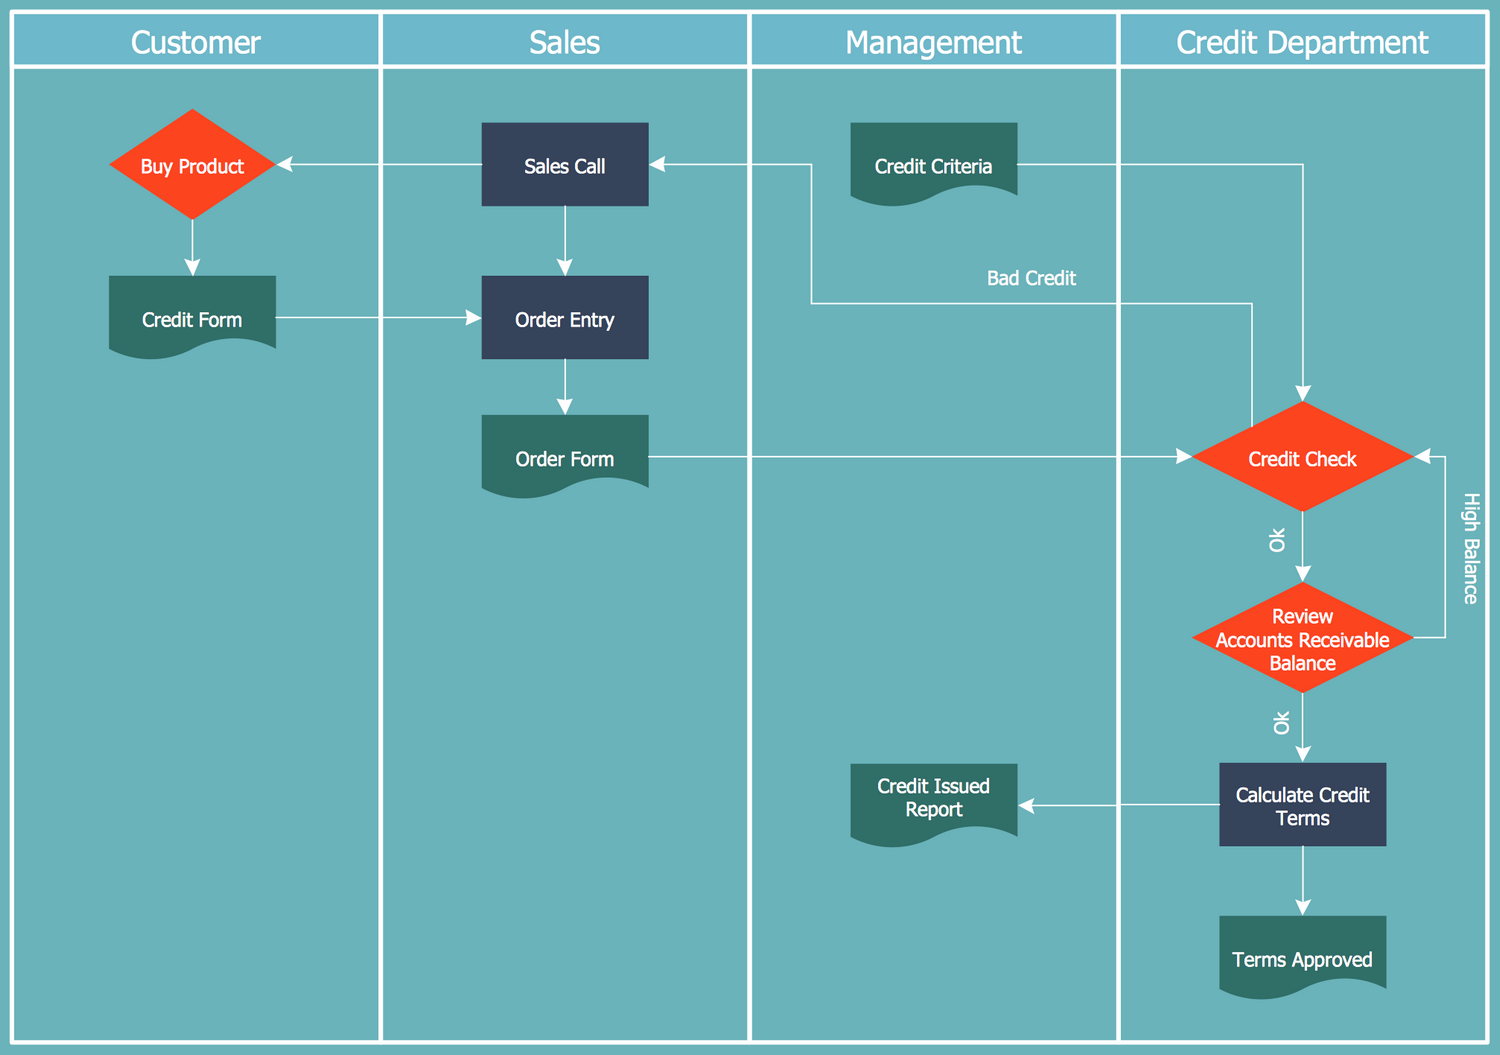
Cross-Functional Flowchart Examples
Cross-Functional Flowchart is another type of a Flowchart, which visualizes processes or workflows across different departments, teams, or individuals within an organization. The swimlanes of this Flowchart divide the process flow into several actors or represent specific functions or roles and how various tasks and responsibilities flow between them.
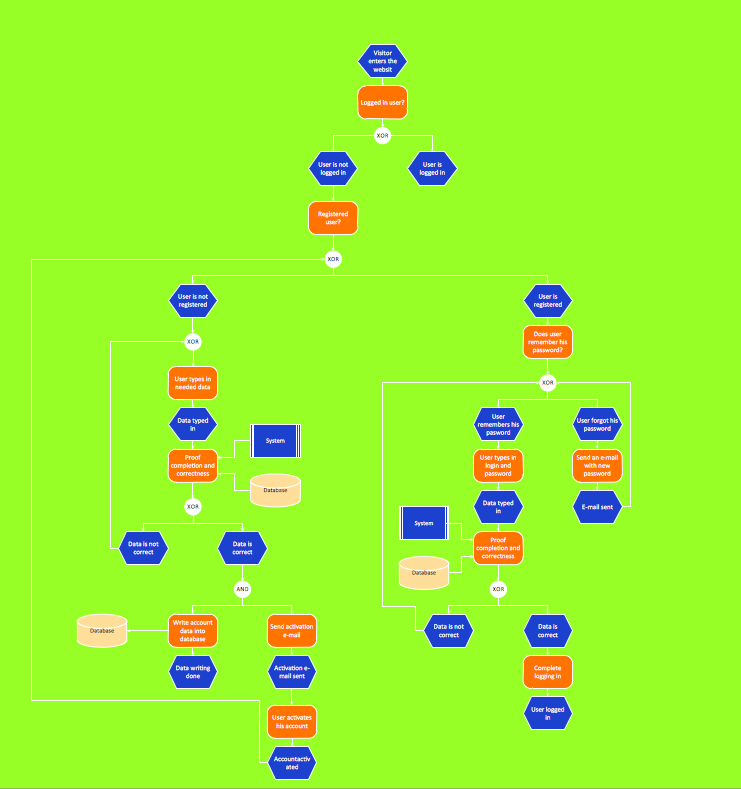
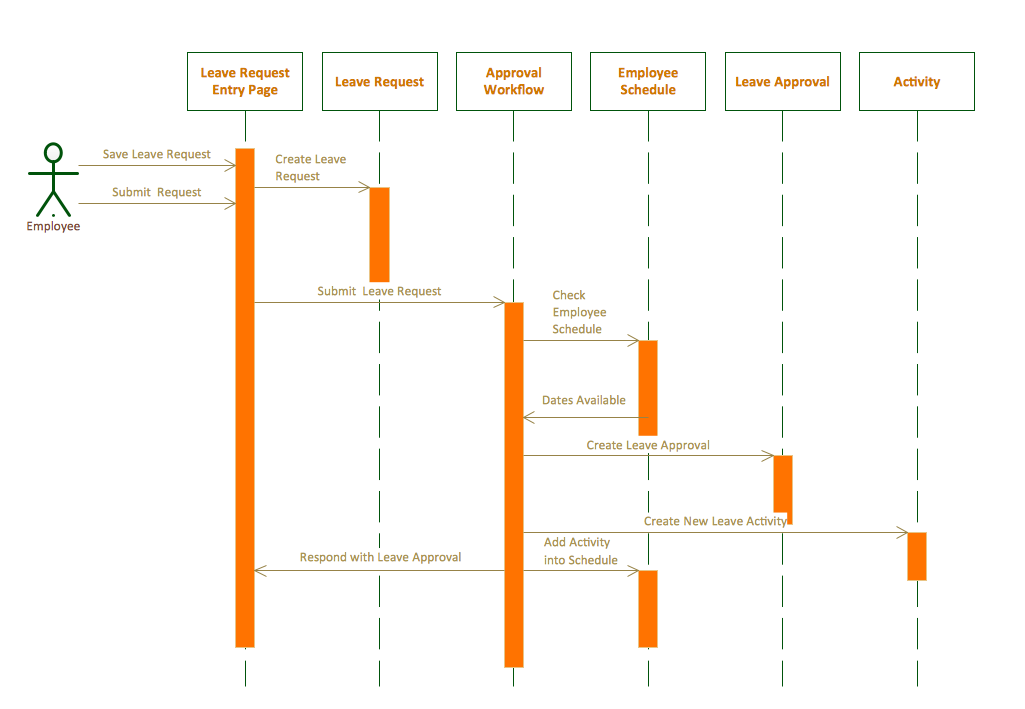
Workflow Diagram Examples
Workflow Diagram is a visual representation of a process, a flow of tasks, decisions, or a sequence of activities that are necessary to complete a specific task or achieve a specific goal. Workflow Diagrams show interactions between various elements within a process and are commonly used in business, project management, and software development.
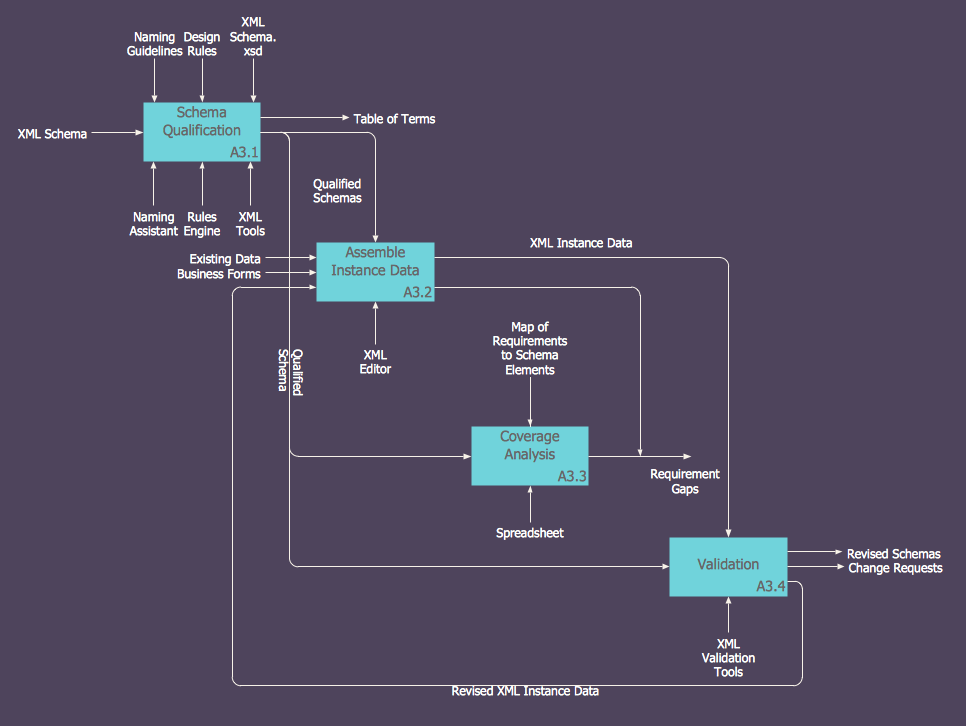
IDEF Business Process Diagram Examples
IDEF Diagram is based on the IDEF modeling methodology allowing representing and analyzing the functions and processes within an organization, developing and depicting database designs and object-oriented designs. IDEFs are widespread in systems engineering, software engineering, and business process improvement.
EPC Diagram Examples
EPC Diagram is a type of Flowchart used for business process modeling, to visualize the control flow and show the relationships between different business process elements. EPC Diagrams are particularly popular in business process reengineering and enterprise resource planning projects.
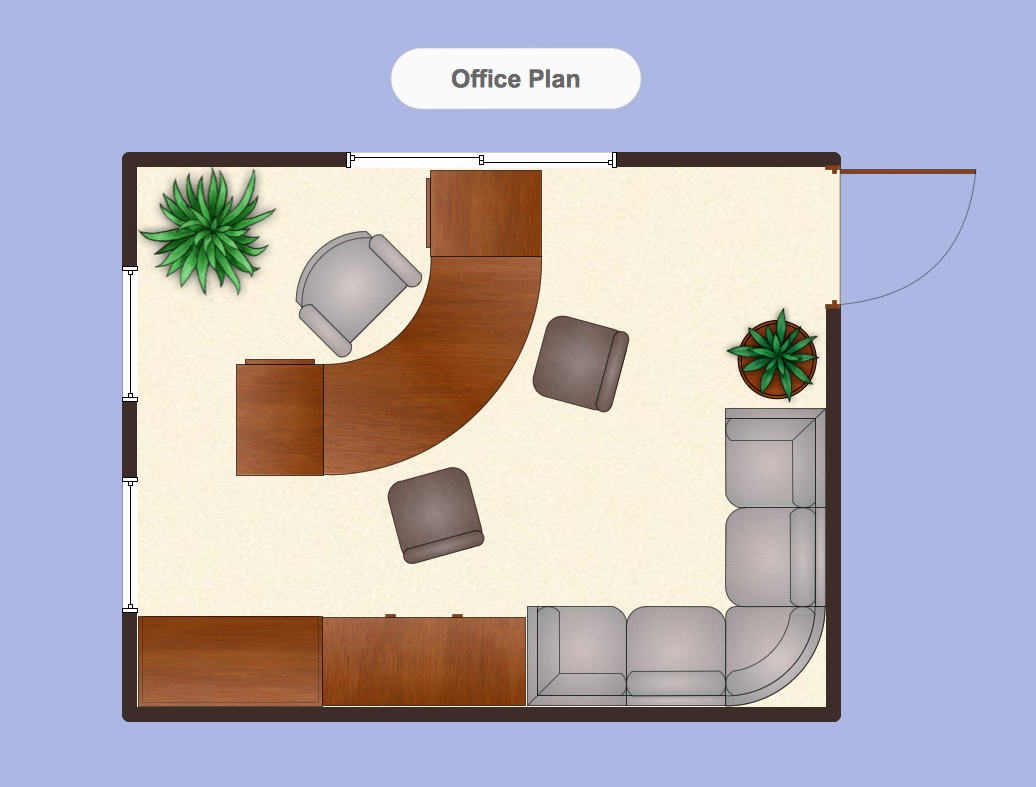
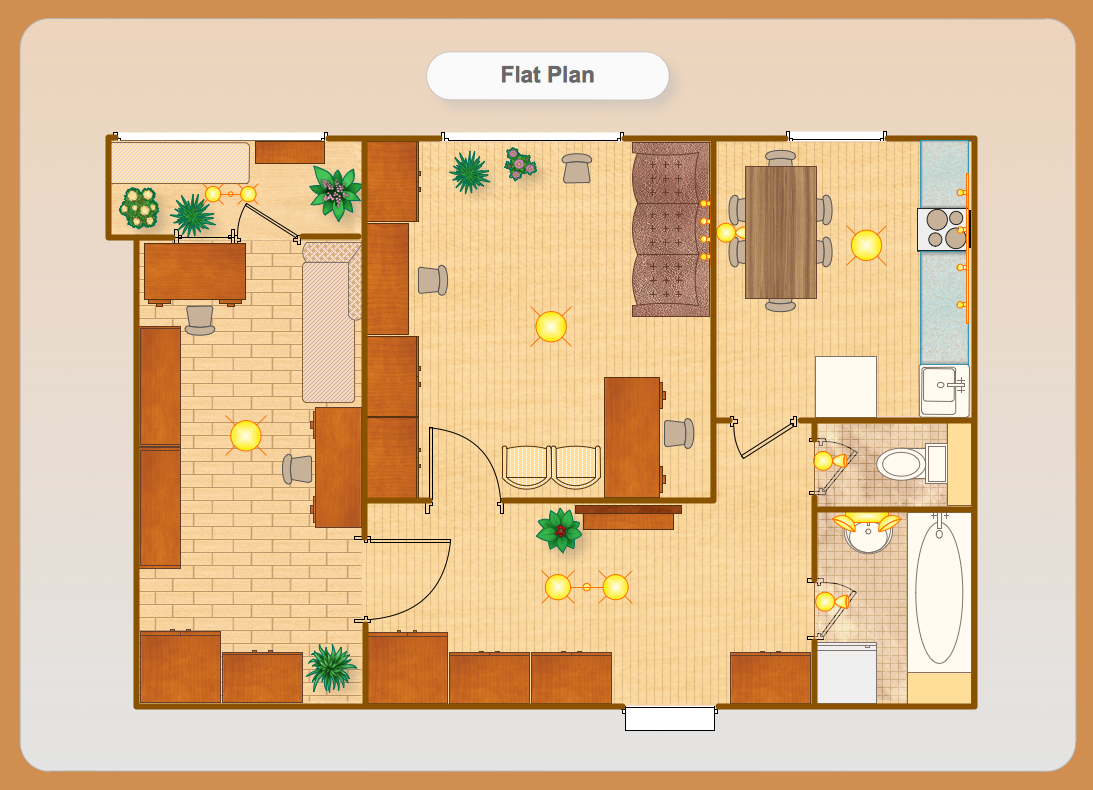
Building Plan Examples
Building plan or floor plan is a graphical projection of a premise showing a view from above. This drawing takes into account all the dimensions, all the physical features, and the arrangement of rooms. Some objects, like roofs, may be omitted. Building plan could contain both exterior features, such as patios or porches, and interior features like fireplaces, interior doors, and walls. Floor planning is very useful for making a sketch for furniture arrangement.

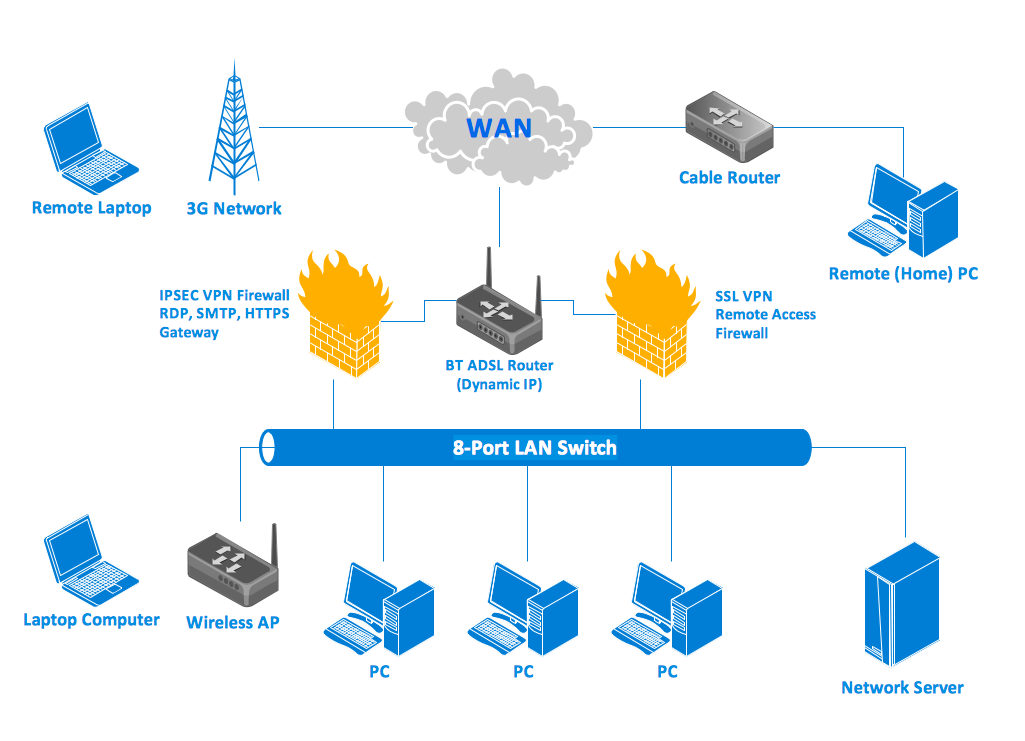
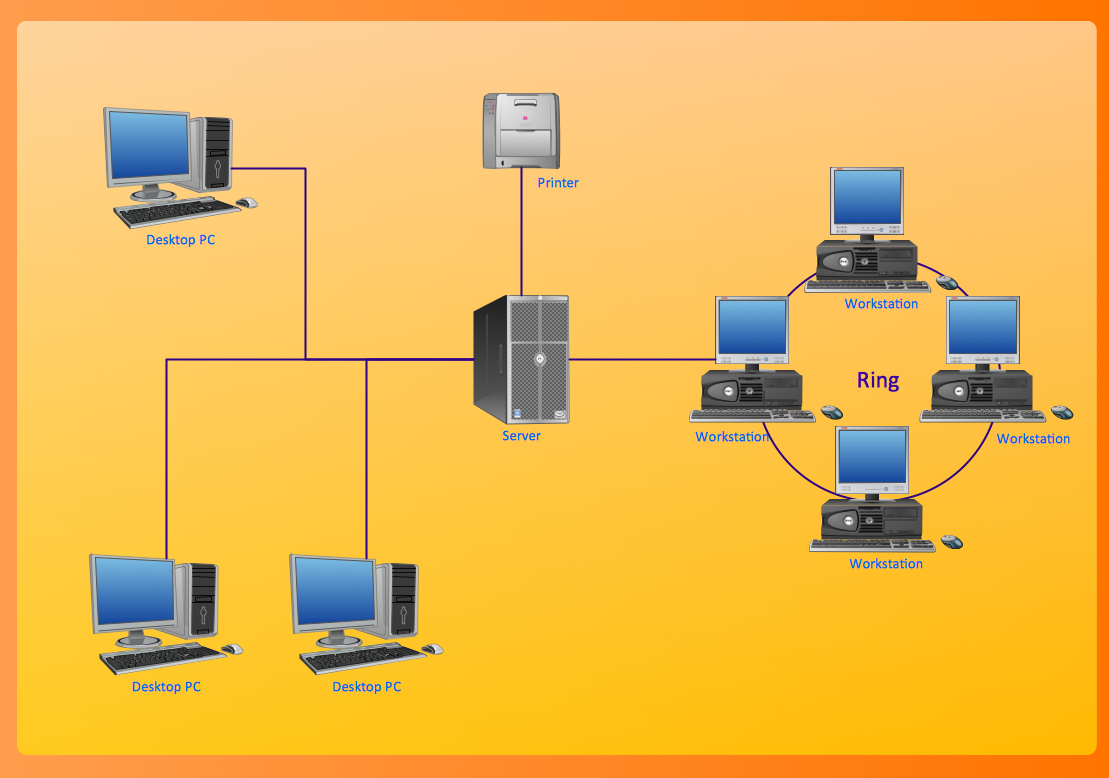
Network Diagram Examples
Network diagram shows the network appliances and the connections amongst them in a computer network. Identifiable shapes are used to show devices. The lines connecting the shapes represent type of connection.

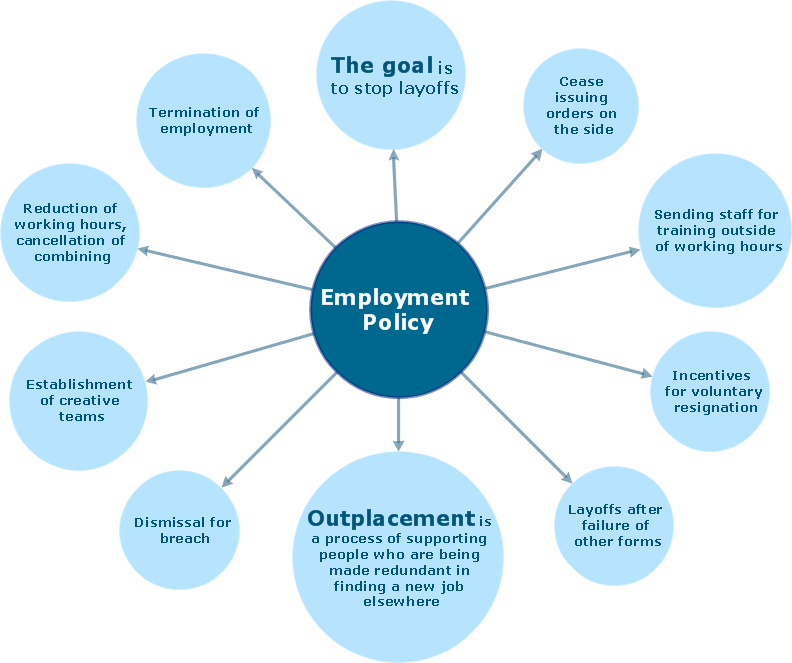
Mind Map Examples
Mind Map is a diagram created to organize thoughts or associations. It helps to analyze facts, order ideas, and visualize information in a creative way. Determine one main idea or concept, write it down in a circle, and add branches with major ideas and subbranches with minor thoughts. You can use images, symbols, different fonts, and colors to make your Mind Map vibrant and cool.
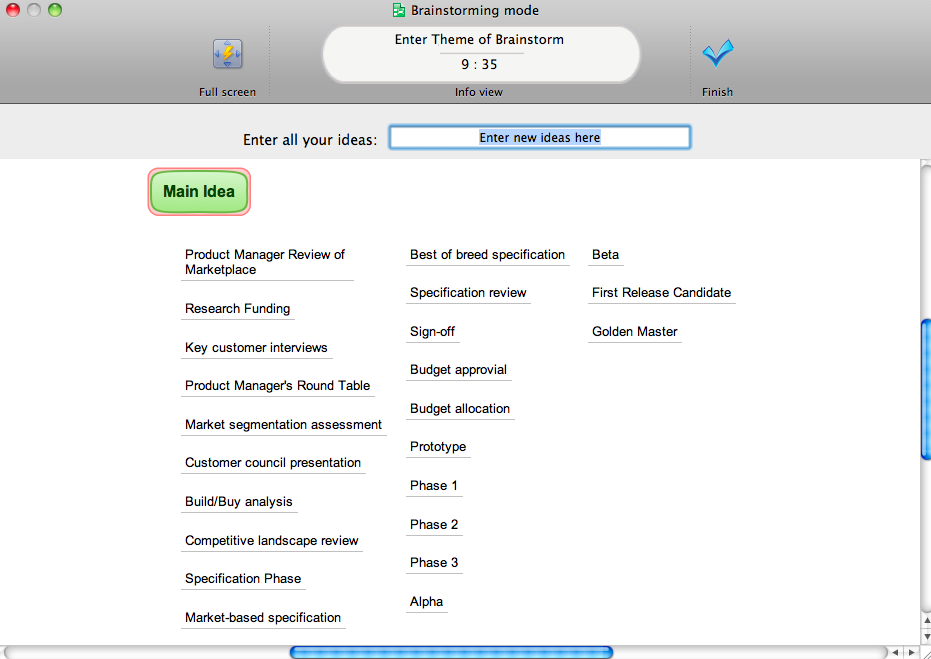
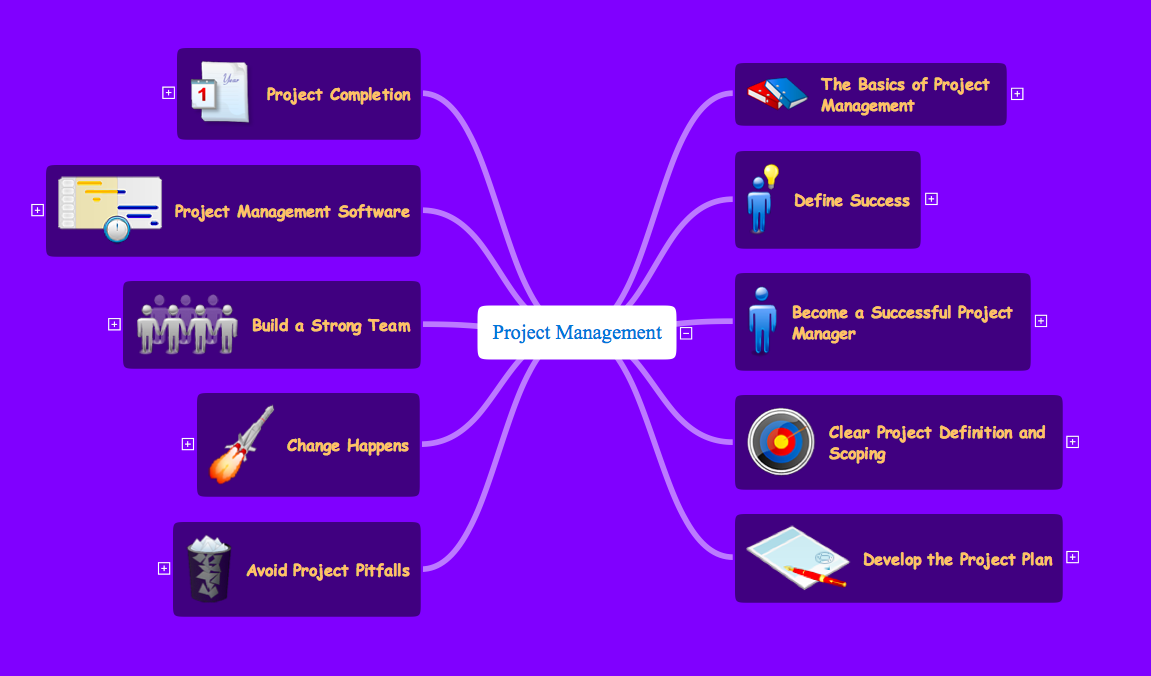
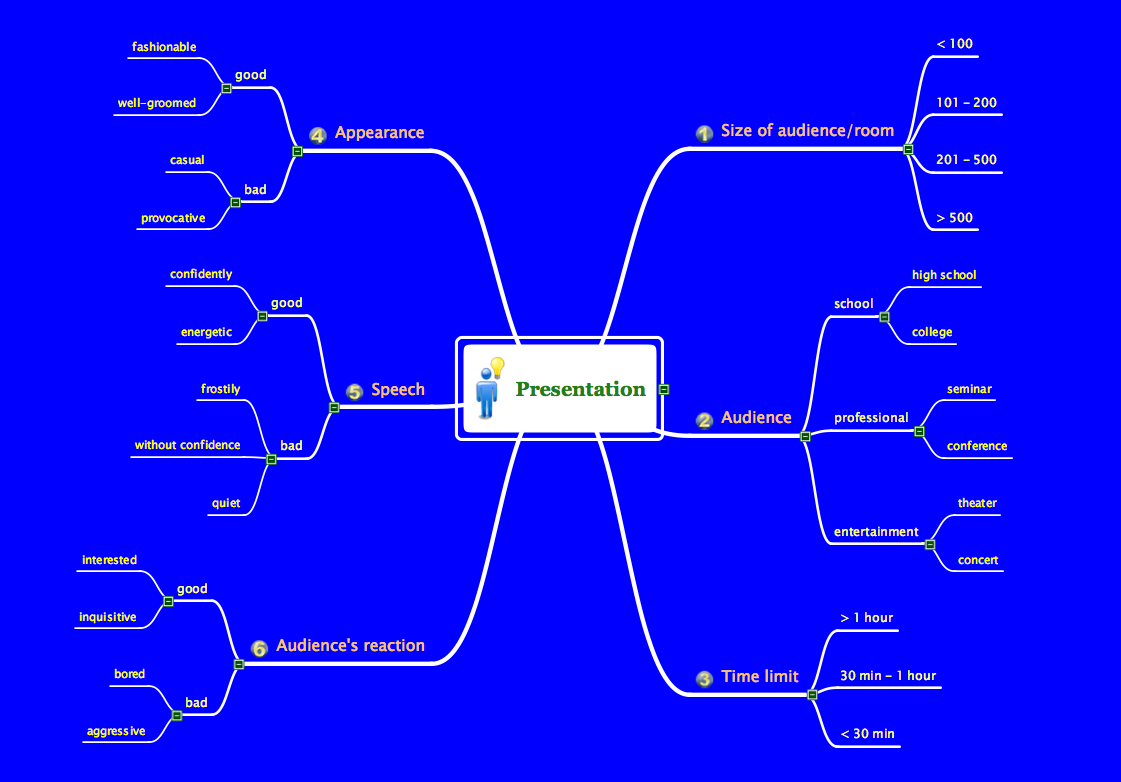
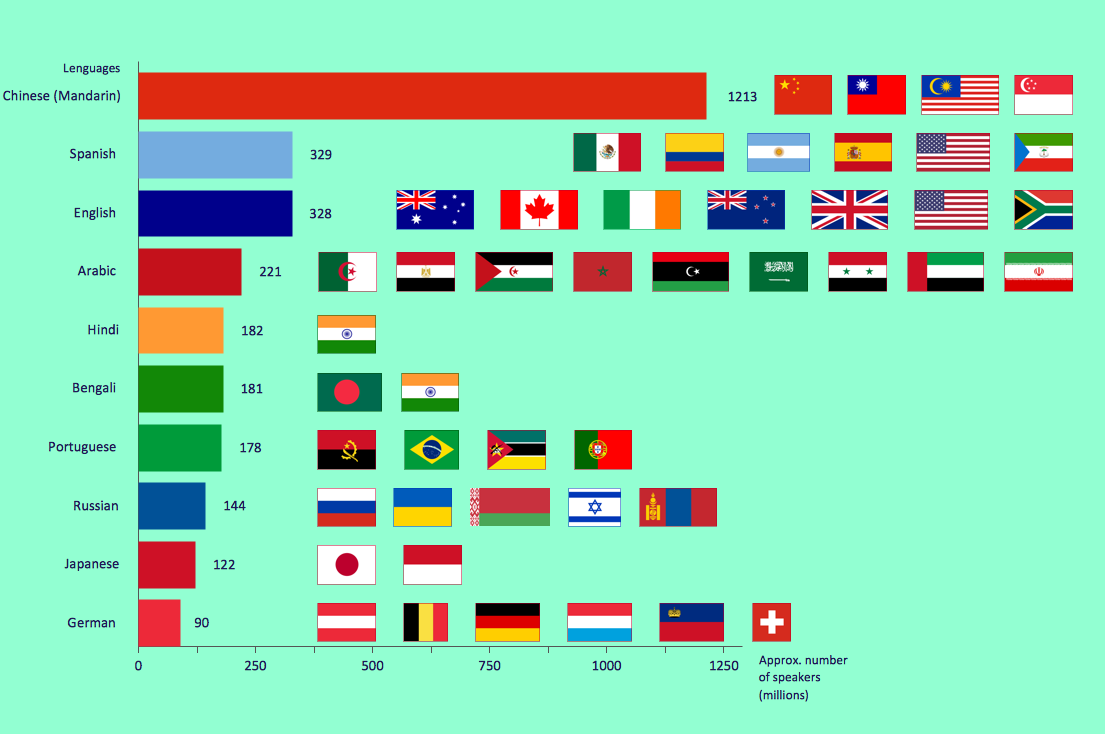
Chart Examples
Charts or graphs represent some data in a graphical way, where data is symbolized by means of lines, bars, or slices. Charts can be used to facilitate understanding of large structures, functions, and different numeric data. Graphs have a wide variety of applications and even a wider variety of types: Pie charts illustrating numerical proportions as slices, Line charts depicting data as a series of points connected by segments, Bar charts showing data as rectangular bars, etc.
 Horizontal Bar Chart
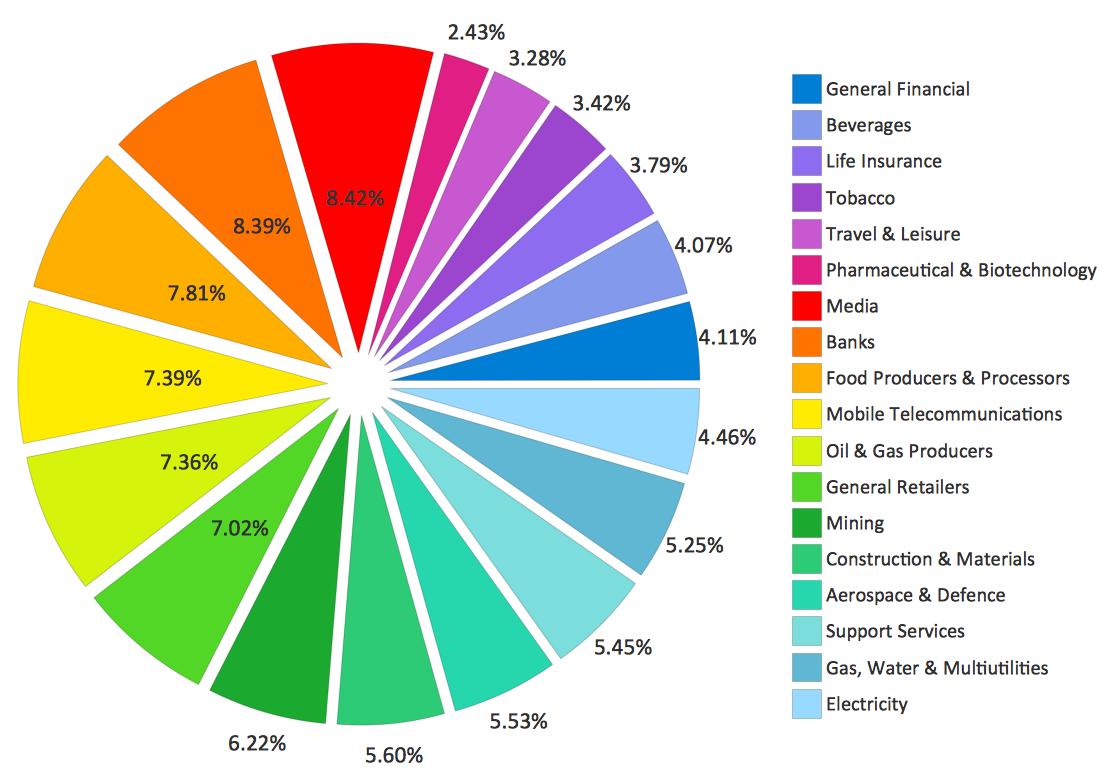 Pie Chart
 Histogram
Project Management Examples
Project management diagrams are used in project management such as Gantt charts, Timeline diagrams, SIPOC diagrams, PERT, and Pareto charts. In general, there are many tools used in project management to perform everyday tasks, control the teamwork, and plan further actions.
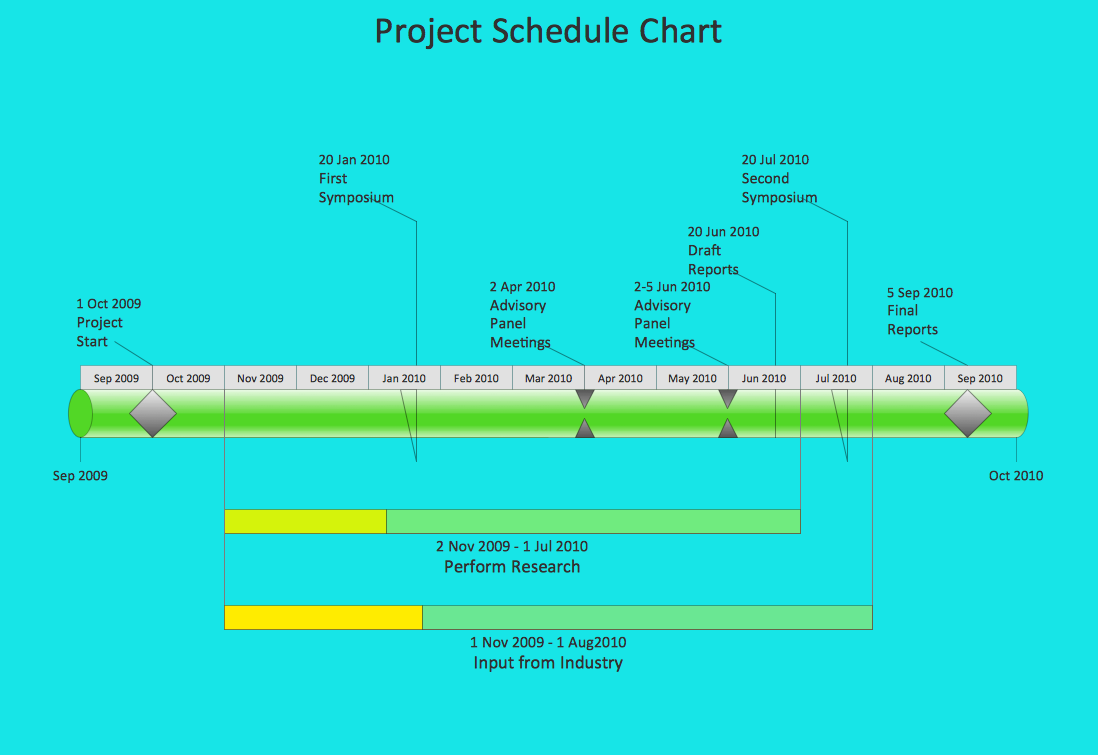 Timeline Software
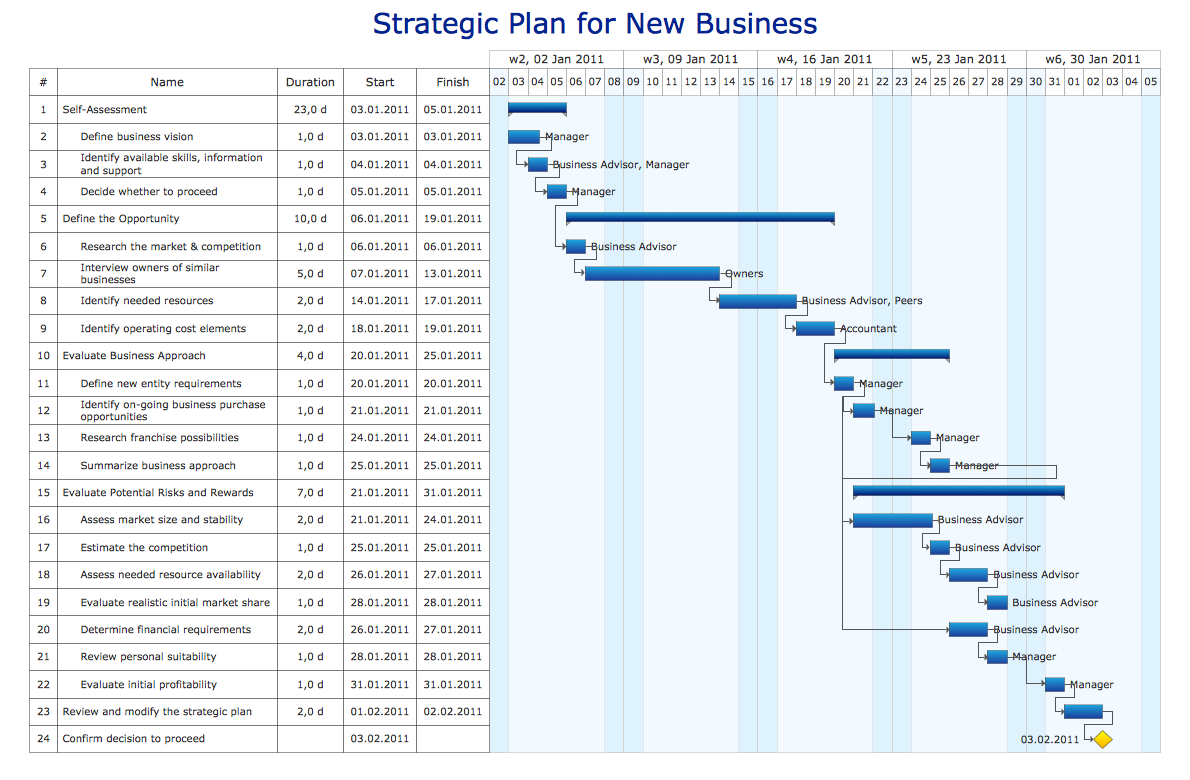
 Calendar Software
Circular Diagram Examples
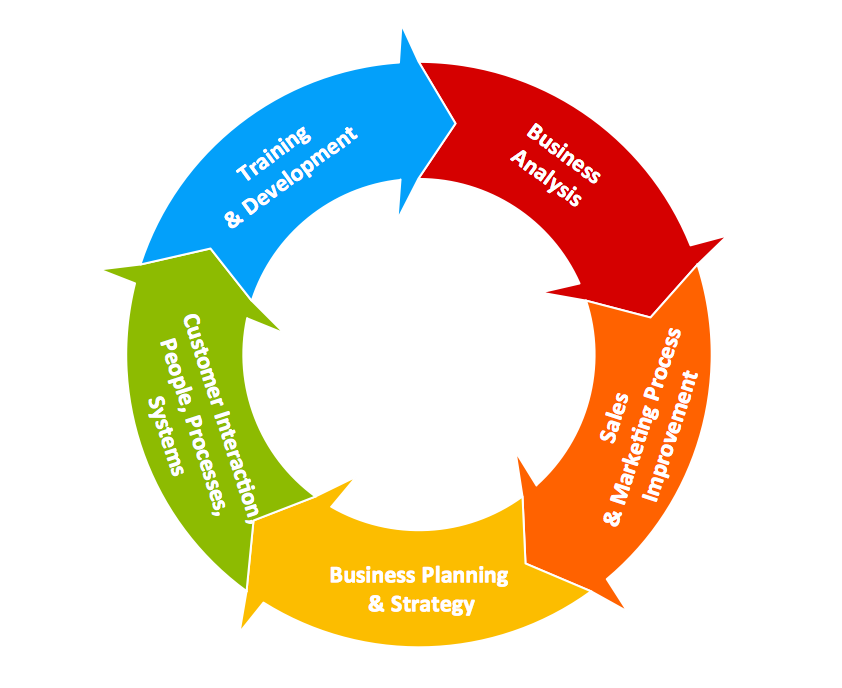
Circular diagrams can be used to show marketing ideas or concepts. Such diagrams represent a sequence of steps in a cycle, where every step leads to next, finally reigniting the loop.
 Circular Arrows Diagram
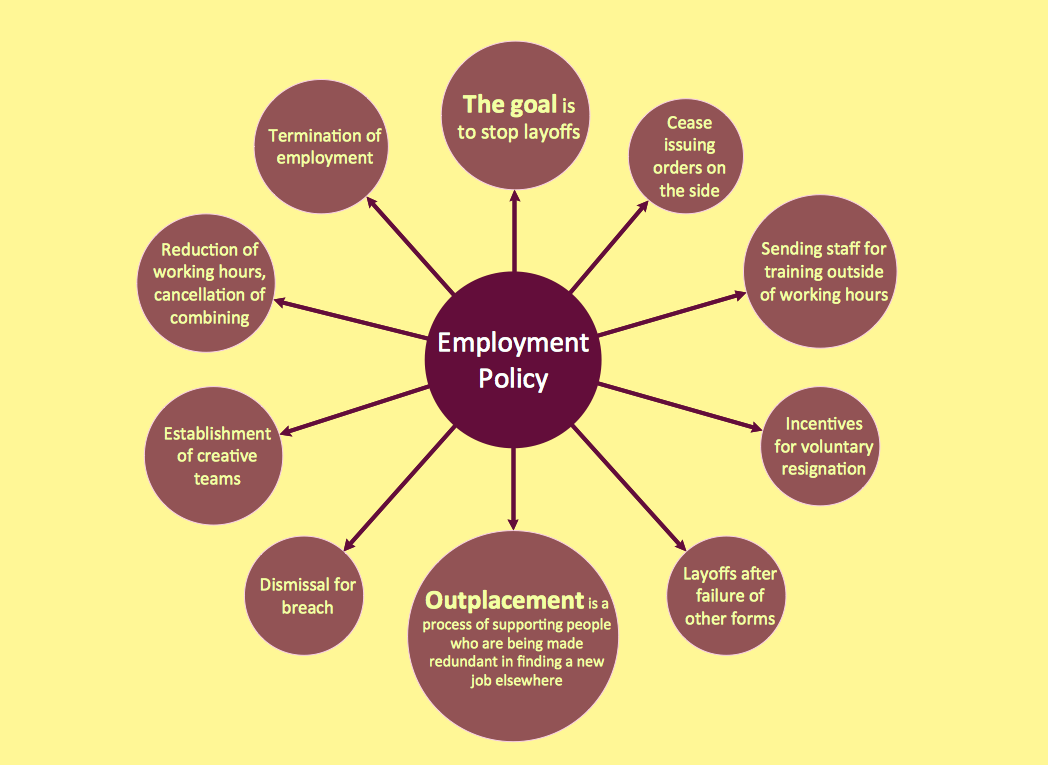
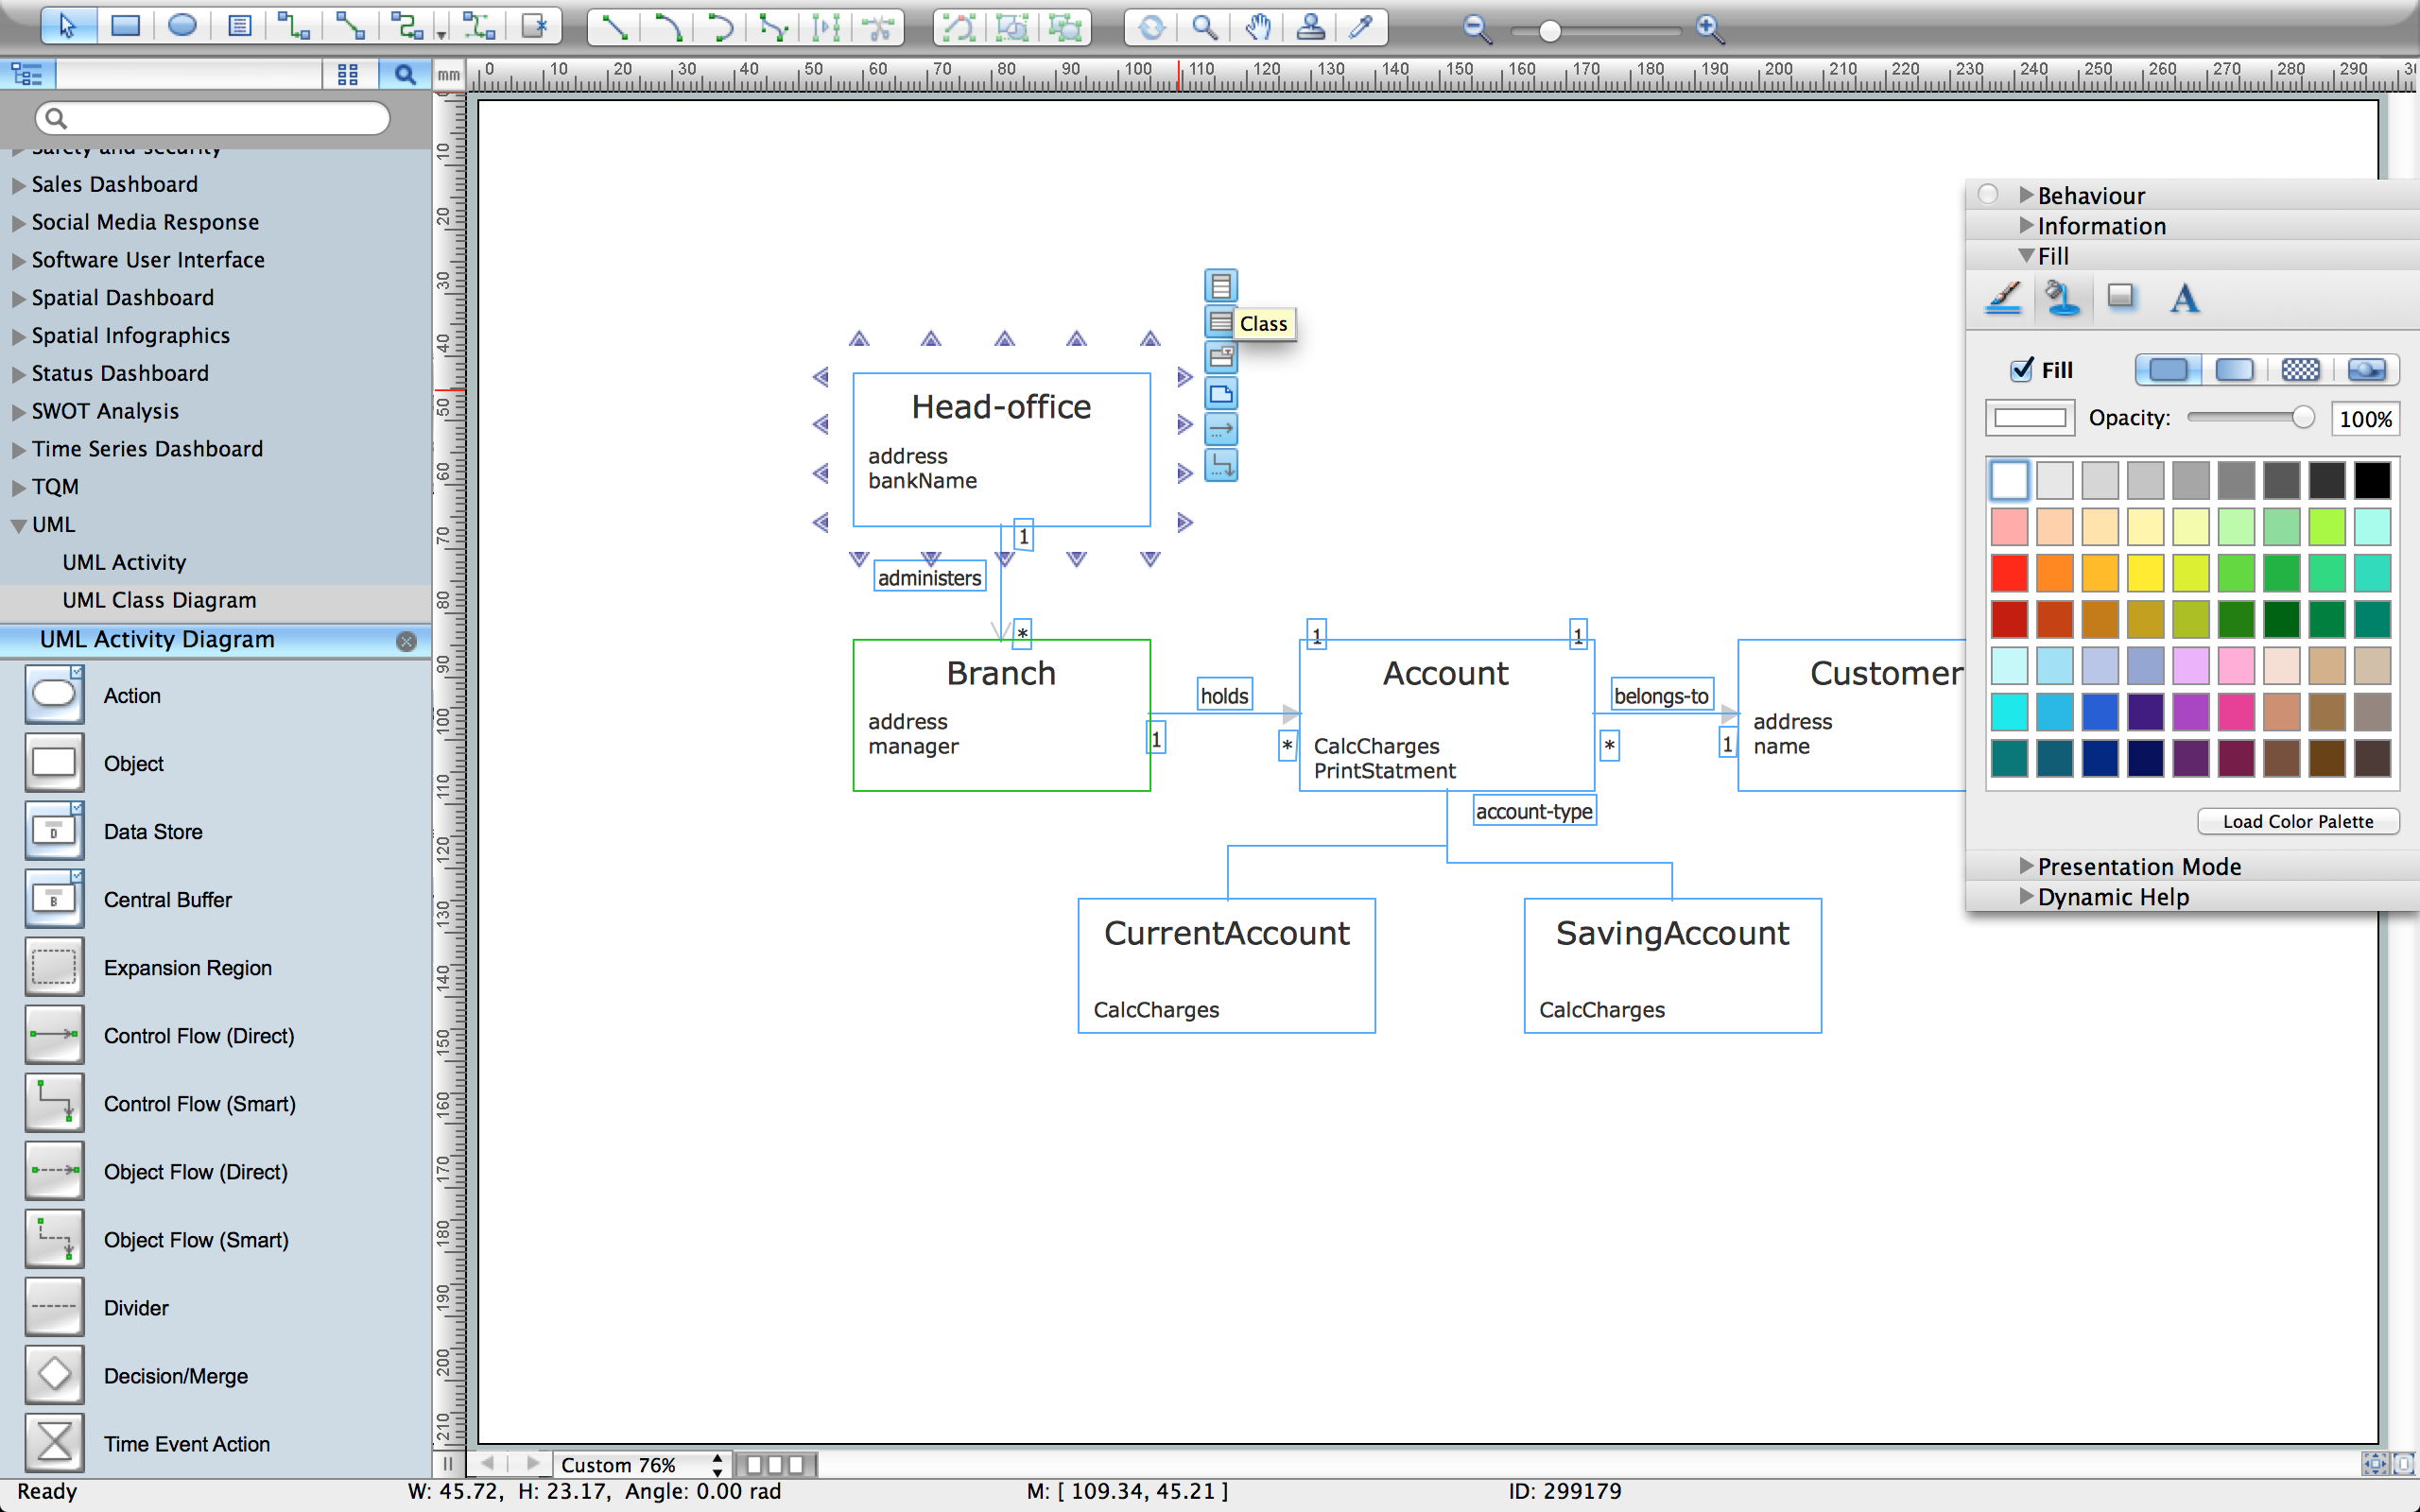
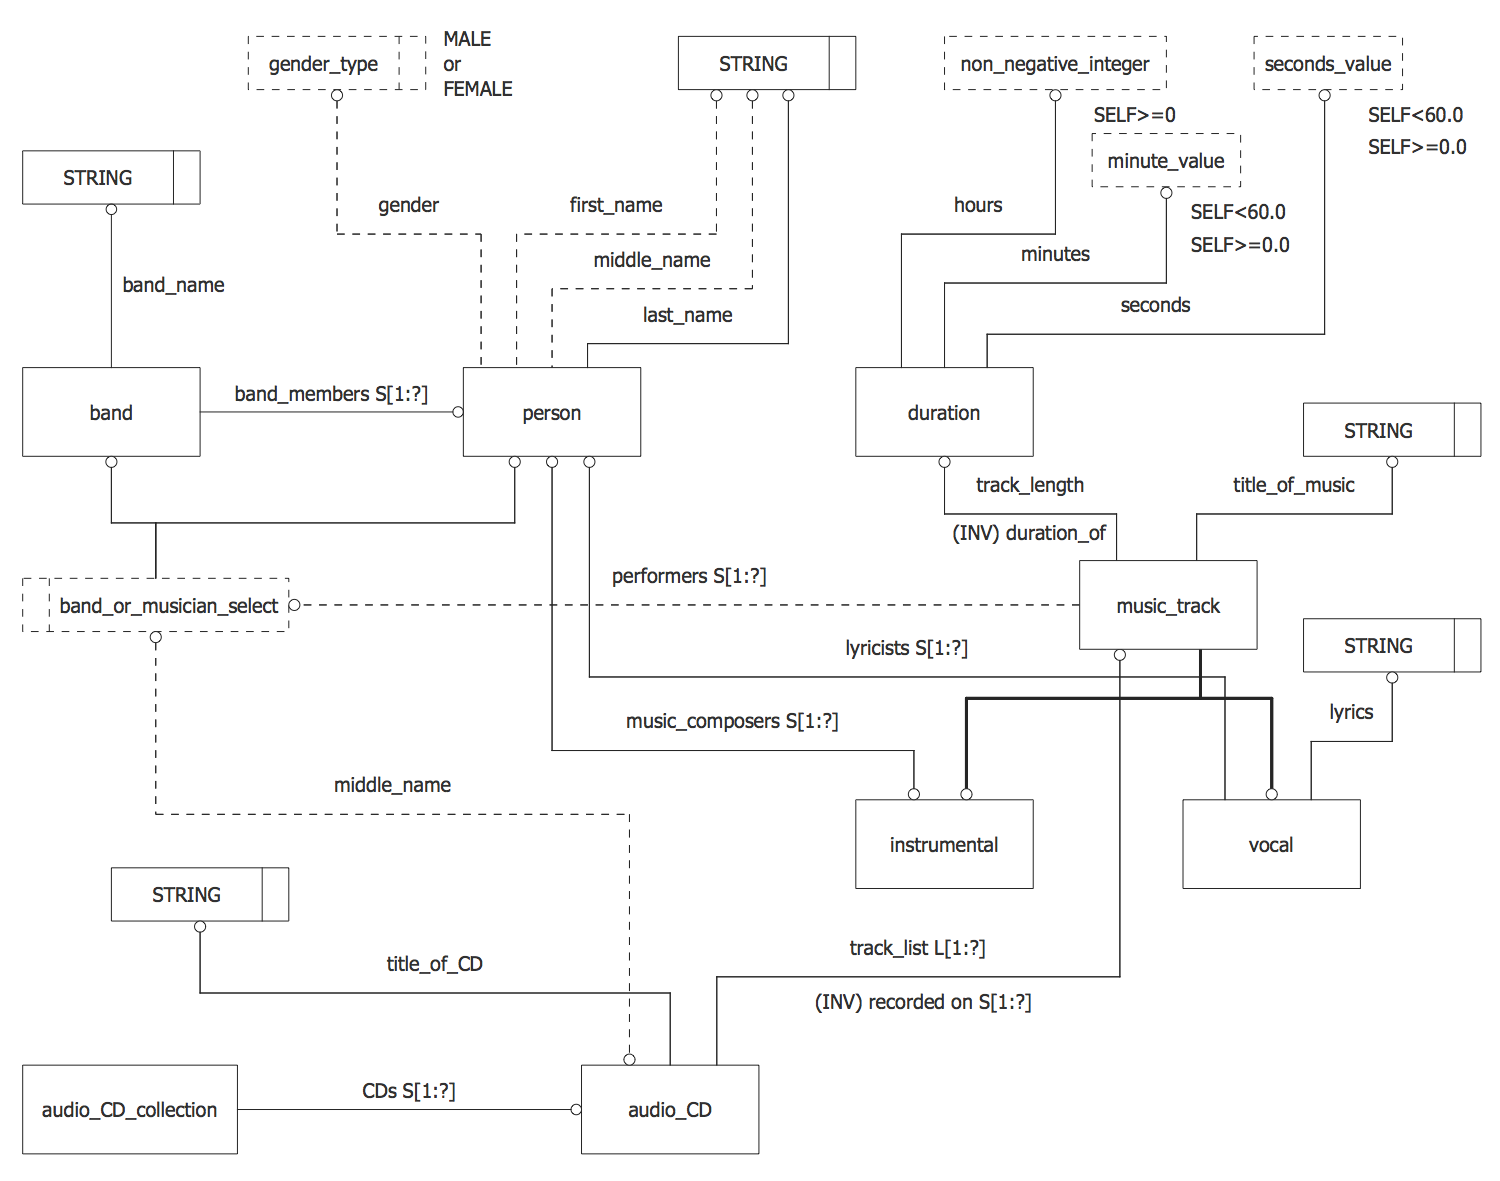
UML Diagram Examples
UML diagrams are designed using Unified Modelling Language (UML), which is an open standard modeling language for systems engineering, business process modeling, software development, and organizational structures mapping. Two main categories of UML diagrams are behavioral diagrams and structural diagrams.
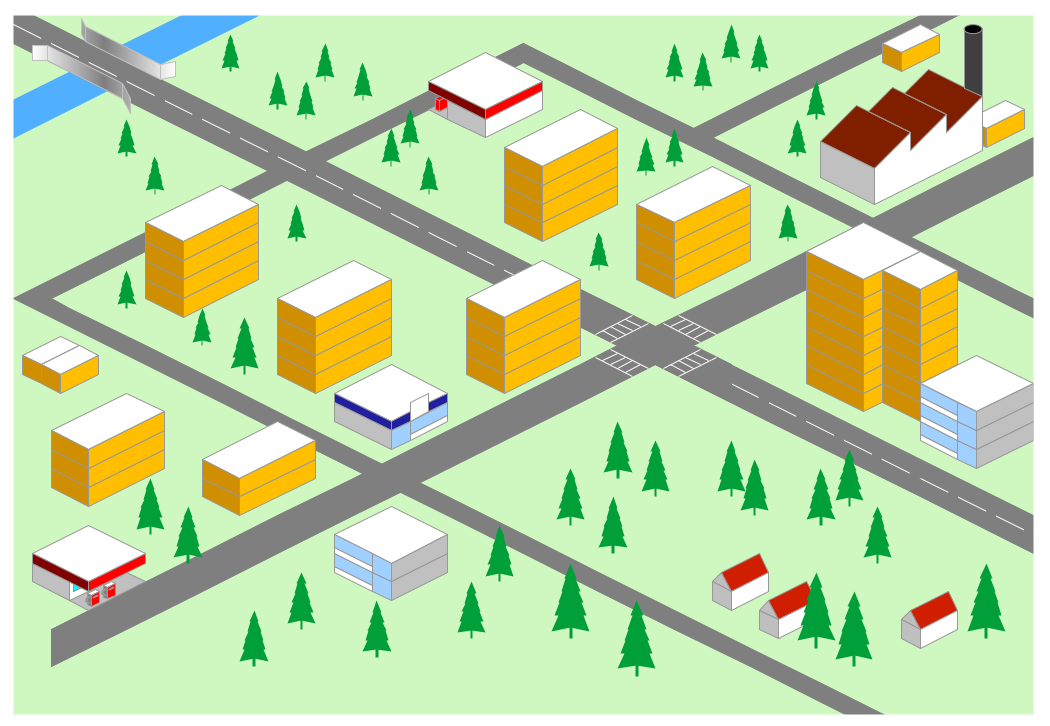
Geo Map Examples
Geo map is a graphic representation of some geographical point, such as country, state, city, or district, which is drawn with accuracy to a scale. Maps can be both two-dimensional and three-dimensional.

Using Flowcharts to Optimize Operations
Flowcharts serve as tools to streamline operational efficiency. Often they are vital in transforming various operations, including decision-making, continuous process improvement, and automation. They help to identify inefficiencies, reduce waste, increase profits, and achieve many other goals. Flowcharts are perfect for visualizing and documenting existing processes, identifying redundancies, bottlenecks, or delays, and optimizing operations in various industries by breaking down complicated operations into clear, manageable steps and taking corresponding corrective action.
Flowcharts help to standardize operations and enhance communication across teams and departments. They assist in improving decision-making by clarifying options and potential outcomes, optimizing resource allocation, and automating operational processes to streamline repetitive tasks and reduce human error. They also help to optimize risk management strategies, develop contingency plans, and streamline customer service workflows. Flowcharts assist in continuous improvement, consistency, and quality control, monitoring KPIs, tracking performance, and reducing waste.
Best Practices for Designing Effective Flowcharts Based on Examples
The importance of effective flowchart design is evident. The best practices include using the powerful flowchart software, which simplifies the drawing process, as well as some other elements. These include defining a clear purpose and scope of the Flowchart, setting boundaries of the process, and breaking complex processes into smaller, easier-to-follow, and manageable sections. Use standard flowchart symbols and conventions to ensure universal understanding and readability, align flowchart elements, and ensure proper spacing between them. Try to avoid unnecessary complexity and overcrowding, ensure clarity, consistent flow and direction, and keep your Flowchart focused.
It is simple to begin with templates or examples of Flow Charts. Use connectors to maintain continuity, even when a Flowchart spans multiple pages, and make clear, concise, and informative labels for each step. This helps to streamline processes, guide the viewer logically through the process, and ensure better communication with stakeholders. At the same time, you can use different colors, line types, and shapes to highlight key steps. However, keep your temper when applying colors to make your chart stylish and aesthetically pleasing. Include a legend explaining unique symbols and color codes to prevent confusion. Incorporate decision points and alternative paths clearly, avoiding too many conditions, and ensure paths are distinct and easy to follow. It is important to ensure scalability for future updates and modifications.
Use ConceptDraw DIAGRAM software and included Flow Chart examples for making your own great-looking charts, flowcharts, schemes, diagrams, and plans, and enjoy the process of creating as well as the final result.

Feedbacks about our Flowchart Software
ConceptDraw Flowchart will assist you in drawing your flowcharts with minimal effort and makes it very easy for beginners to draw professionally designed flowcharts. ConceptDraw also includes suitable connectors and styles or designs to ease the process of creating complex flowcharts. So, if you are having difficulties in creating flowcharts or workflow is slowing you down then consider using ConceptDraw flowchart software to enhance your productivity and speed.
Thank you! Your flowchart program is outstanding! 1. ConceptDraw uses the familiar Microsoft Office user interface, and it looks great! 2.Fast and small! 3.Has the right features! 4.Affortable price. I hope you keep the promotion price. Home users and students can't afford software like Visio.
I can't recommend this flowchart software enough. ConceptDraw has unbelievable functionality for the price. Makes stunning flowcharts like nobody's business. It's such useful software in such a small package, and goes to show how bloated today's software truly is. Best of all, it can export the flowchart to many different kinds of formats. I made my flowchart and exported it as a jpg file, so I could put it on my website. Real easy!
ConceptDraw will help you visualize and structure information, add illustrations and drawings to your documents and make all this rapid and easy. That's possible thanks to the program's intuitive interface, easy-to-use drawing tools, and lots of pre-drawn library objects. Abundant flowchart templates, flowchart symbols and flowchart samples helps to quickly create most common flowcharts.
Great value for money! If flow diagrams are the only thing you plan to use it for, Visio is a little overkill. If you want to use it for other things it's better value for money. Visio is too expensive for my taste, and now I've found ConceptDraw theres no need for other products. Flowchart software similar to Visio Flowchart software for Mac and Windows (ConceptDraw works great on Mac and Windows). I just wanted to write ConceptDraw is great value for money! (It is very easy to use too!) Thanks.